Go Back

Lin
Weekly Market Update: Déjà Vu
There is no end in sight.
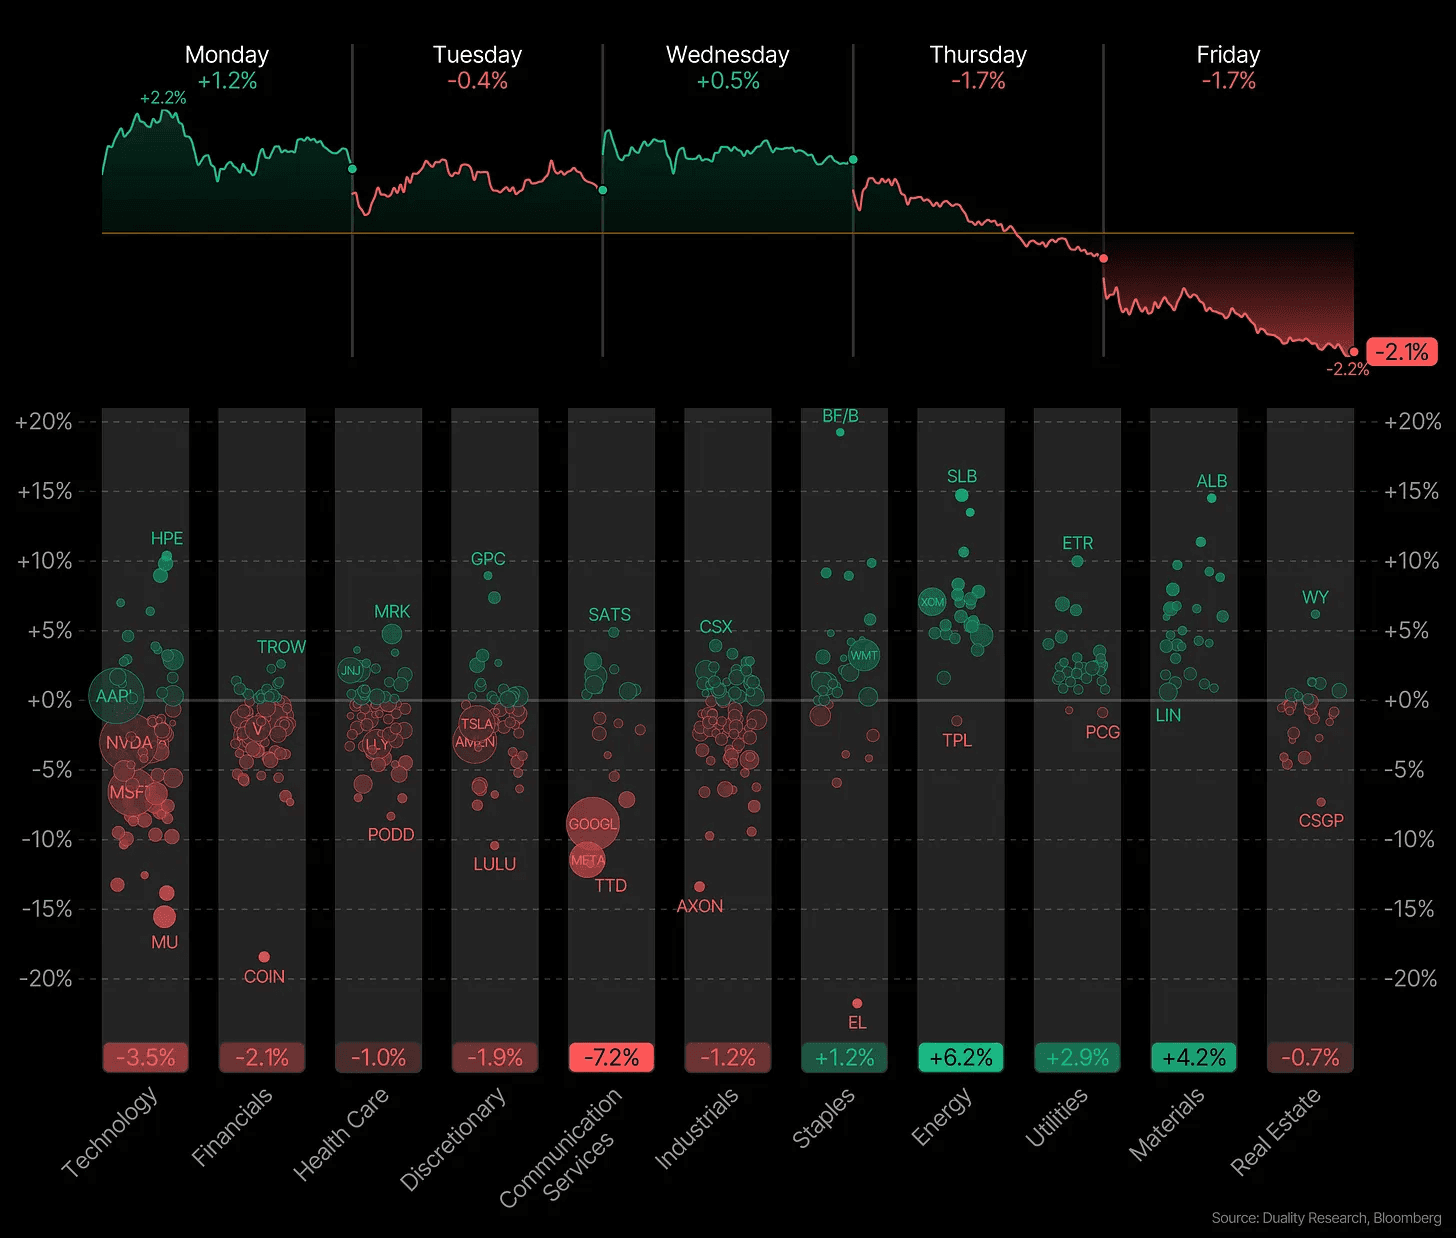
This is the fifth straight down week for the S&P 500, its longest losing streak since the 2022 bear market. And the Nasdaq is now officially in correction territory down more than 10% from its October high.
Unfortunately, it does look like this correction is not done yet. The situation has not improved materially, rather the opposite. What was outlined in last week’s final paragraph continues to describe the situation today. In fact, it aged almost too well.
“My big picture takeaway is that conditions are moving in the right direction for a bottom to start forming. The market will eventually turn, but that day is not today. Bottoms are a process and this one is likely not finished yet. And as long as we are below the 200-day SMA, there is not much to do on the long. If anything large gap ups can be used to reduce exposure.”
The parallels between 2022 and 2026 are striking.
The parallels are uncanny.
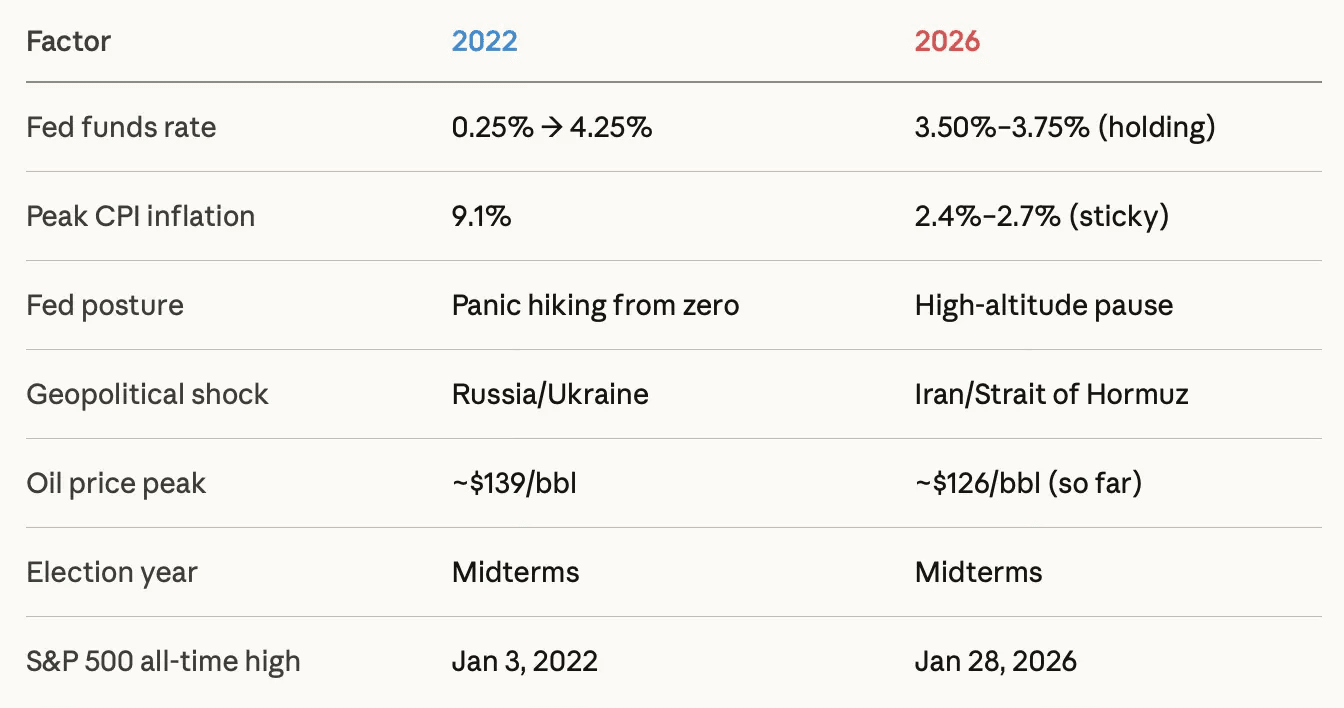
2022 was a midterm election year and so is 2026.
In 2022 Russia’s invasion of Ukraine sent oil from about $95 to nearly $140 in 2 weeks. → Today the Iran conflict and Strait of Hormuz closure pushed Brent above $126 with oil up 37% in a month.
In 2022 the market peaked in January and then started a slow painful grind lower. → This time S&P 500 hit its most recent all time high on January 28th.
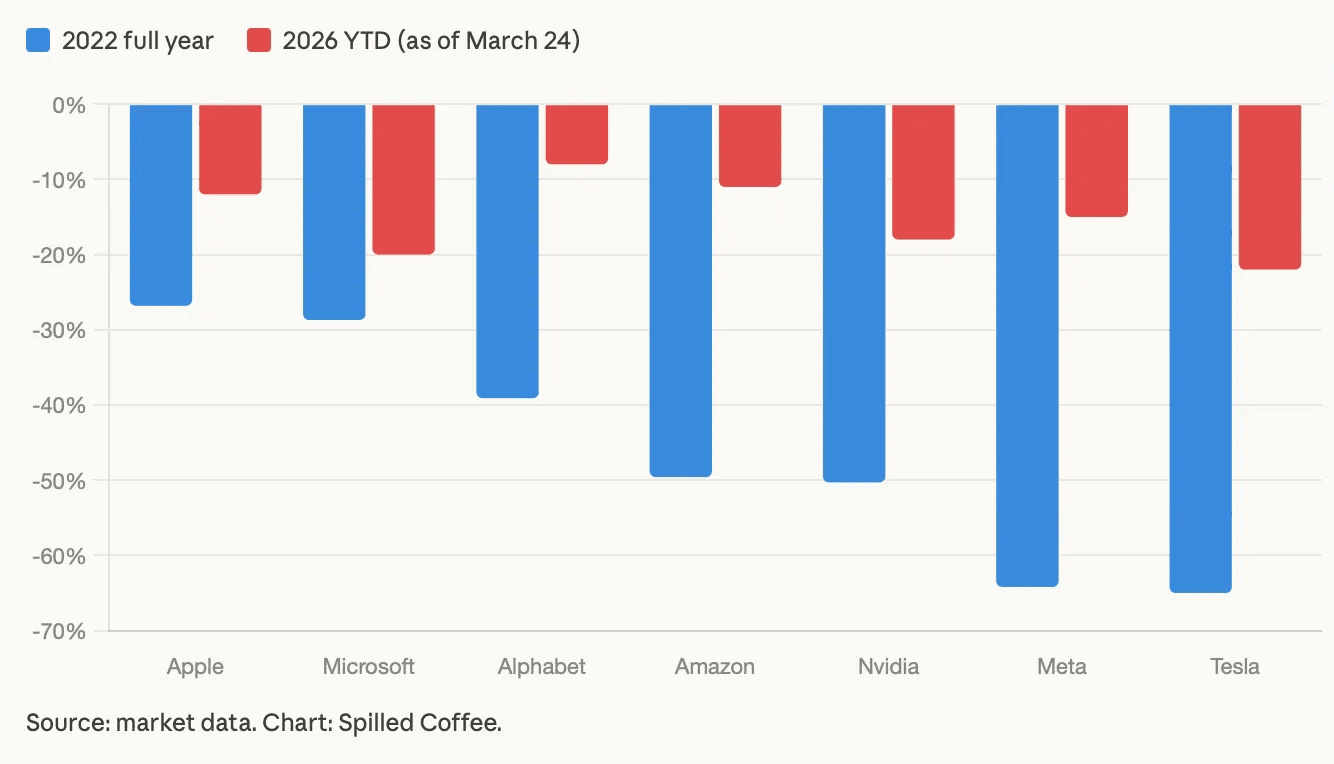
Back then tech stocks led the way down and the Mag 7 got destroyed. → And just like in 2022 the Mag 7 have been leading the way down ever since
Doom and gloom is everywhere on social media just like before
Here is what those stocks did in 2022 and how 2026 is shaping up so far:
Now it’s not been exactly the same.
In 2022, the Fed was behind. Inflation had already exploded to 9.1% while rates were still near zero, and they kept calling it transitory. When reality hit, they had no choice but to react fast. Rates went from 0.25% to 4.25% in a single year. That was the fastest tightening cycle in 40 years.
That is what actually broke the market.
That is not what is happening today.
Today, rates are already at 3.50% to 3.75%. Inflation is not running at 9% anymore, it is closer to 2.5% - at least for now. So, there is no rush to tighten.
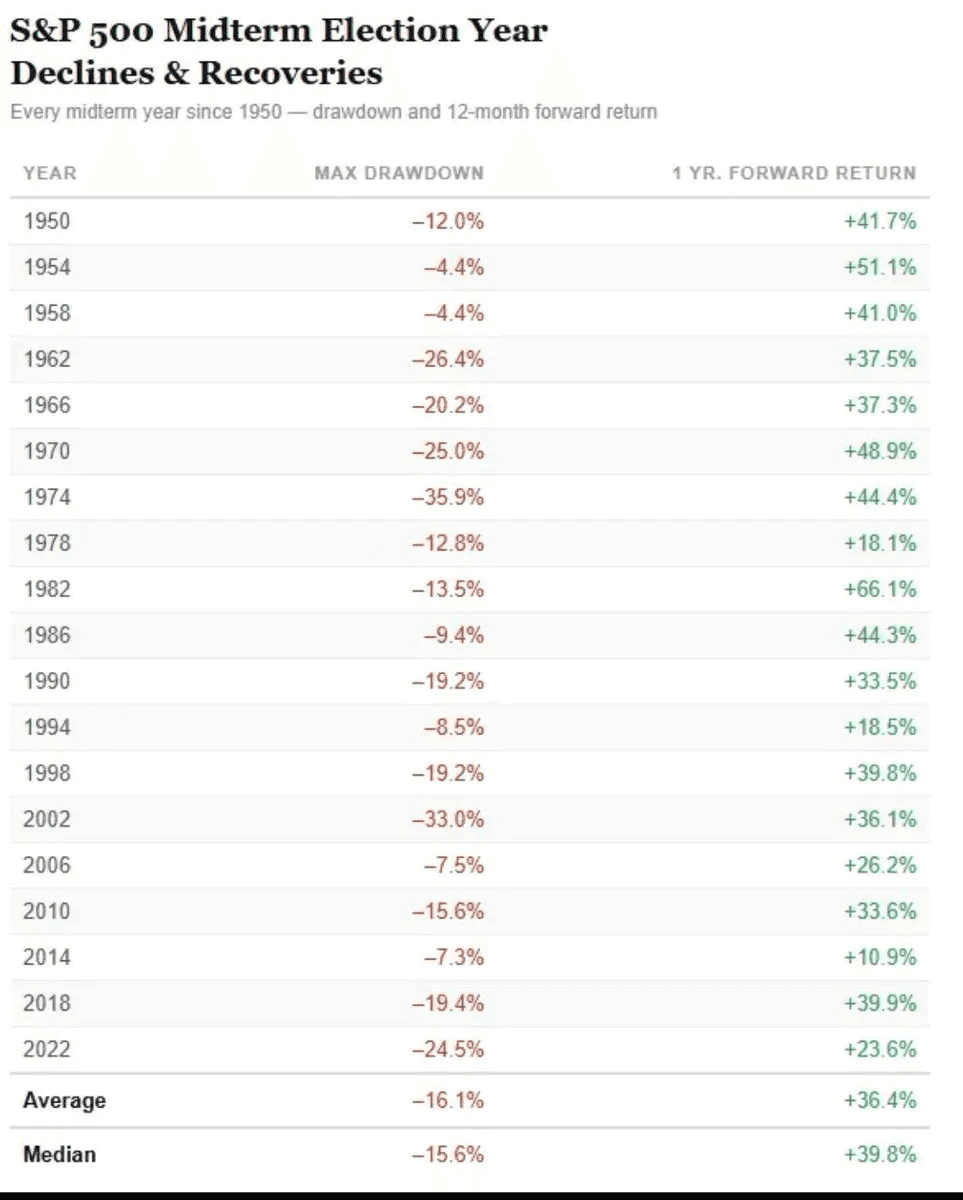
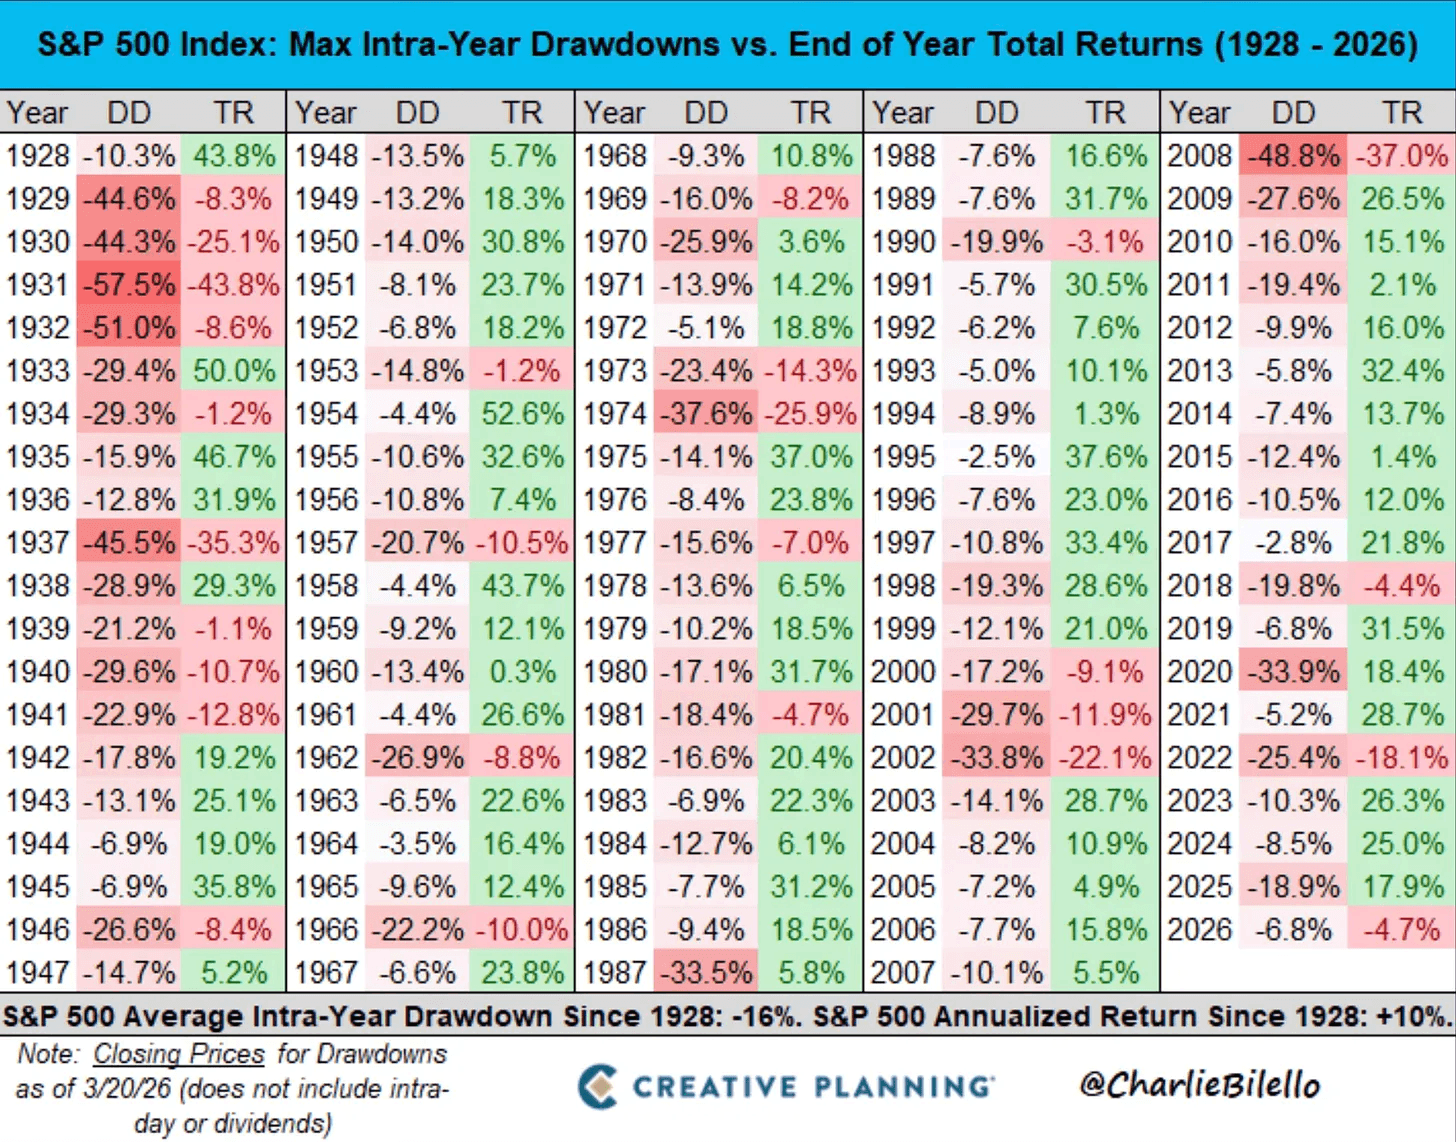
The good news is that once this correction is over, there will be fantastic buying opportunities. So far, the S&P 500 is now down 9%. The average drawdown during a midterm year is 16%. But some of the best 1-year returns happen right after midterm lows.
Drawdowns are more common than most investors think. Most years have scary pullbacks. In fact, the S&P 500 has an average intra-year drawdown of 16% every single year. Every year. And yet, the annualized return since 1928 is +10%. Volatility is the price of admission.
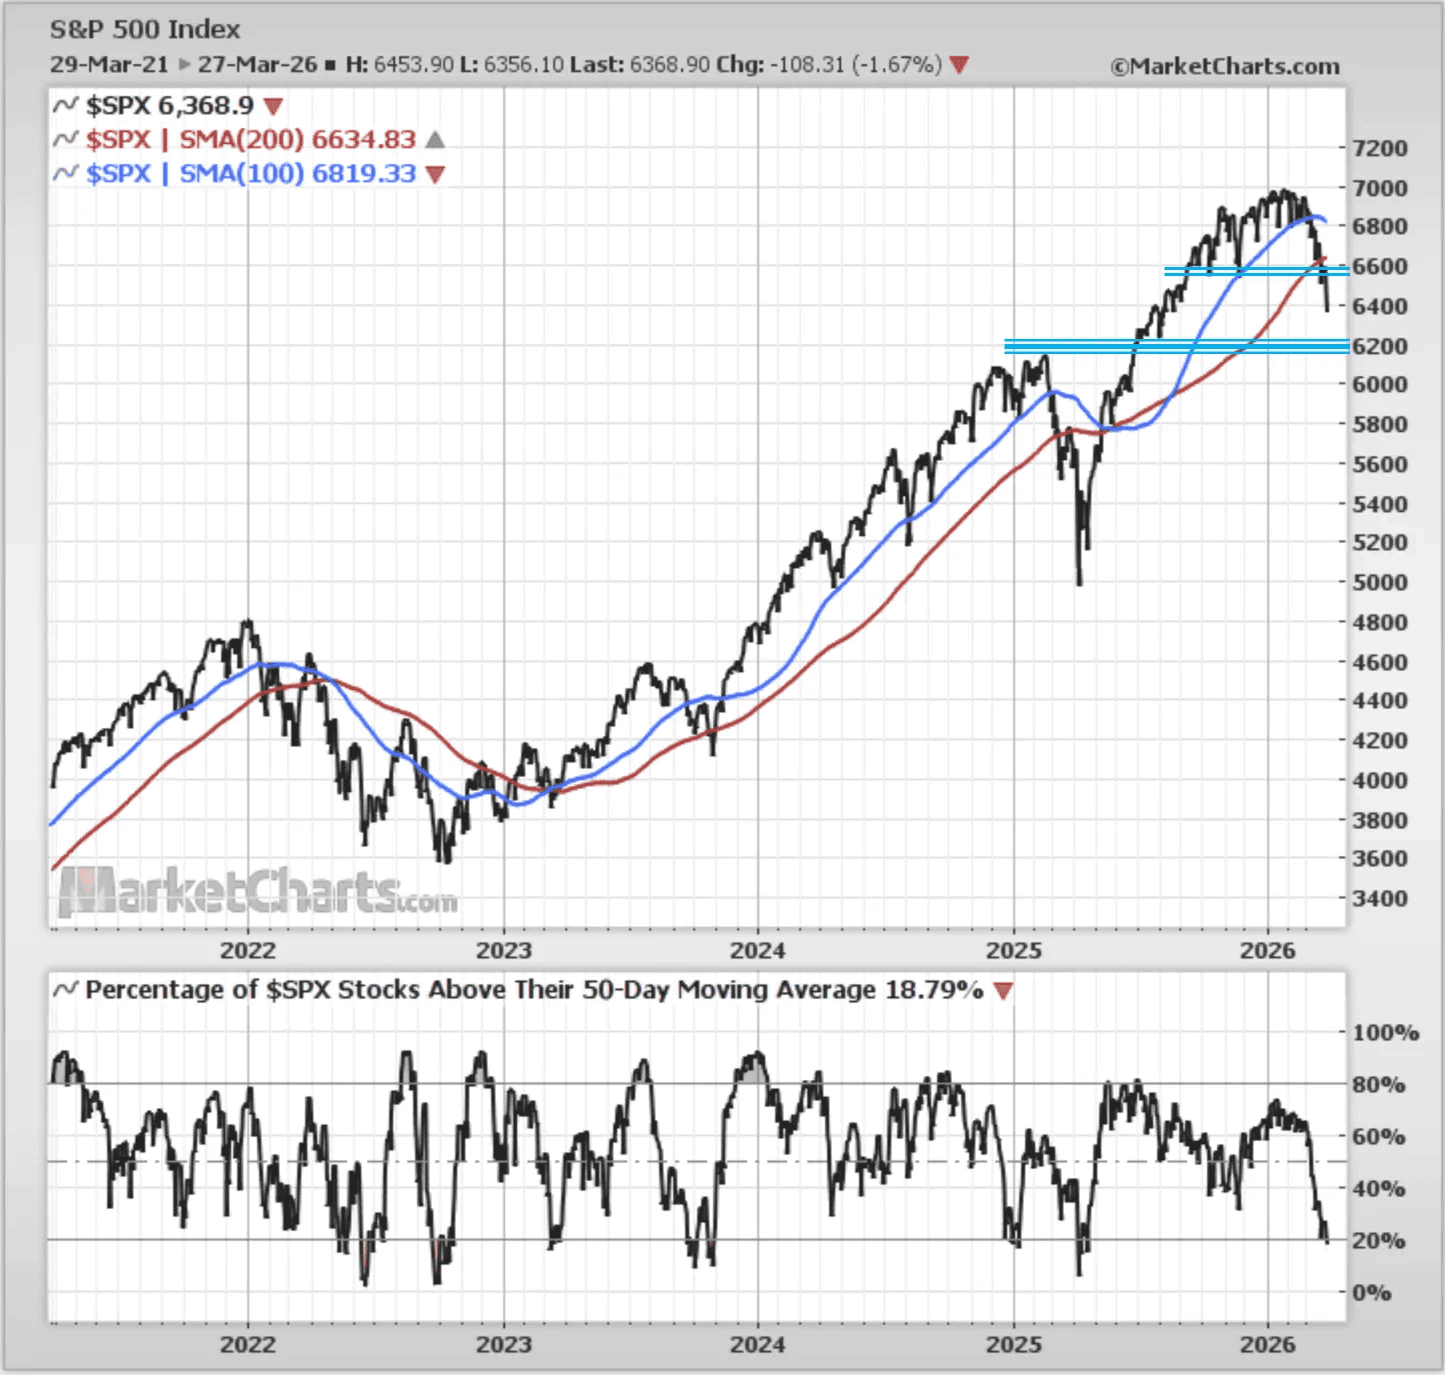
The S&P 500 has now closed below its 200-day moving average for a full week. The longer it stays below it, the longer the correction may last and the harder it will be to recover. If you look at the volume from last April, this is much stronger selling too. This hasn’t been just retail selling. Large institutions are loading off.
It wouldn’t be surprising if we head all the way down toward 6000. That could be good opportunity for some consolidation and a turnaround, but these are only guesstimates. The most important thing to note right now is that the bears are in control, and that is the key thing that matters.
The index already look rough, but under the hood it’s even worse. The average tech stock is down 24.8% from its 52-week high, and most stocks across sectors are getting hit much harder than the index makes it seem. In fact, 16 out of the 25 industry groups are already at least 10% below their highs, and 4 are down over 20%, which means they’re basically in bear market territory. The best-performing sector right now, unsurprisingly, is energy.
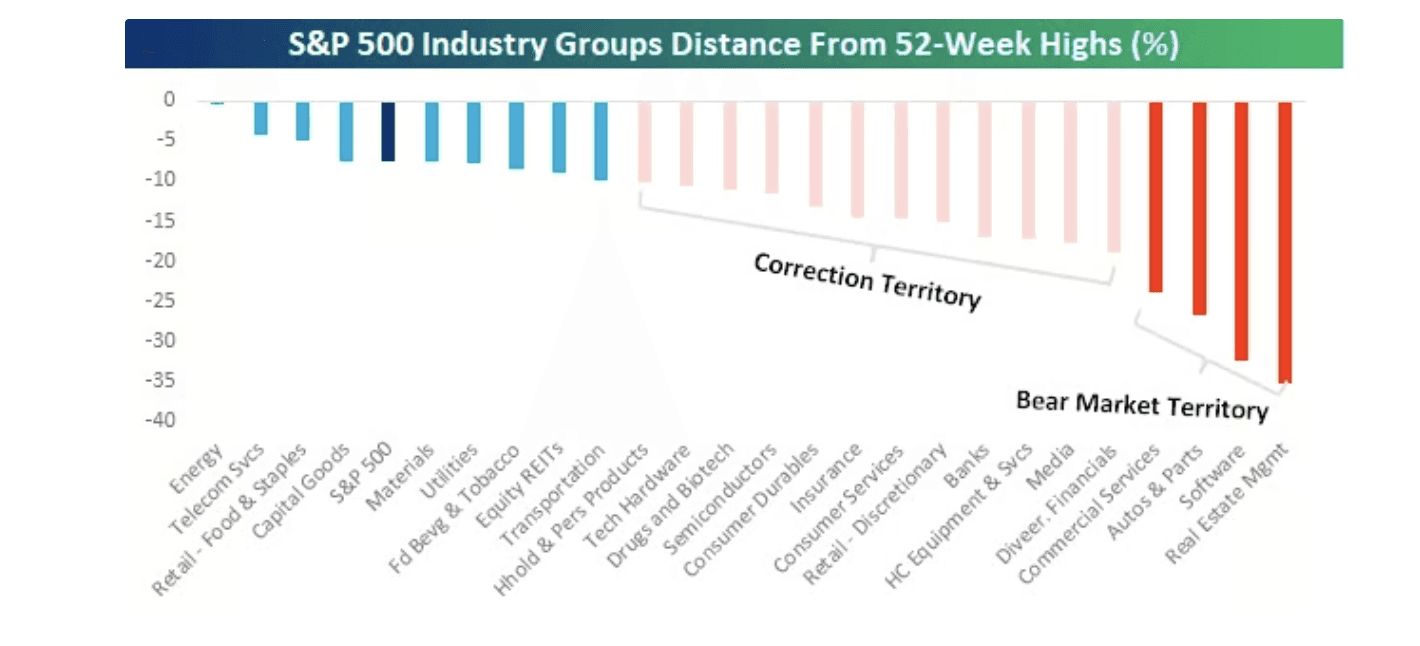
Of course, energy stocks are doing fine. Oil closed above $100 this week.
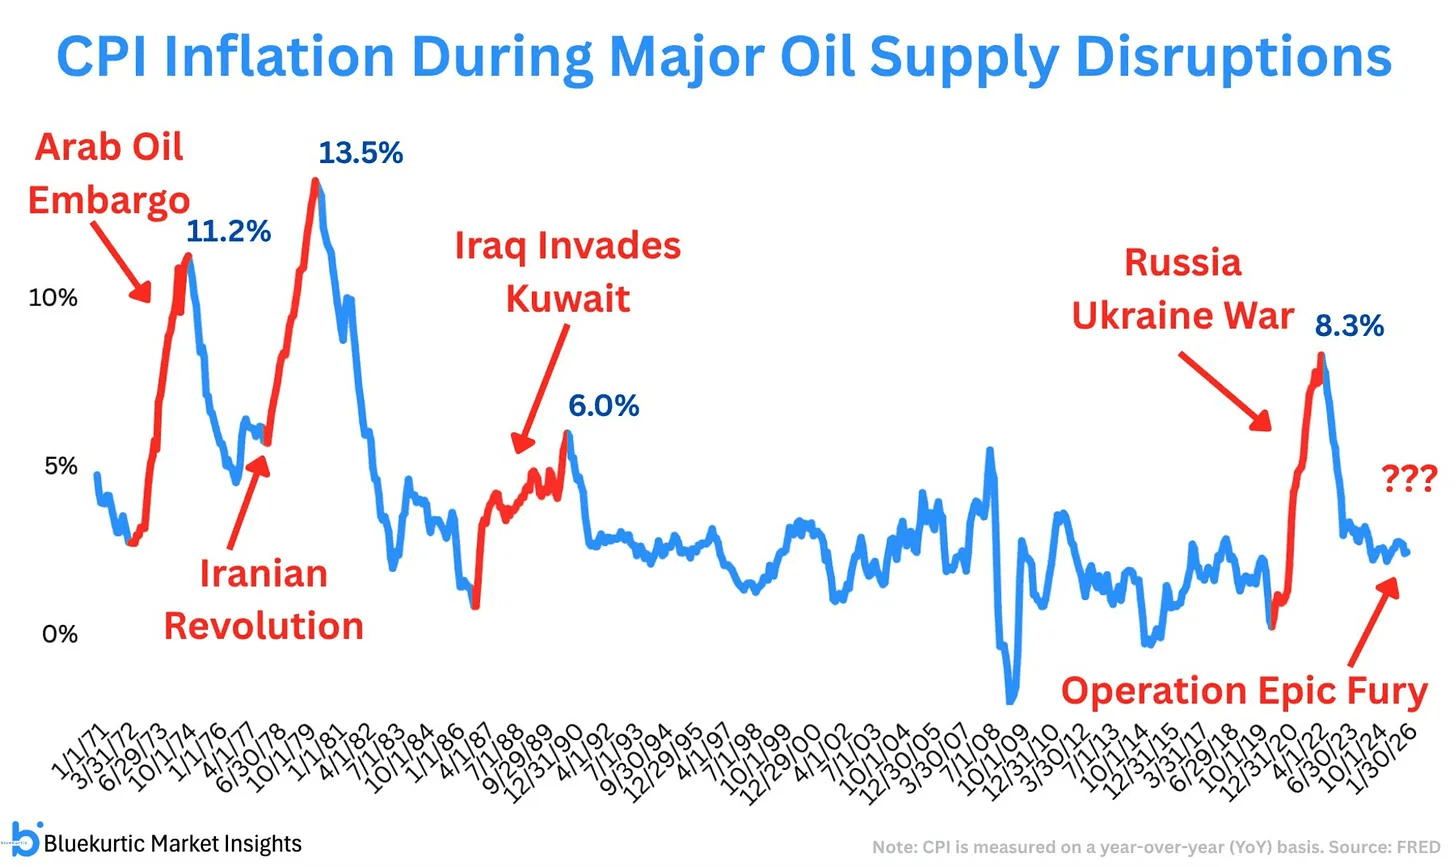
However, every major oil supply disruption since the 1970s has triggered a meaningful inflation spike. The Arab Oil Embargo. The Iranian Revolution. Iraq invading Kuwait. The Russia-Ukraine war. Every single one shows up clearly in the CPI data.
Oil up. Yields up. The longer the Strait stays closed, the more damage compounds across the global economy.
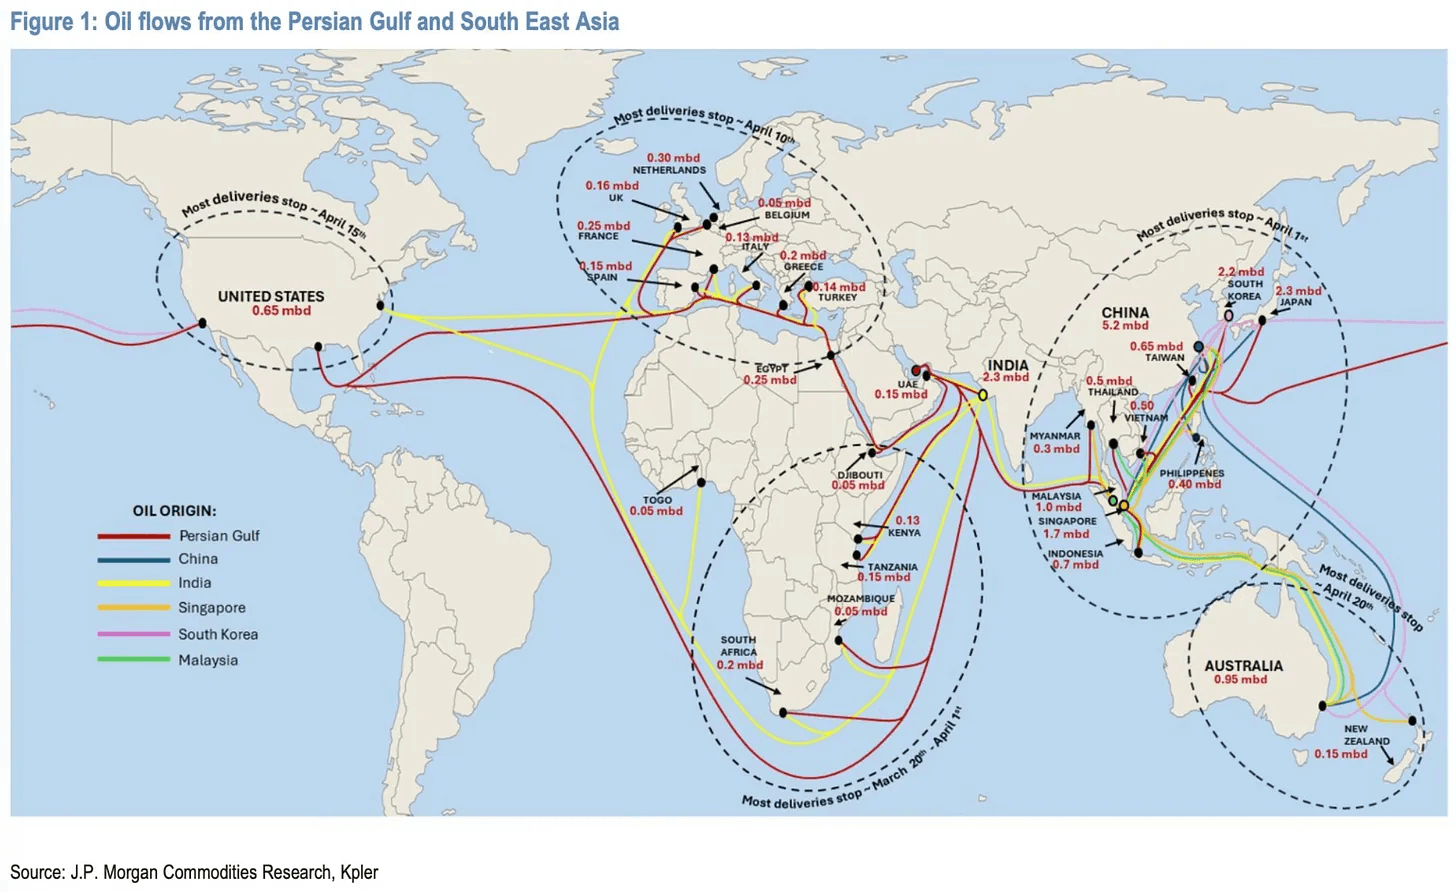
This is what a Strait of Hormuz closure actually looks like in real life. The Strait carries more than 20% of the world’s oil, so when it shuts, everything gets hit pretty quickly. Oil from the Persian Gulf to South Asia and East Africa is already gone. Southeast Asia and Australia start losing most deliveries by April 1, Europe by April 10, and the US by April 15. Countries like China and India are trying to reroute and cover the gaps, but they just can’t fully replace what normally flows through the Strait.
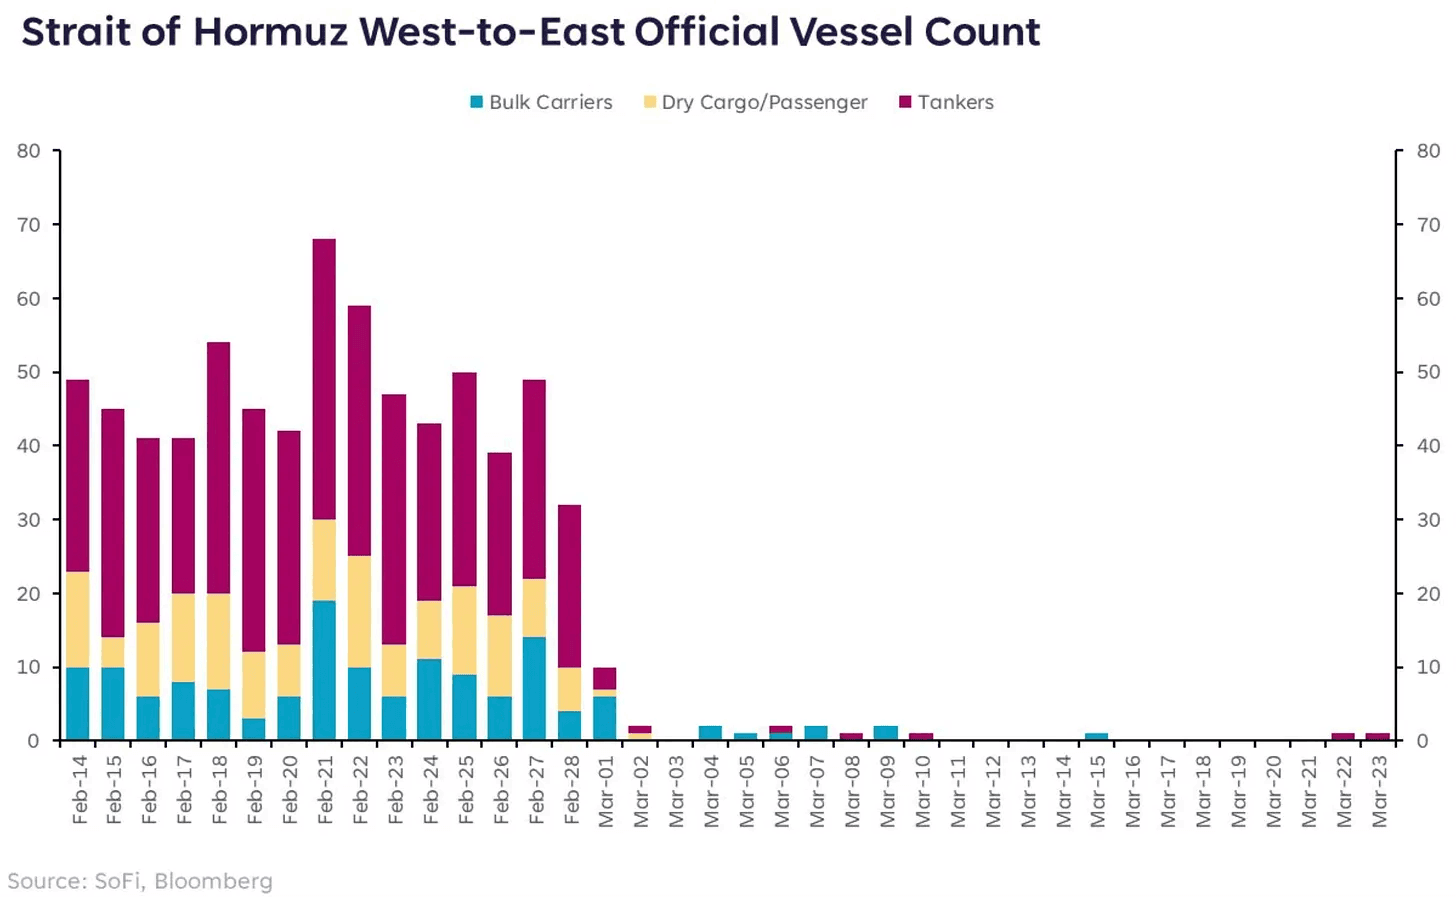
The number of ships going through the Strait used to be around 50 to 70 a day, but it has now basically dropped to zero.
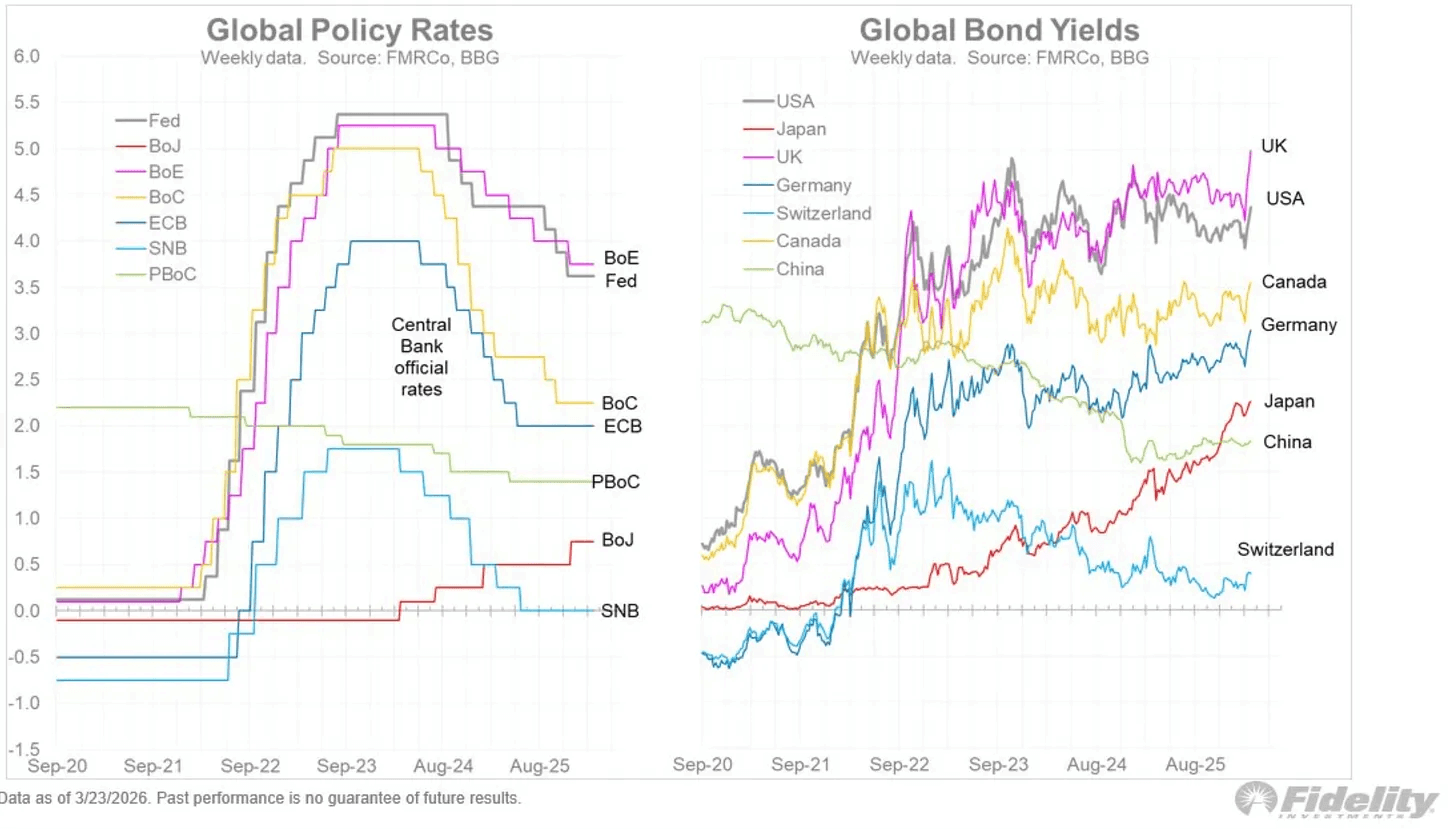
In 2022, yields went up because central banks were aggressively hiking rates to fight inflation. That was policy-driven.
Now it’s more about supply shocks. If oil supply gets disrupted, prices jump, and that pushes inflation back up. At the same time, governments might need to spend more, which means issuing more bonds. More bonds plus higher inflation expectations pushes yields higher.
A month ago the conversation was about rate cuts. Today it is about rate hikes. That is how fast the situation has changed.
As highlighted last week, market bottoms are a process.
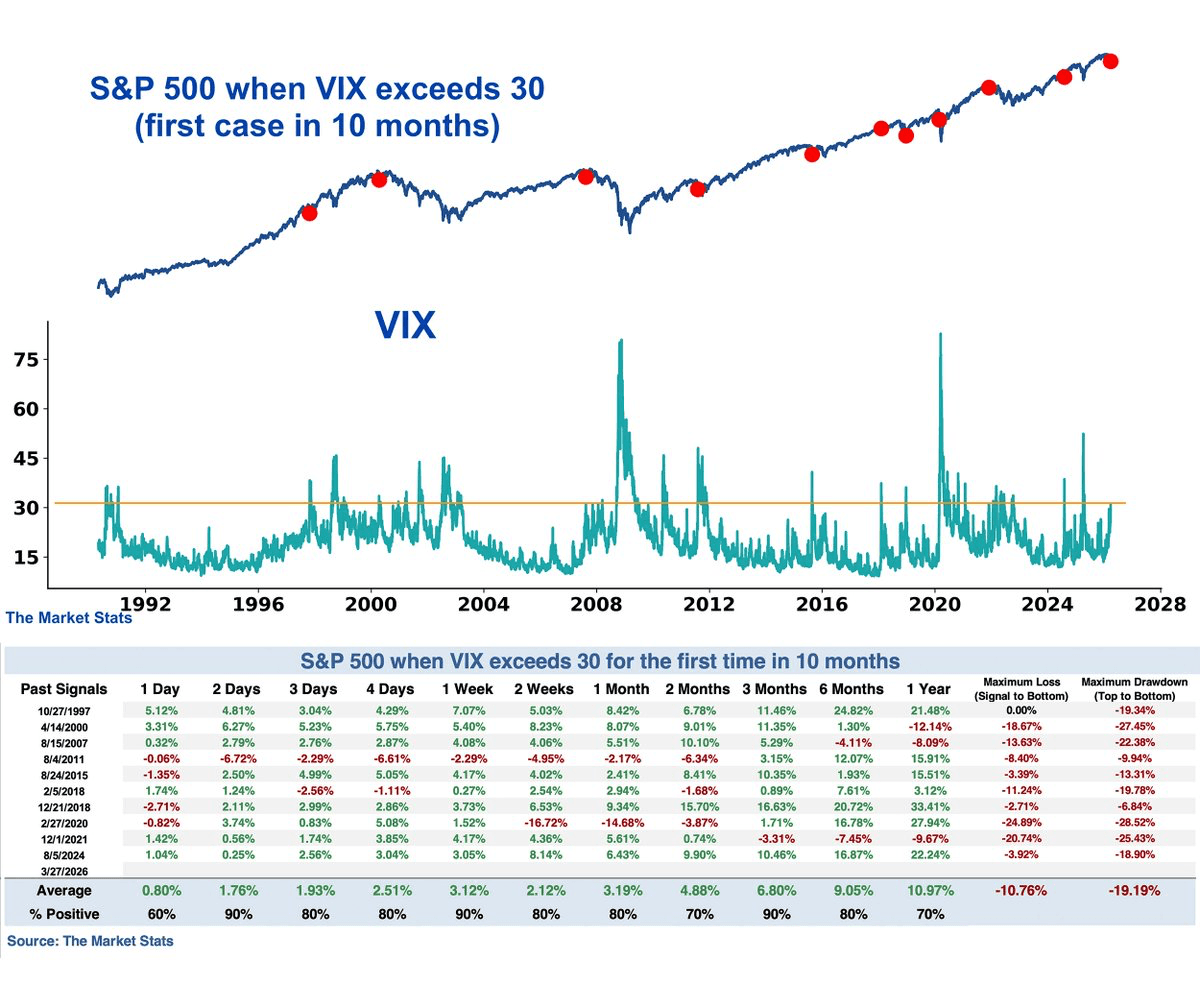
The most reliable bottom signal in market history is simple: wait for real panic, then buy. Every time the VIX spikes and people start calling for the end, it usually sets up the turnaround.
The VIX just closed above 30 for the first time in over 10 months. Historically, when that happens, the S&P 500 has been higher 2 days and 3 months later in 9 out of 10 cases.
But we’re not quite there yet. I’m still waiting for that real panic, the kind where people just give up and sell everything. That’s usually when the market finds a floor. We haven’t seen that yet, and until we do, I don’t think the bottom is in.
So here’s a quick rule of thumb:
VIX 20–30: stay alert and watch closely.
VIX 30–45: start scaling in carefully.
VIX 45+: step in aggressively.
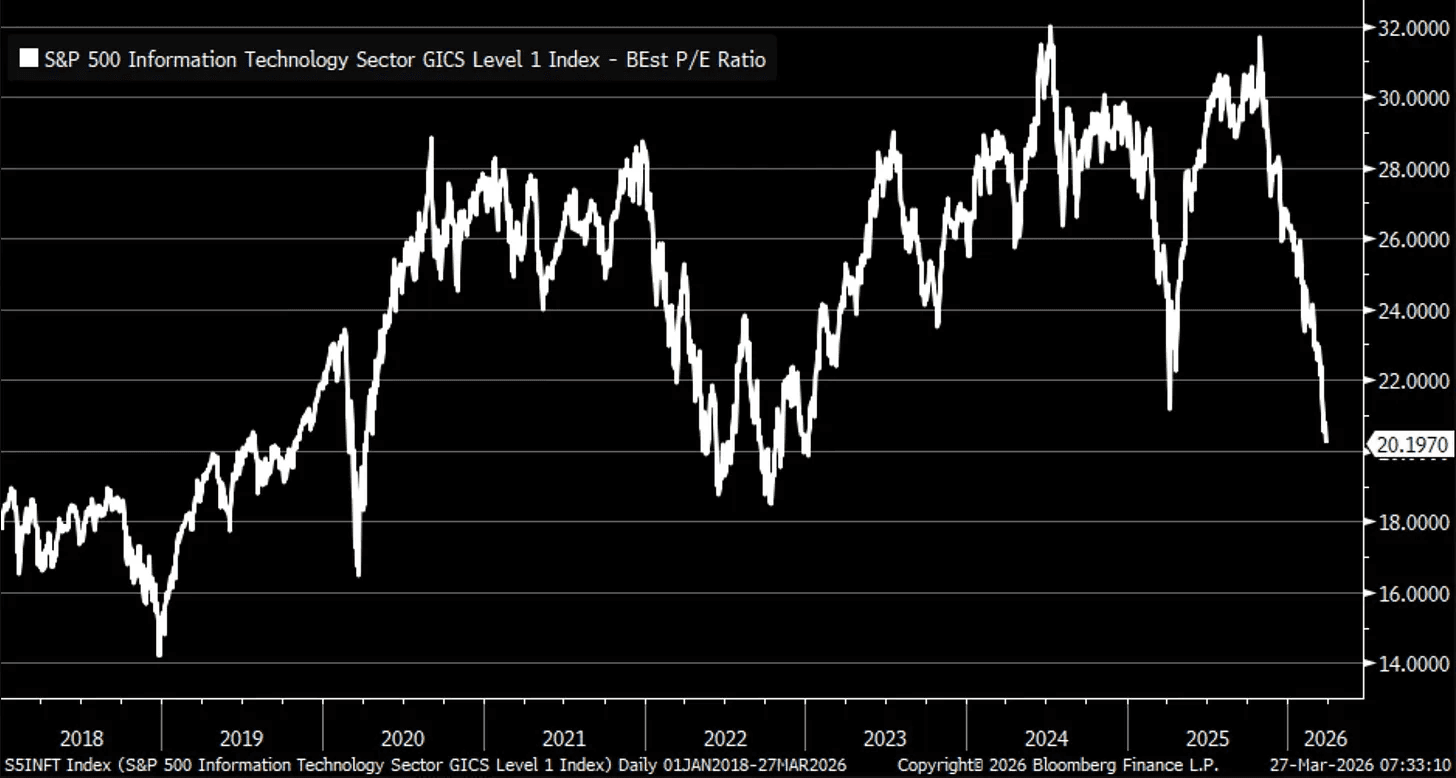
And valuation are starting to become more reasonable too. Tech’s forward P/E has dropped from 31.7 to just over 20 in five months, breaking below prior lows and reaching levels not seen since early 2023. Its premium over the broader S&P 500 has almost disappeared, the lowest since 2019.
I would not call this a bargain yet, but it has moved from expensive to fairly valued very quickly. The key thing to note is that the pendulum rarely stays in the middle. It often swings from expensive to cheap rather than settling at fair value.
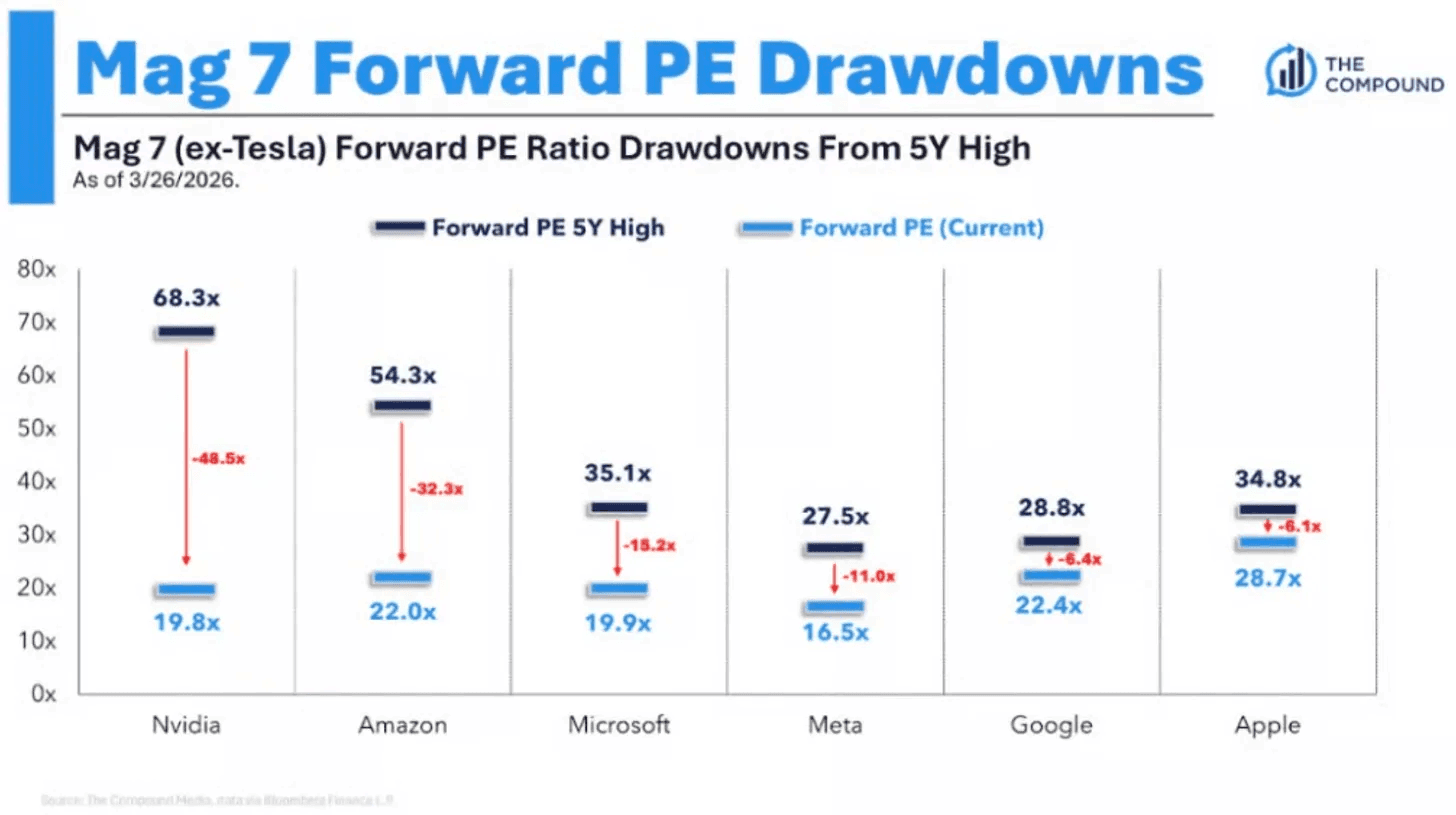
Every single member of the Magnificent 7 is down double digits from its high.
And the valuation reset has been just as dramatic. Four of the six (ex-Tesla) have seen their forward P/E ratios drop by double digits from their five-year highs. Nvidia has gone from 68x to under 20x, Amazon from 54x to 22x, and Microsoft from 35x to under 20x. These are certainly not bubble valuations.
So where does that leave us?
I’m not saying 2026 ends like 2022. It might. It might not. Nobody knows.
What I am saying is the setup today is clearly better than it was in 2022, because the Fed is not the main problem this time. We have a geopolitical shock, a temporary energy spike, an election year, and a Mag 7 selloff. We had all of that in 2022 too, but back then it was layered with one more thing: the most aggressive Fed tightening cycle in modern history.
That piece is missing today.
Every crisis on that chart felt like the end in the moment. The Iran conflict will end up on that chart too, right at the far right, just like everything else that was supposed to kill the bull market. The Crash of 1929. World War II. The Cold War. Black Monday. The dot-com bust. The financial crisis. COVID. Every one of them looked like the end. None of them were.
Previous Updates
View All
- Weekly Market Update: All Eyes On the Mag 7
- Weekly Market Update: Earnings Season Is Here
- Market Update: The FinTech Comeback
- Weekly Market Update: Halftime
- Market Update: The Robots Are Coming
- Weekly Market Update: The Broadening
- Market Update: The Break Point
- Weekly Market Update: Patience
- Market Update: The Memory Crunch
- Weekly Market Update: The First Trillionaire
- Market Update: In Focus
- Weekly Market Update: Deleveraging
- Market Update: A Change of Character