Live Feed
Live Feed
Real-Time Market Updates
Real-Time Market Updates
Turn on notifications to stay updated in real time
here.
Market Opportunities
View All

Lin
PACS
Bullish
PACS Group $PACS
PACS Group is one of the fastest-growing public care platforms in the U.S. They operate skilled nursing facilities and assisted living facilities. Its facilities care for patients after they leave the hospital but still need nursing support, rehab, therapy, wound care, medication management, or longer clinical monitoring.
The key to its growth is a better operating model for a very difficult asset class.. PACS buys or leases skilled nursing facilities, improves how they are run, raises occupancy, improves care quality, manages staffing better, and tries to earn more profit from the same building. High occupancy is critical. A facility that is 95% full can be much more profitable than a facility that is 80% full because the extra patients use the same building and much of the same infrastructure. PACS reported 90.8% overall occupancy, compared with an industry average of around 79%.
Skilled nursing is hard to run. Many facilities are owned by smaller operators that may struggle with staffing, compliance, purchasing, reimbursement, training, technology, and quality reporting. PACS can bring stronger systems, better reimbursement knowledge, local operating discipline, and scale benefits.
They now operate 323 healthcare facilities across 17 U.S. states, with 32,757 skilled nursing beds and 2,759 assisted living beds.
PACS makes money mainly from Medicare, Medicaid, managed care insurers, and private-pay patients. These payers have different margin profiles. Medicare and higher-acuity short-stay patients are usually more attractive than long-stay Medicaid patients, while managed care depends heavily on contract terms, authorization rules, denial behavior, and length of stay.
The company has been growing quickly. In FY 2025, PACS reported $5.29B of revenue, up 29.3% year over year, with $191.5M of net income and $505M of adjusted EBITDA. In Q1 2026, revenue was $1.42B, net income was $80.7M, adjusted EBITDA was $170.4M.
After a huge move in November, it spent 7 months building a base. And is starting breakout to new all-time highs as the market continues to rotate into new sectors.


Company
PACS group
Sector
Healthcare
Grade
B+
Setup
Breakout
Volatility
Moderate
Timeframe
Mid-Term
Read More
Lin
PACS
Bullish
PACS Group $PACS
PACS Group is one of the fastest-growing public care platforms in the U.S. They operate skilled nursing facilities and assisted living facilities. Its facilities care for patients after they leave the hospital but still need nursing support, rehab, therapy, wound care, medication management, or longer clinical monitoring.
The key to its growth is a better operating model for a very difficult asset class.. PACS buys or leases skilled nursing facilities, improves how they are run, raises occupancy, improves care quality, manages staffing better, and tries to earn more profit from the same building. High occupancy is critical. A facility that is 95% full can be much more profitable than a facility that is 80% full because the extra patients use the same building and much of the same infrastructure. PACS reported 90.8% overall occupancy, compared with an industry average of around 79%.
Skilled nursing is hard to run. Many facilities are owned by smaller operators that may struggle with staffing, compliance, purchasing, reimbursement, training, technology, and quality reporting. PACS can bring stronger systems, better reimbursement knowledge, local operating discipline, and scale benefits.
They now operate 323 healthcare facilities across 17 U.S. states, with 32,757 skilled nursing beds and 2,759 assisted living beds.
PACS makes money mainly from Medicare, Medicaid, managed care insurers, and private-pay patients. These payers have different margin profiles. Medicare and higher-acuity short-stay patients are usually more attractive than long-stay Medicaid patients, while managed care depends heavily on contract terms, authorization rules, denial behavior, and length of stay.
The company has been growing quickly. In FY 2025, PACS reported $5.29B of revenue, up 29.3% year over year, with $191.5M of net income and $505M of adjusted EBITDA. In Q1 2026, revenue was $1.42B, net income was $80.7M, adjusted EBITDA was $170.4M.
After a huge move in November, it spent 7 months building a base. And is starting breakout to new all-time highs as the market continues to rotate into new sectors.
Company
PACS group
Sector
Healthcare
Grade
B+
Setup
Breakout
Volatility
Moderate
Timeframe
Mid-Term
Read More
Lin
CGNX
Bullish
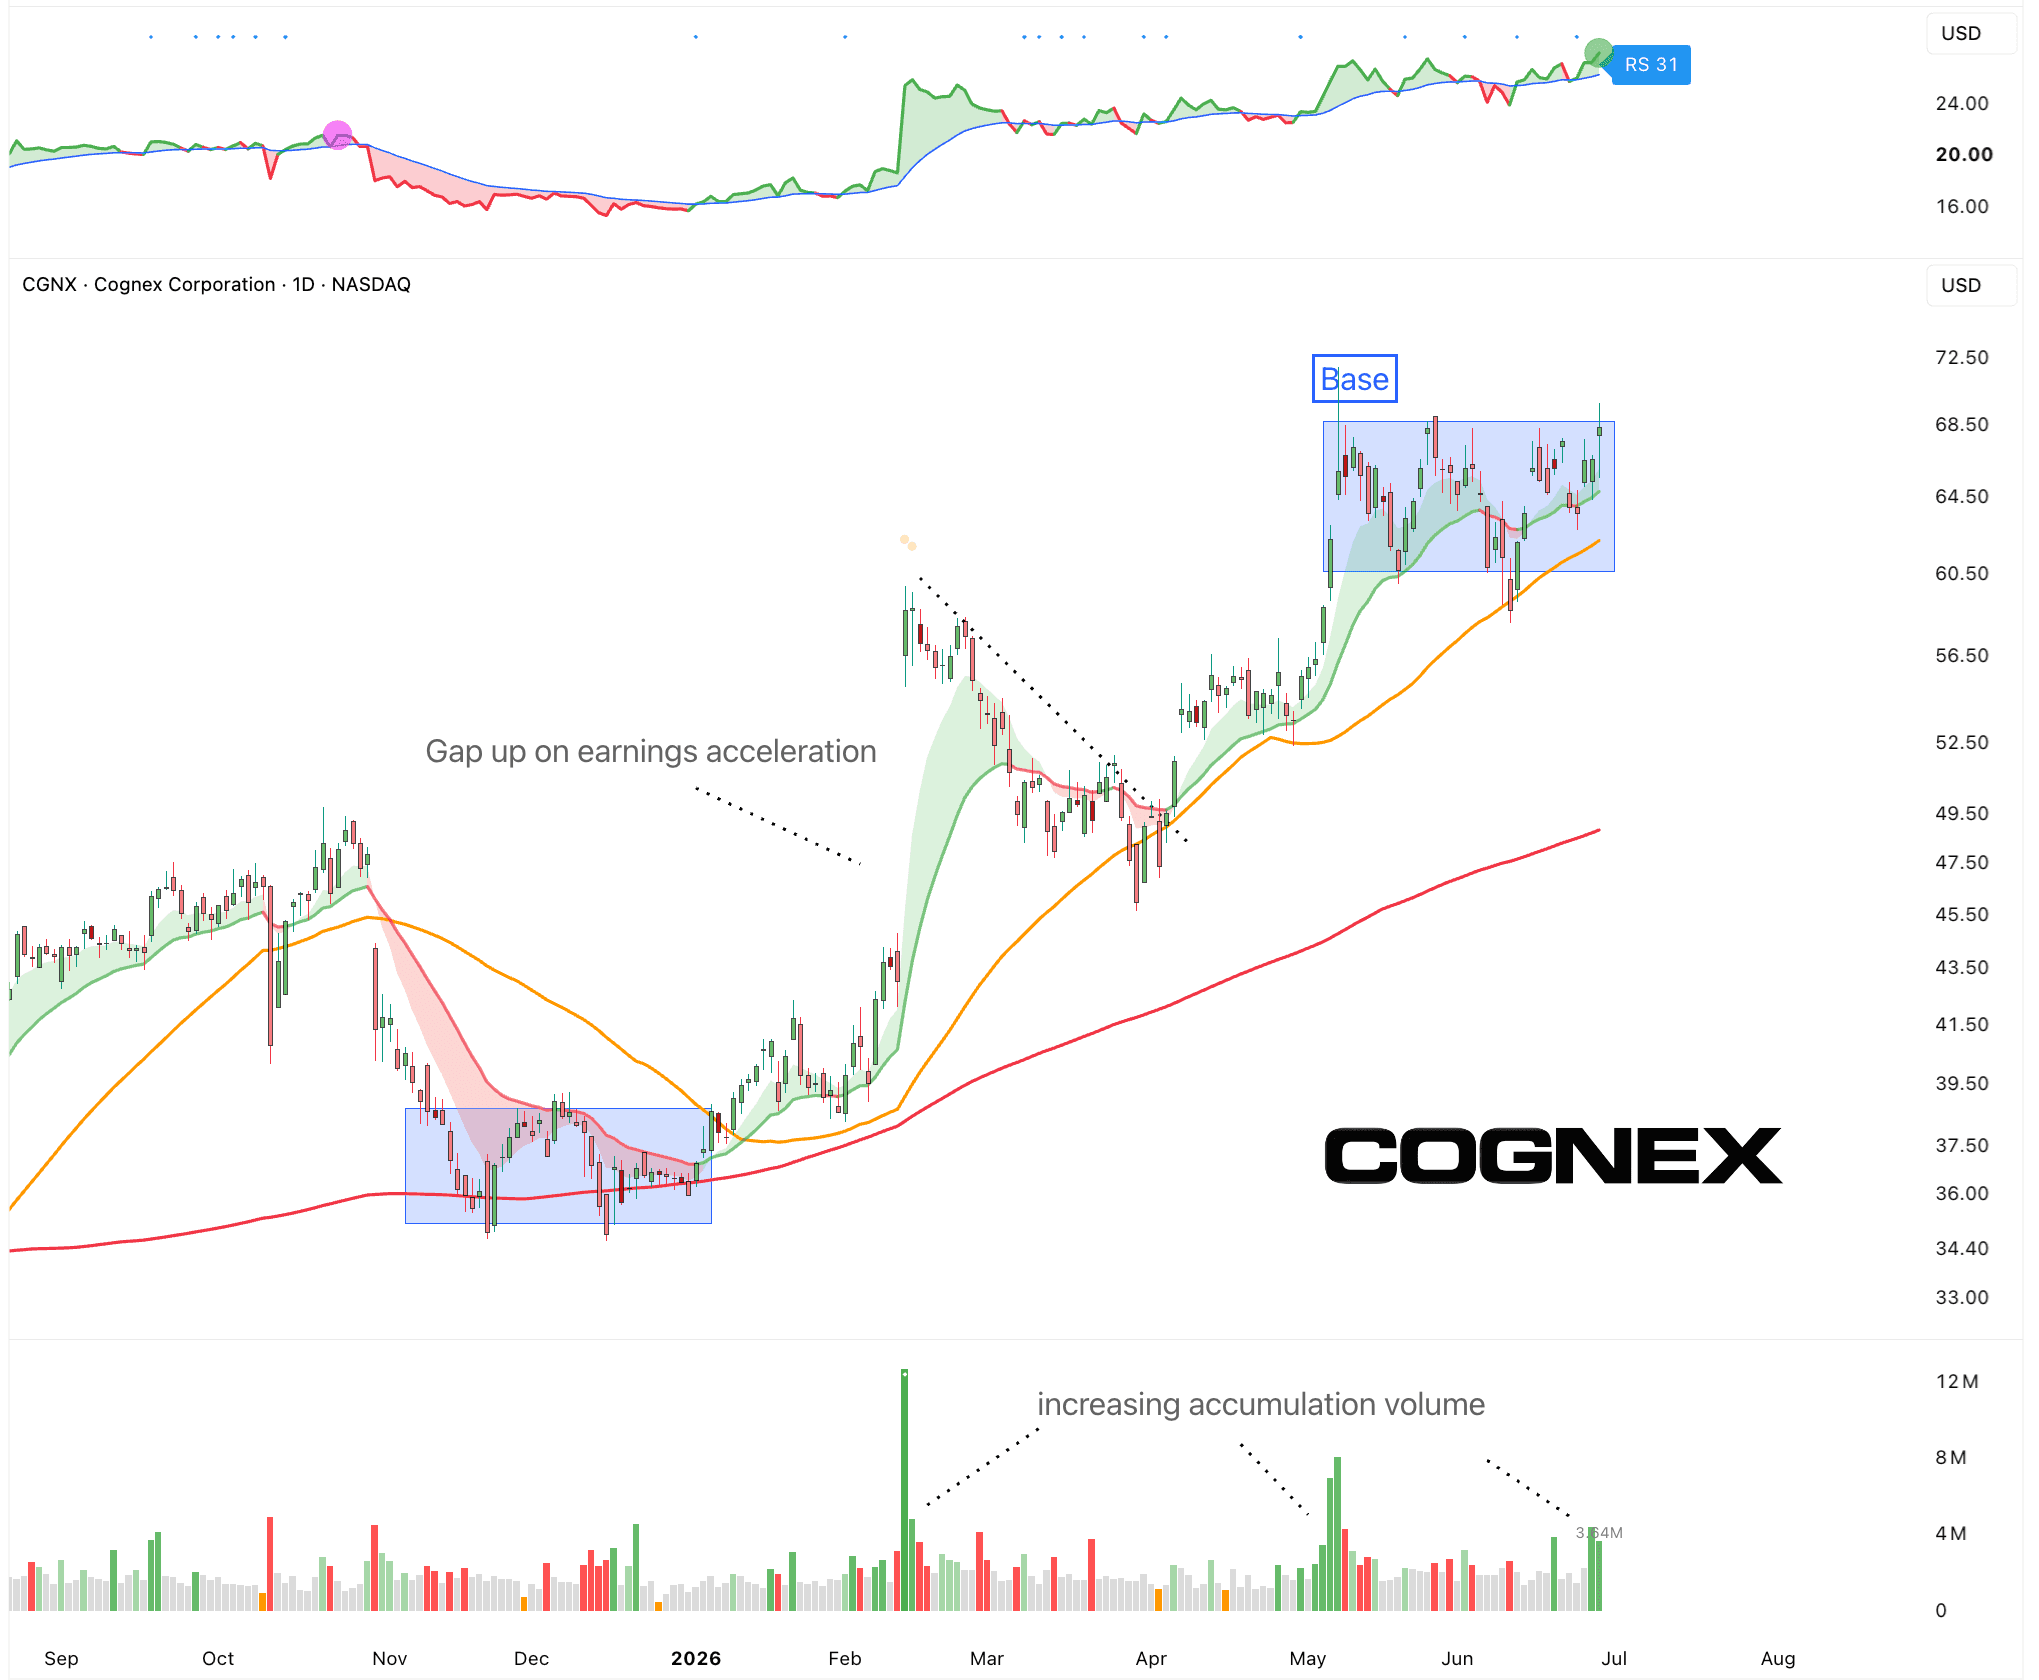
Cognex $CGNX
Cognex builds machine vision systems, sensors, and software that allow factories, warehouses, robots, and production lines to operate in the physical world.
Its products are used across factory automation, logistics, consumer electronics, packaging, automotive, semiconductors, medical lab automation, and other industrial end markets. It already serves more than 30,000 customers in over 30 countries.
Now, AI is the catalyst for robotics and machines. AI is changing what machine vision can do. Traditional vision systems were powerful, but often hard to deploy. They needed controlled lighting, expert setup, and a lot of tuning. AI-powered vision systems can handle more complex, messy, real-world environments. That makes the technology easier to use and opens more use cases.
Cognex wants to become the top provider of AI-powered machine vision. New products like OneVision, DataMan 290, and SLX are designed to make vision systems easier to deploy and more scalable.
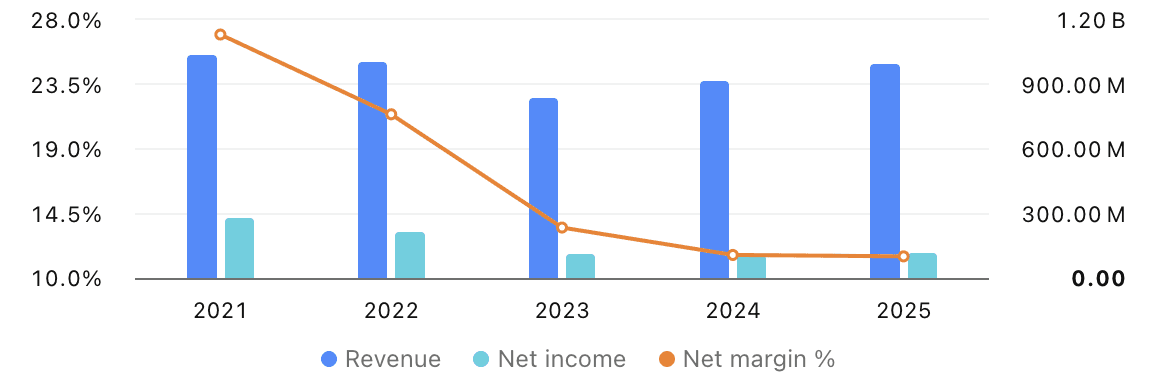
After a few years of declining revenues, 2025 was a turning point. Revenue returned to growth, adjusted EPS grew 38%, and management began cutting low-growth, low-margin revenue from the portfolio. Q1 2026 showed a clear inflection. Revenue grew 24% year over year to $268M, gross margin improved to 71.1%, operating margin reached 22.3%, and adjusted EPS more than doubled to $0.34. The company also guided Q2 2026 revenue to $280M to $300M.
It’s been building consolidating for two months now. And the recent market pullback barely left a dent. There’s also increasing investor interest in robotics with since the humanoid maker Agility Robotics is going public via a SPAC merger $CCXI under the ticker $AGLT from which companies the entire sector should benefit. Companies like AEVA and Ouster, which were highlighted recently, are back in focus.
My believe is that Physical AI and robotics will be one of the biggest beneficiaries of this tech boom.
Company
Cognex
Sector
Robotics
Grade
B+
Setup
Base
Volatility
Moderate
Timeframe
Long-Term
Read More
Lin
CGNX
Bullish
Cognex $CGNX
Cognex builds machine vision systems, sensors, and software that allow factories, warehouses, robots, and production lines to operate in the physical world.
Its products are used across factory automation, logistics, consumer electronics, packaging, automotive, semiconductors, medical lab automation, and other industrial end markets. It already serves more than 30,000 customers in over 30 countries.
Now, AI is the catalyst for robotics and machines. AI is changing what machine vision can do. Traditional vision systems were powerful, but often hard to deploy. They needed controlled lighting, expert setup, and a lot of tuning. AI-powered vision systems can handle more complex, messy, real-world environments. That makes the technology easier to use and opens more use cases.
Cognex wants to become the top provider of AI-powered machine vision. New products like OneVision, DataMan 290, and SLX are designed to make vision systems easier to deploy and more scalable.
After a few years of declining revenues, 2025 was a turning point. Revenue returned to growth, adjusted EPS grew 38%, and management began cutting low-growth, low-margin revenue from the portfolio. Q1 2026 showed a clear inflection. Revenue grew 24% year over year to $268M, gross margin improved to 71.1%, operating margin reached 22.3%, and adjusted EPS more than doubled to $0.34. The company also guided Q2 2026 revenue to $280M to $300M.
It’s been building consolidating for two months now. And the recent market pullback barely left a dent. There’s also increasing investor interest in robotics with since the humanoid maker Agility Robotics is going public via a SPAC merger $CCXI under the ticker $AGLT from which companies the entire sector should benefit. Companies like AEVA and Ouster, which were highlighted recently, are back in focus.
My believe is that Physical AI and robotics will be one of the biggest beneficiaries of this tech boom.
Company
Cognex
Sector
Robotics
Grade
B+
Setup
Base
Volatility
Moderate
Timeframe
Long-Term
Read More
Market Updates
View All
Lin
Weekly Market Update: All Eyes On the Mag 7
The AI trade continues being questioned. We’ve seen that a few times now over the last few years since the launch ChatGPT. Every few months after a strong rally, the market is looking for new reasons why AI won’t last. And surely this won’t be the last time.
Right now, There’s Kimi, heavy leverage in South Korea, doubts around memory pricing, debates over hyperscaler spending, and growing concern that AI investment could slow down soon.
But like the last few times this happened, I believe this will be another buying opportunity. But it’s critical to keep in mind that proper timing is critical.
You can believe in the company, the story, and the long-term potential. But when you buy still matters. When the market or a individual sectors decides to pullback, like it has down over the last few weeks, a lot of these stocks will correct sharply.
A company can have an amazing story and strong fundamentals. But once everyone is already bought in and overexcited, the stock becomes much more fragile for sharp and sudden corrections. That’s why it’s important to avoid chasing after vertical or parabolic move or at least have a clear line of defense to manage risk and cut losses.
It’s clear that the AI trade is far from over. And many of the names that have now gone through longer corrections are starting to look more attractive right now. You don’t need to buy the exact bottom. It’s more important to build your watchlist and wait for the entire sector to turn around and for the general market to stabilize.

We’ve now spent about 3 months moving sideways. At some point, it will break in one direction. A choppy market with no clear trend is one of the hardest markets to trade. In a proper downtrend, the weakness is obvious. You can see it and step aside.
In a sideways market, every small bounce starts to look like the beginning of a breakout. That keeps pulling people back in, only for the move to fail again.
It would be incredible helpful for the markets if the Mag 7. And this looks quite promising right now. The equal weight Mag 7 index has done the same thing since the 2022 low every single time, grind higher, pause, consolidate, and eventually break out again.
Apple just hit a fresh all time high and is neck and neck with Nvidia again for the title of largest company in the world.
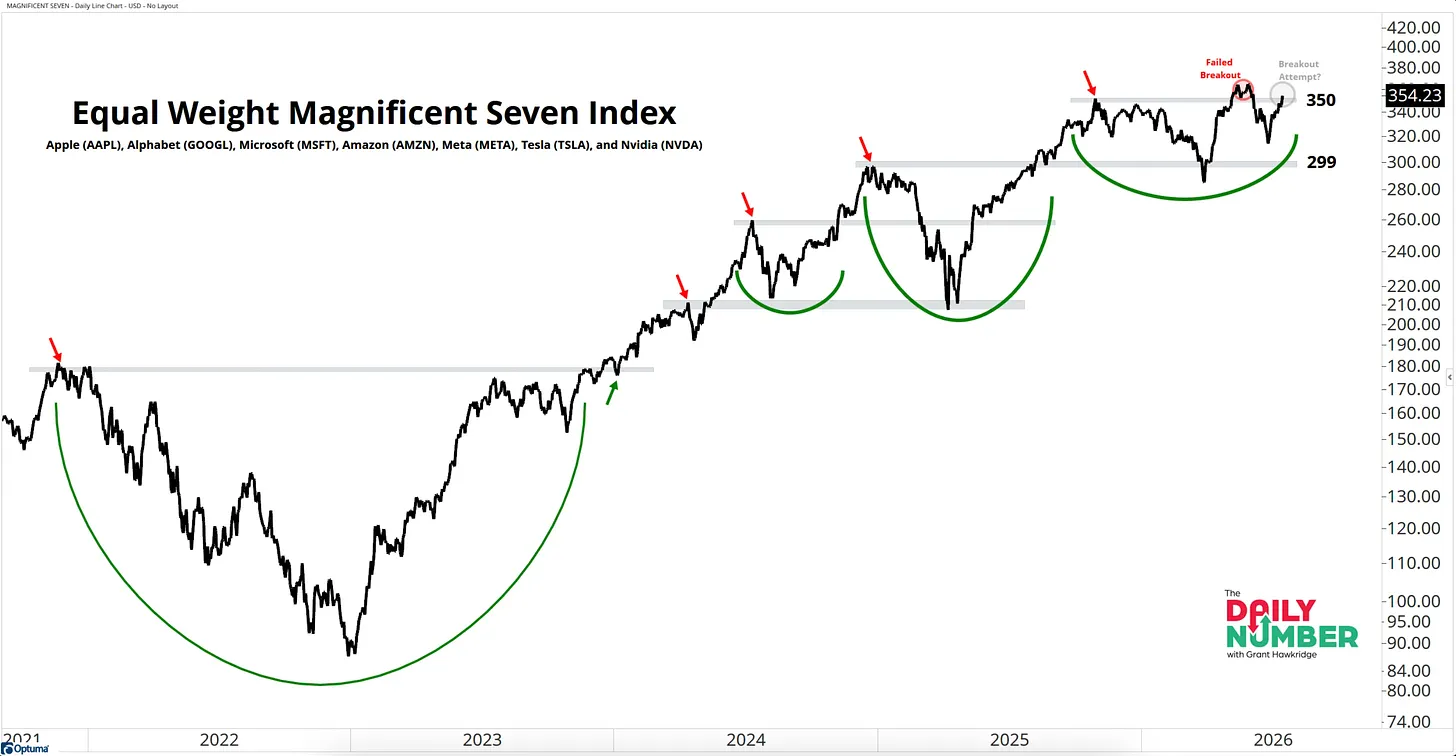
We could see some rotation back into the Mag 7.
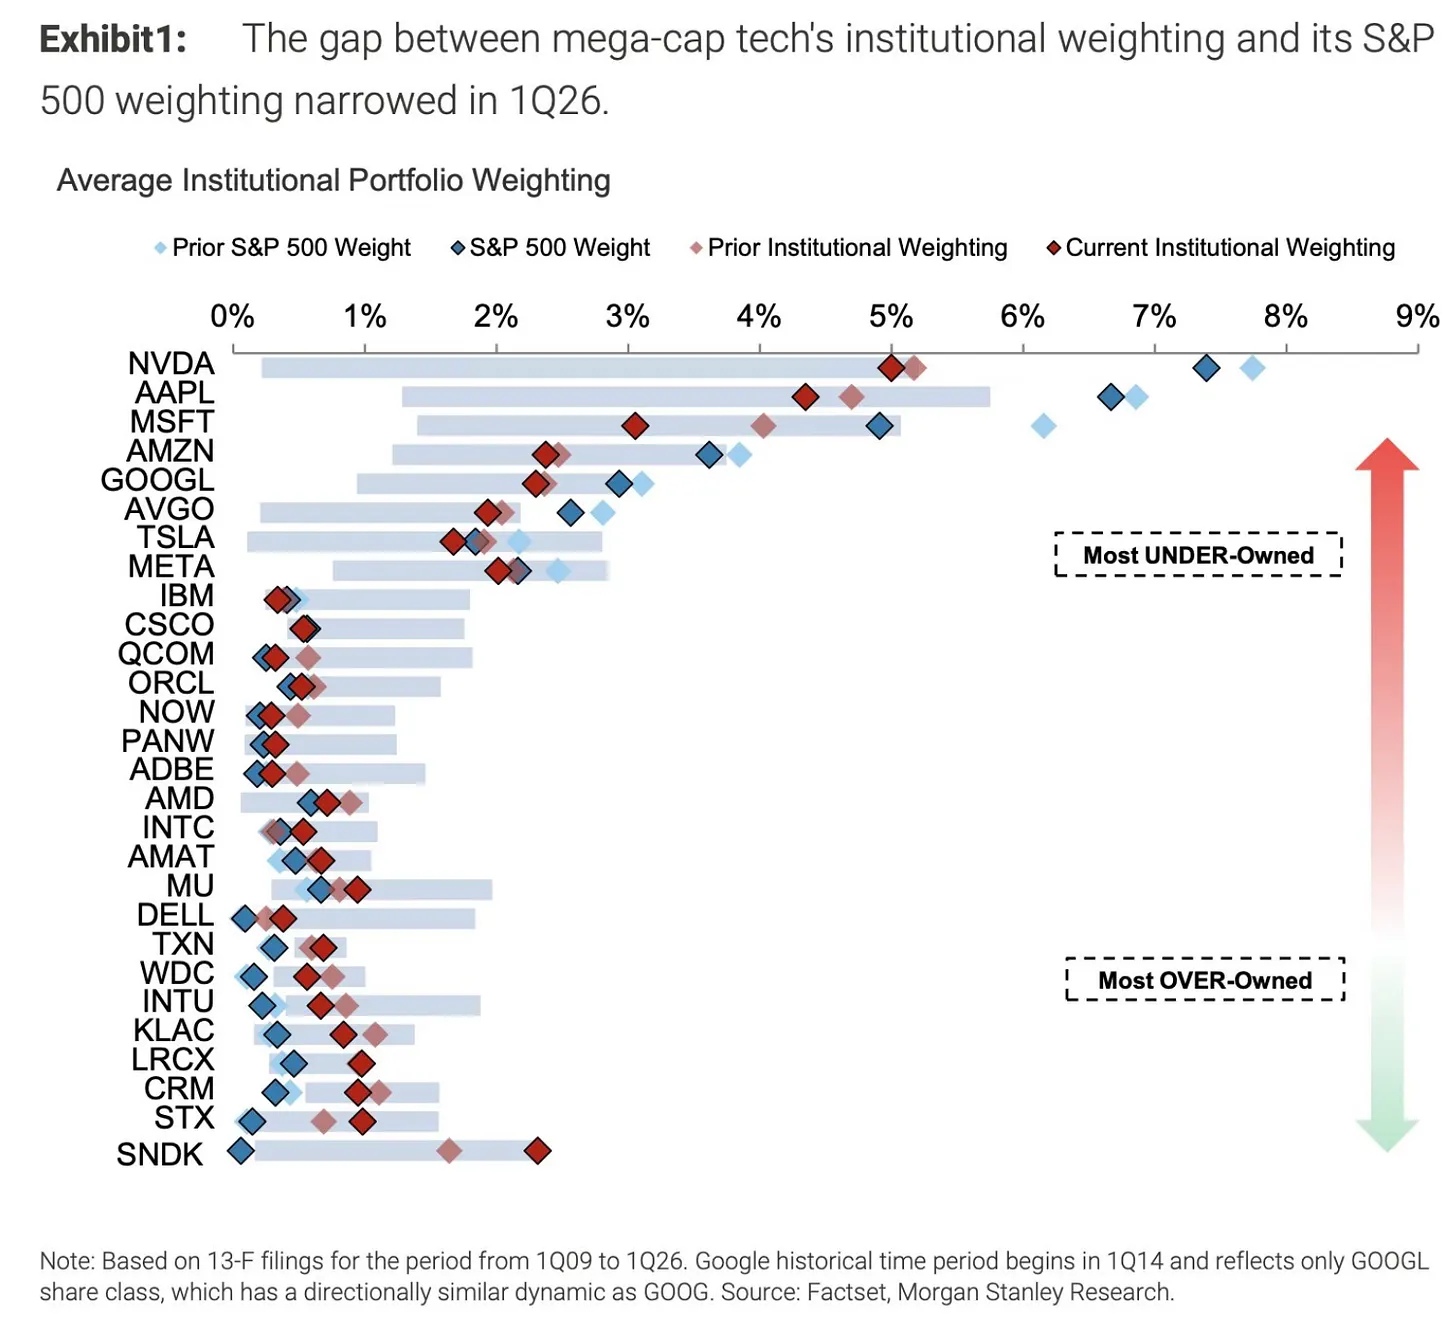
The group is underowned by institutions, cheap relative to its own history, and technically setting up for another leg higher.
Nvidia is currently the most underweighted stock in institutional portfolios relative to its weight in the S&P 500, with Microsoft and Amazon not far behind. That creates potential buying power. So, there is still a lot of fuel sitting on the sidelines.
Most of the Mag 7 are reporting over the next 2 weeks. So, these will be important to track. Wall Street will likely scrutinize every single word and number around AI and CAPEX.
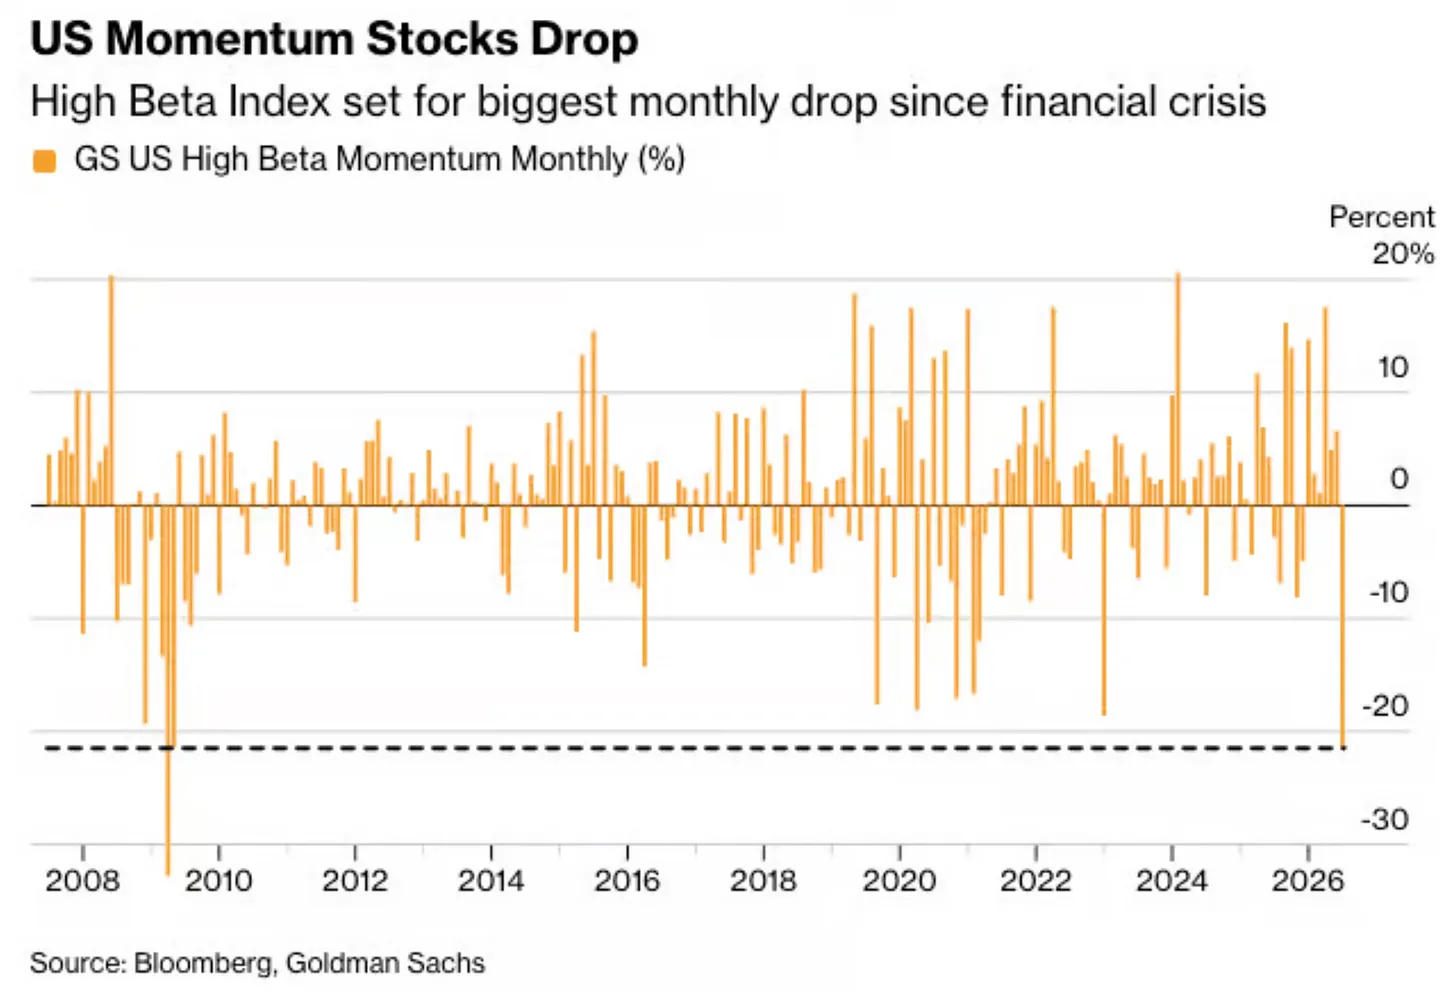
While the general has been moving sideways. Momentum stocks, the high beta, high flying names that led this market higher, have gone through large corrections.
In fact, Goldman’s High Beta Momentum basket is on pace for its worst month in roughly 17 years, down more than 20% and closing in on levels not seen since the financial crisis. That’s not a small pullback, that’s a flush. So, that could be the start of a bottom.
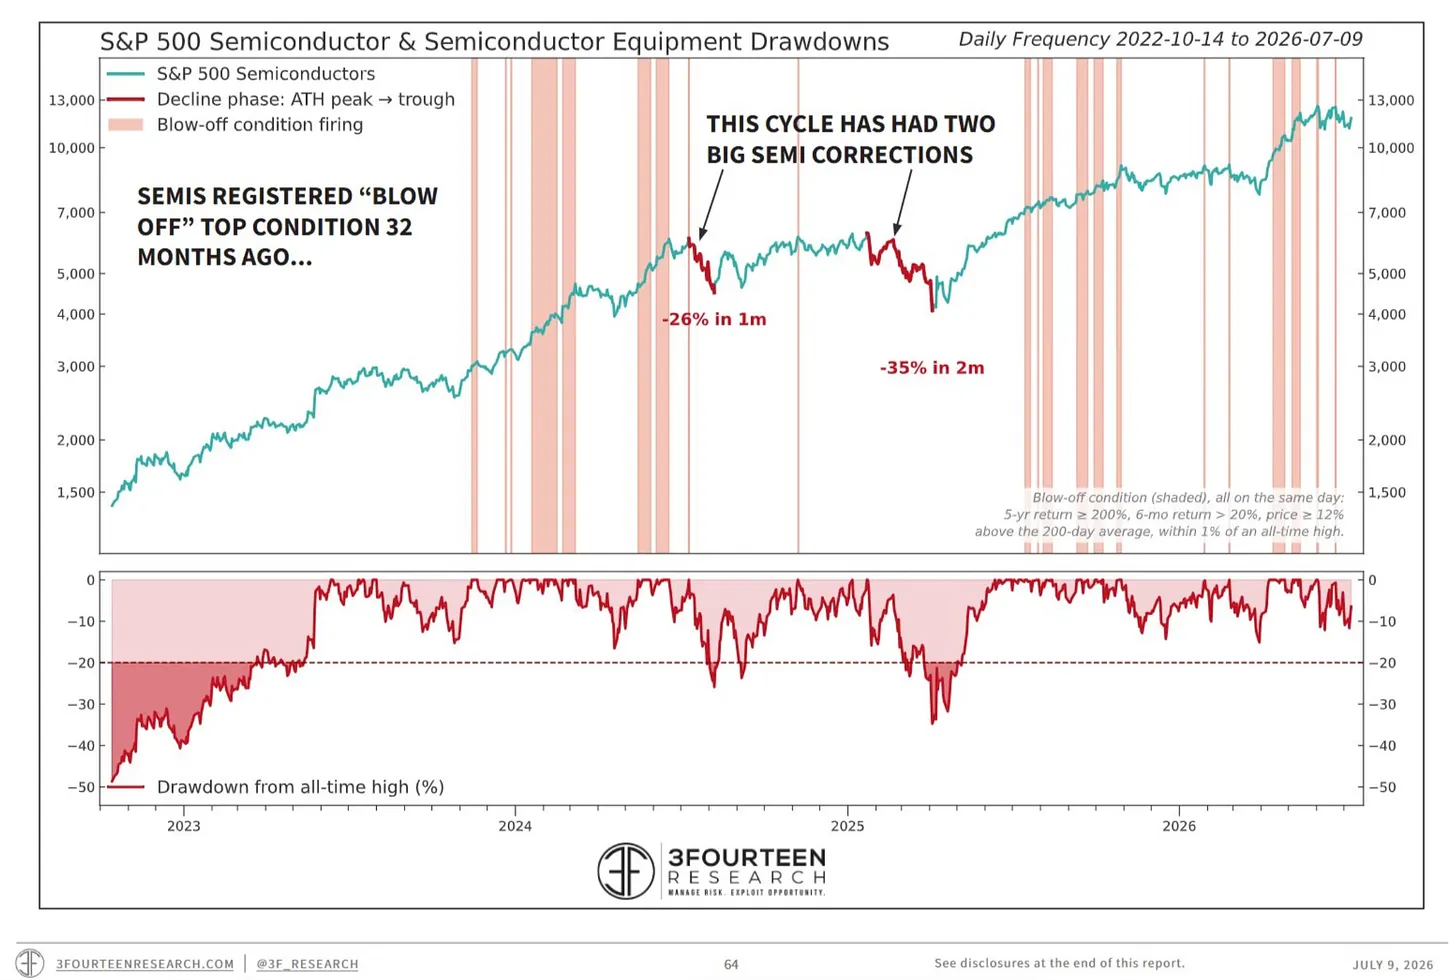
Semis are caught up in this too. In the last 32 months, it’s already worked through two separate 20%+ drawdowns since, a 26% hit in one month, and a 35% hit in two. Compare that to the 90s bull market, which ran 63 months after its own blow-off signal and only saw about one 20% drawdown per year. We’re moving through these corrections faster and more often this cycle. Now this would be the third time.
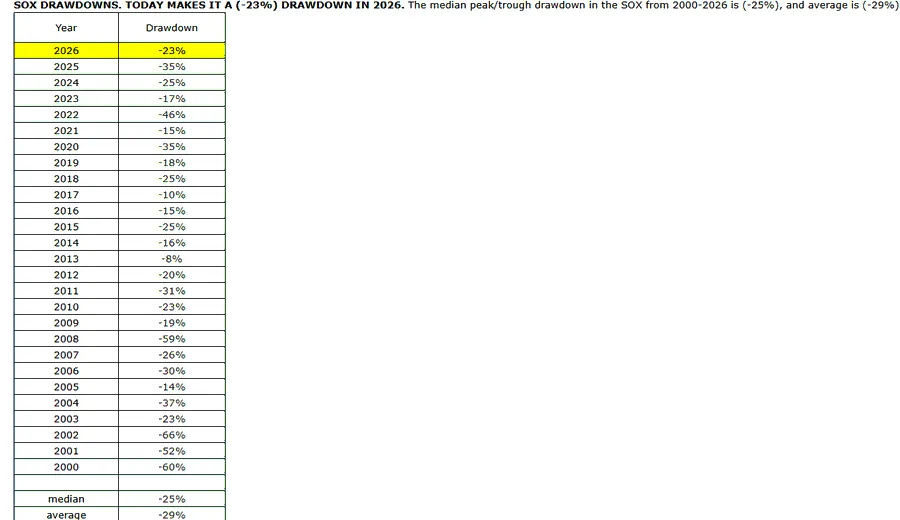
This drawdown in Semis so fsr is pretty par for the course. The average drawdown for the year is 29%, as of Thursday it was down 23% and after Friday it’s nearly 25%.
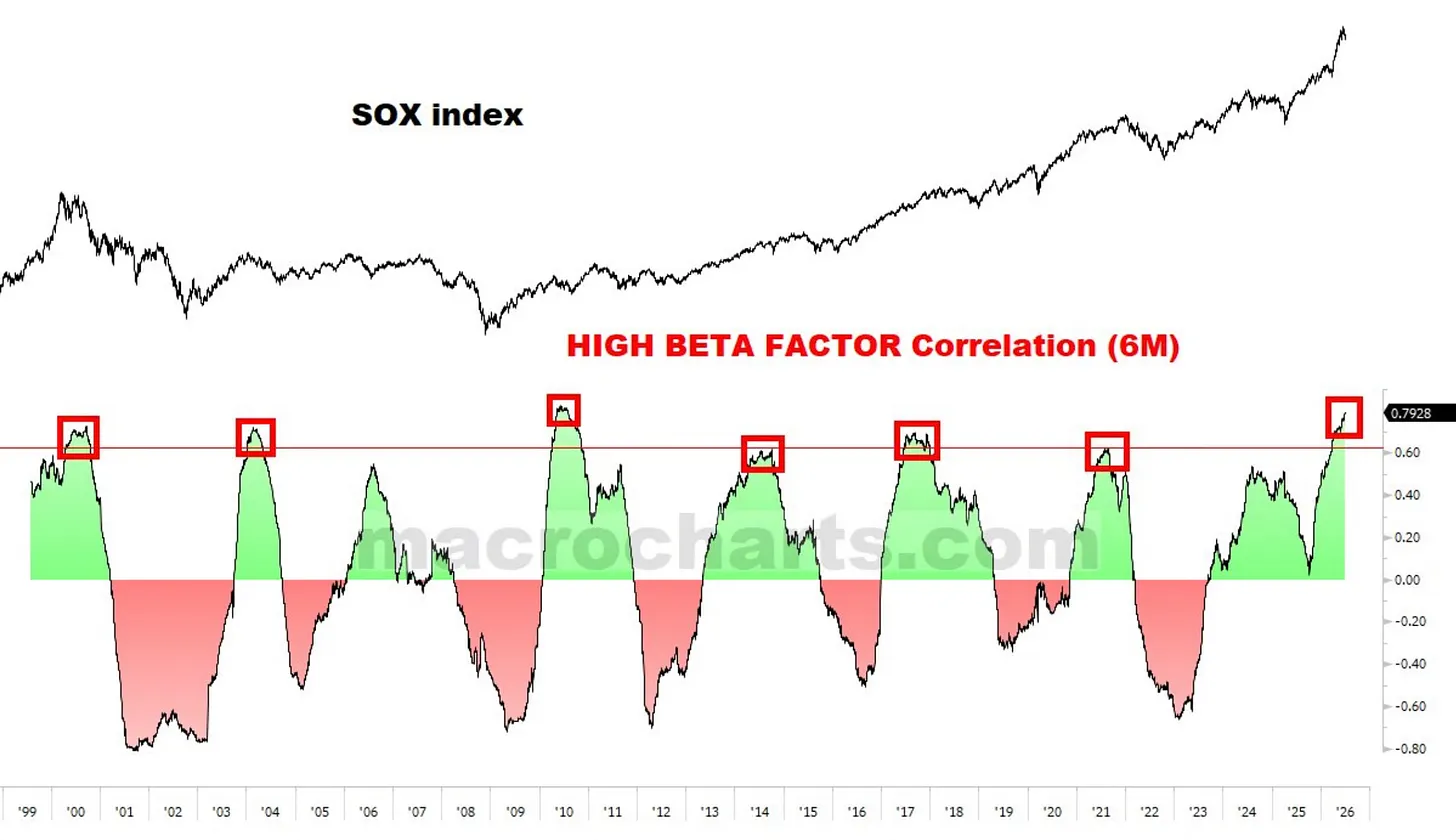
There’s also a correlation signal worth highlighting. The relationship between semis and the high beta factor has been the highest in recent memory. Semis are basically the momentum trade right now.
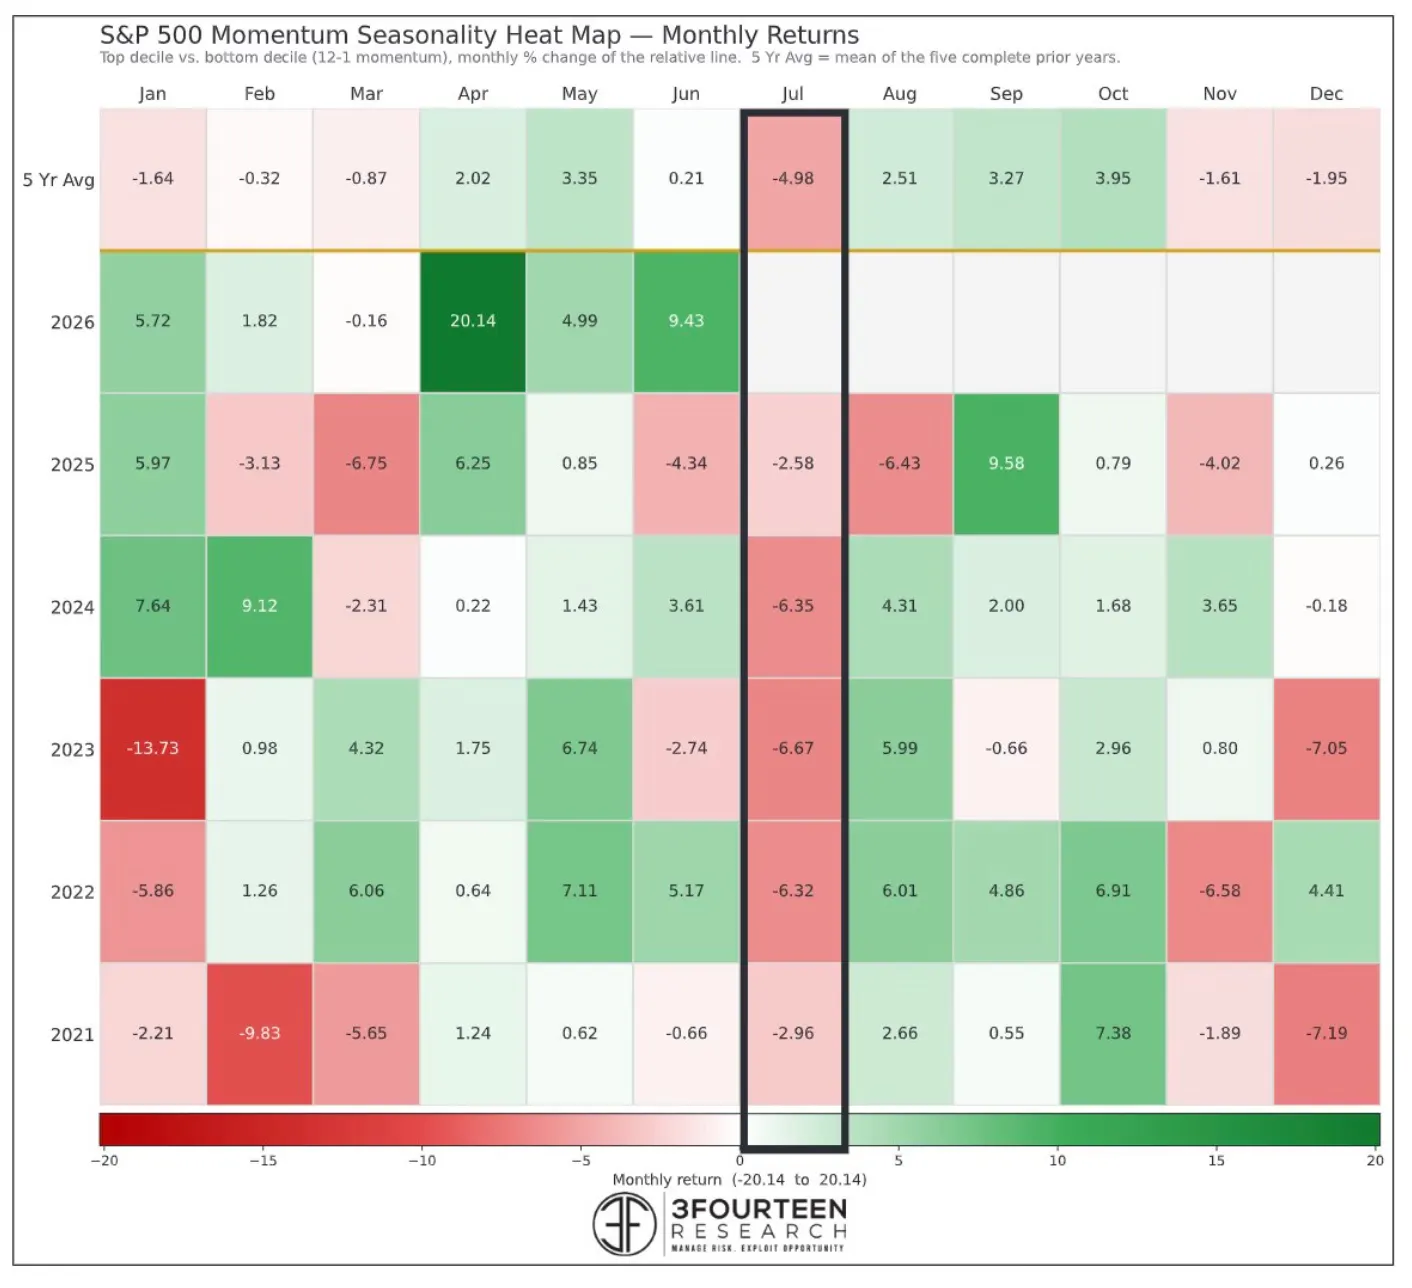
The timing also fits the seasonal pattern. July tends to be a strong month for the broader market, but it has been the single worst month for momentum stocks over the past 5 years. This year’s heat map is already flashing red in that column, suggesting the rotation may have already started.
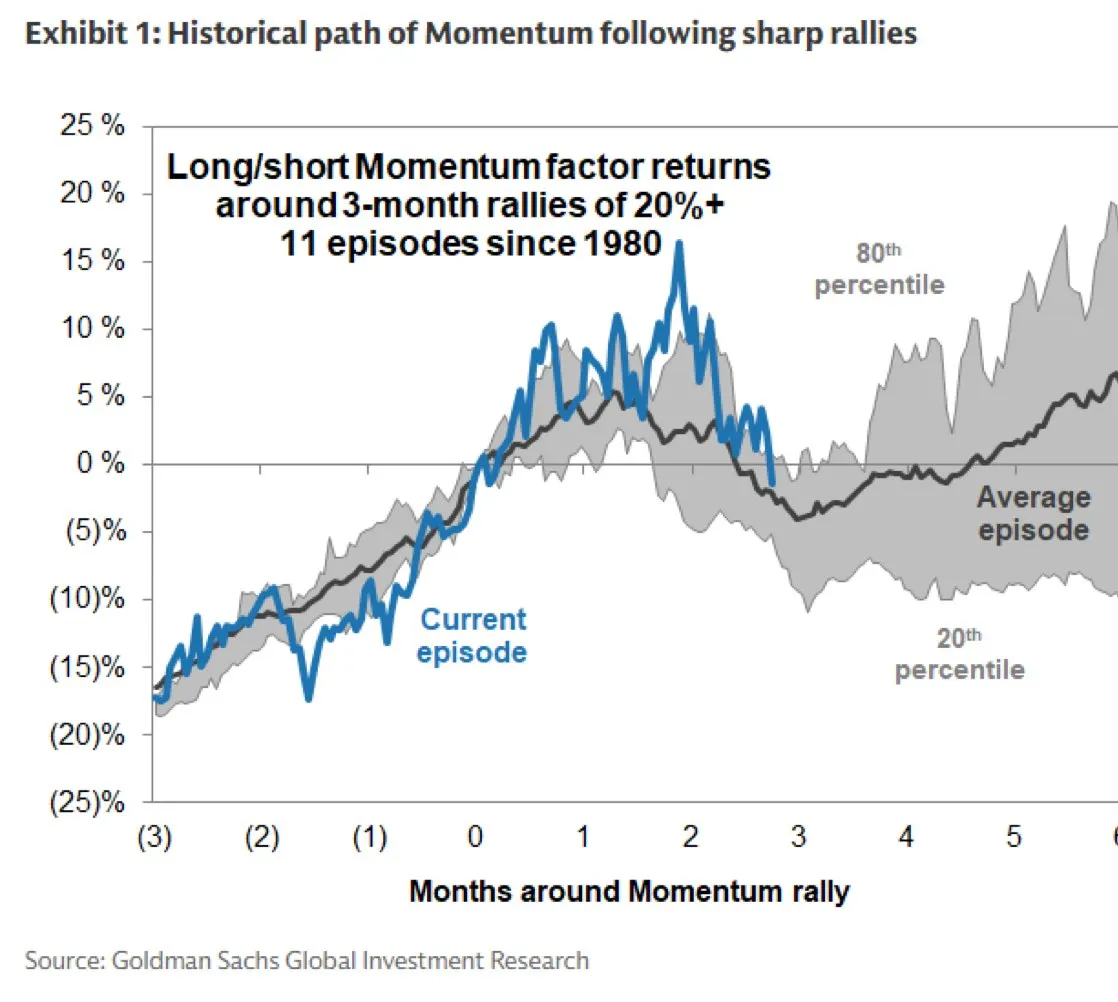
The momentum unwind is actually par for the course. If you look at the “average episode” it’s evident that many of these stocks likely topped out and need to build a base again before they continue higher.
Now inflation has come down as well. Prices rose 3.5% year over year, a sharp drop from 4.2% in May and well below Wall Street’s expectation of 3.8%. That was the largest one month slowdown in inflation since April 2020. Excluding food and energy, core inflation came in at 2.6%, down from 2.9% in May and below the 2.8% consensus estimate.
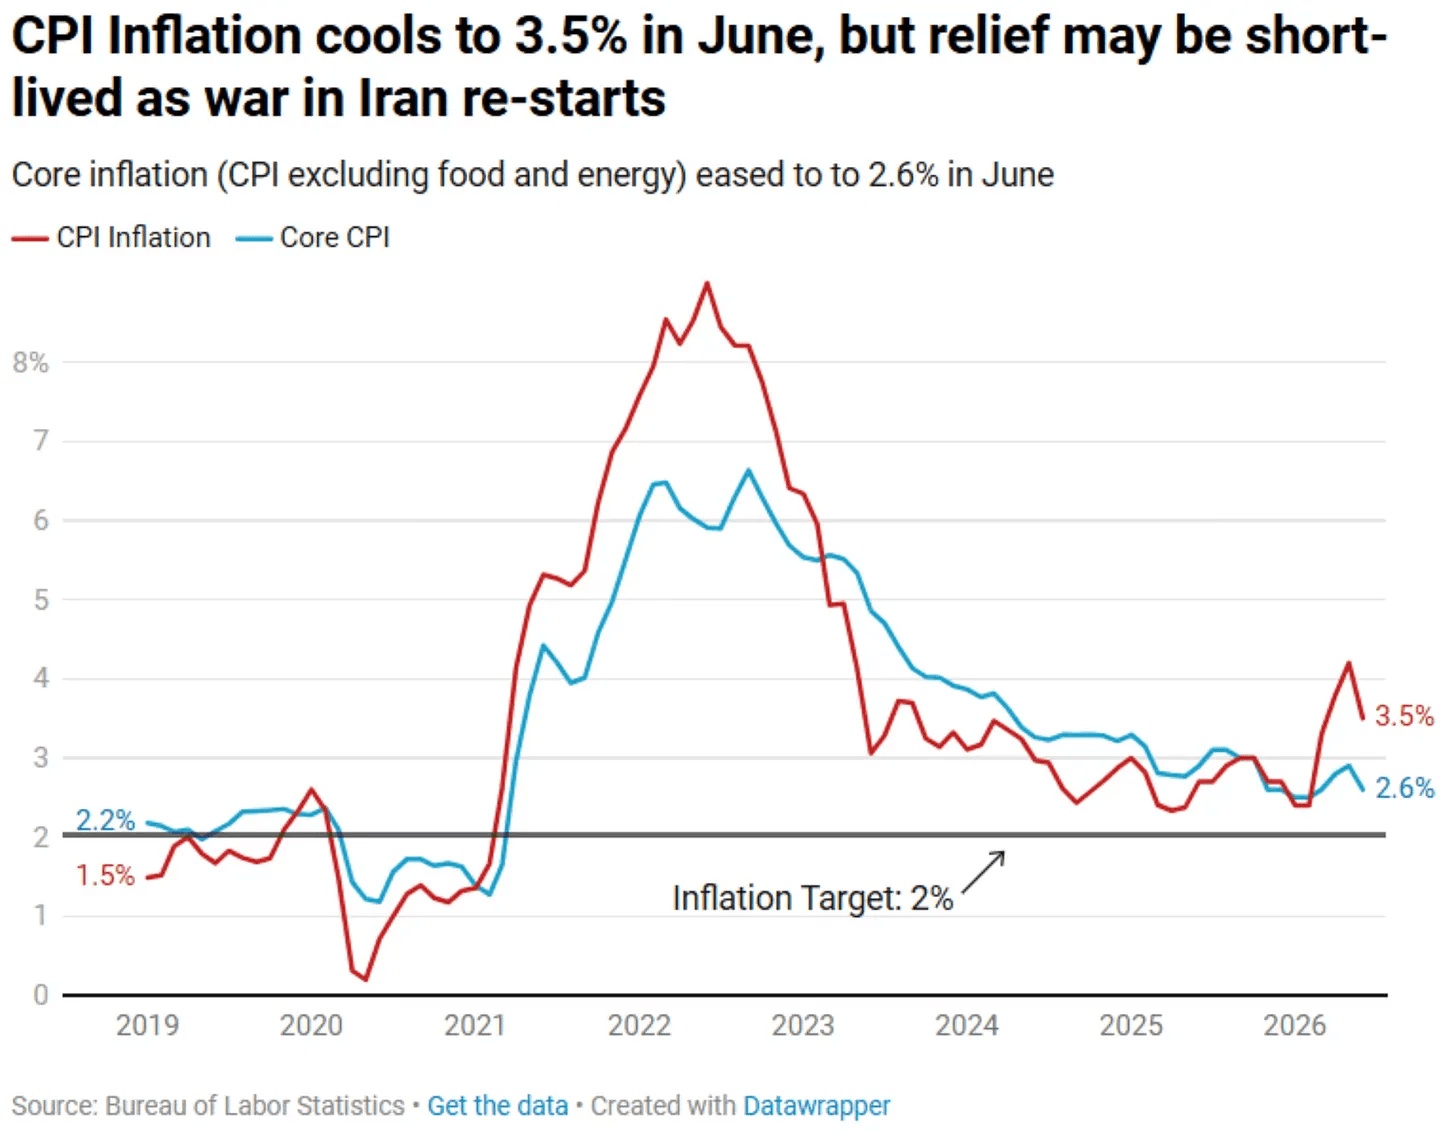
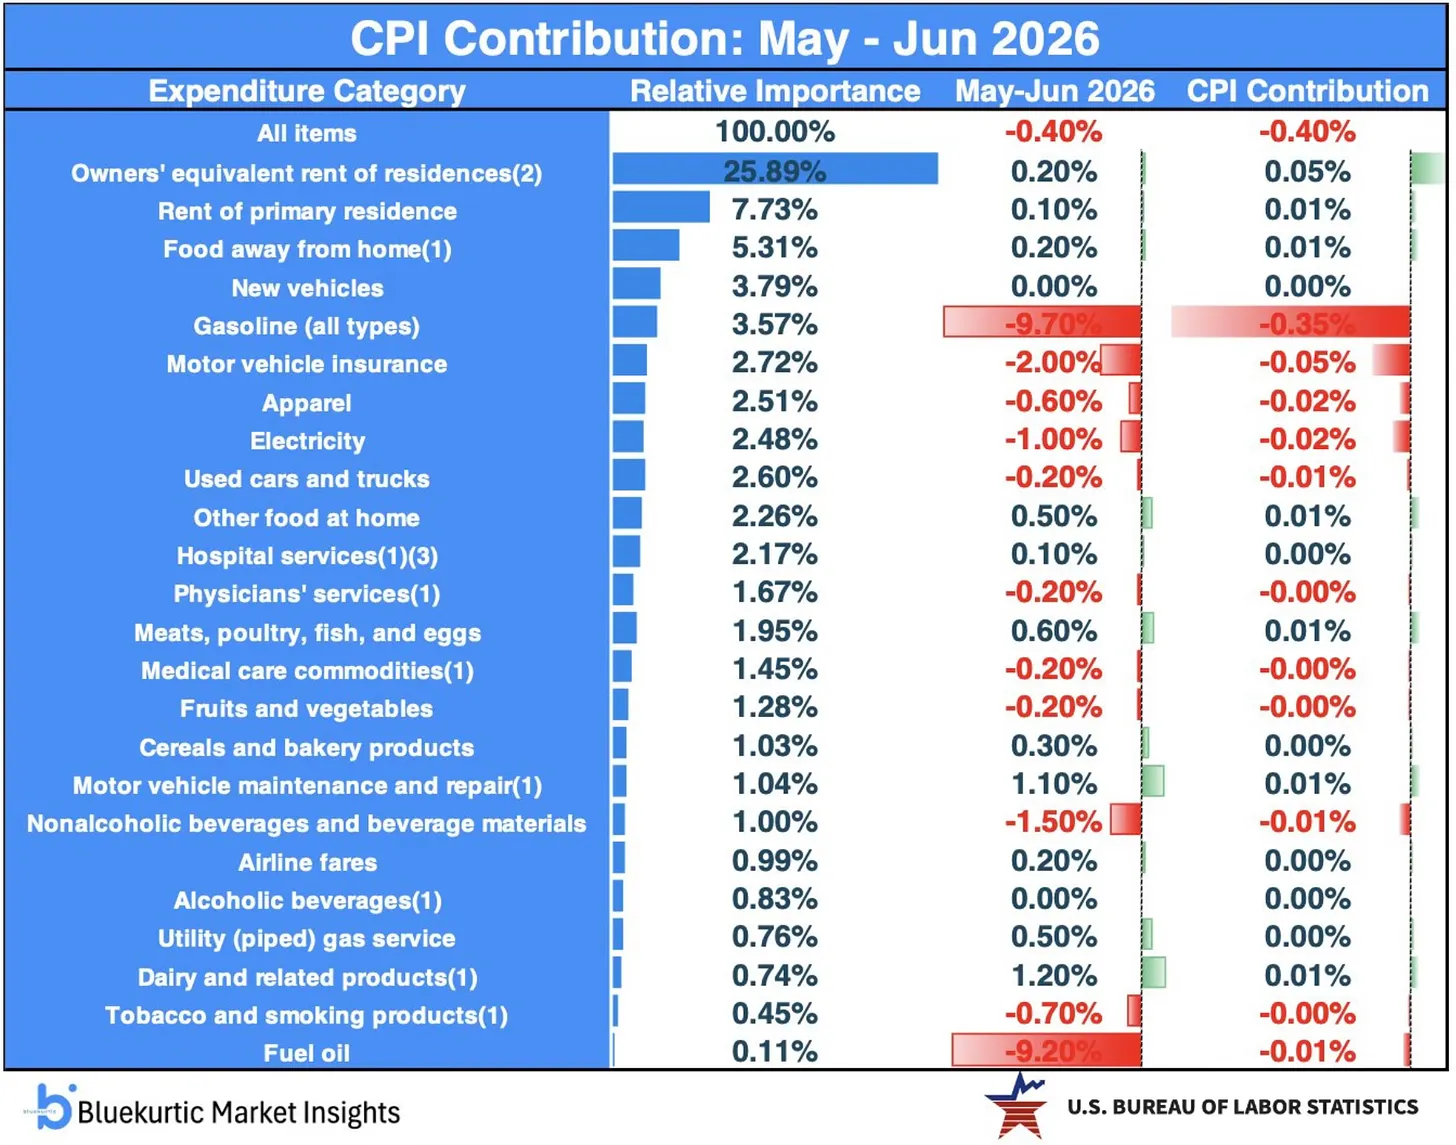
Cheaper gas drove most of the decline. On a monthly basis, headline prices fell 0.4%, marking the sharpest drop since May 2020. Energy alone pulled the reading down by nearly half a percentage point, with gasoline prices falling almost 10% and accounting for most of the weakness. Unfortunately, oil prices have been rising again. So, we'll see if this is only short-lived.
There are tons of important earnings reports this week and over the coming weeks. So, make sure to check out the earnings calendar.
For now, my bias is still cautiously optimistic, but I’m not blindly optimistic.
The market needs to prove itself first.
As long as the major indices hold their key moving averages, I’m willing to treat this as a violent correction in AI and tech, while money rotates into other parts of the market. Now we're in the depth of earnings season. So there will be a ton of data to analyze and track.
The market will eventually give us more clarity.
Until then, I’m keeping new positions small, protecting capital, and letting price action lead.
Read More
Lin
Weekly Market Update: All Eyes On the Mag 7
The AI trade continues being questioned. We’ve seen that a few times now over the last few years since the launch ChatGPT. Every few months after a strong rally, the market is looking for new reasons why AI won’t last. And surely this won’t be the last time.
Right now, There’s Kimi, heavy leverage in South Korea, doubts around memory pricing, debates over hyperscaler spending, and growing concern that AI investment could slow down soon.
But like the last few times this happened, I believe this will be another buying opportunity. But it’s critical to keep in mind that proper timing is critical.
You can believe in the company, the story, and the long-term potential. But when you buy still matters. When the market or a individual sectors decides to pullback, like it has down over the last few weeks, a lot of these stocks will correct sharply.
A company can have an amazing story and strong fundamentals. But once everyone is already bought in and overexcited, the stock becomes much more fragile for sharp and sudden corrections. That’s why it’s important to avoid chasing after vertical or parabolic move or at least have a clear line of defense to manage risk and cut losses.
It’s clear that the AI trade is far from over. And many of the names that have now gone through longer corrections are starting to look more attractive right now. You don’t need to buy the exact bottom. It’s more important to build your watchlist and wait for the entire sector to turn around and for the general market to stabilize.
We’ve now spent about 3 months moving sideways. At some point, it will break in one direction. A choppy market with no clear trend is one of the hardest markets to trade. In a proper downtrend, the weakness is obvious. You can see it and step aside.
In a sideways market, every small bounce starts to look like the beginning of a breakout. That keeps pulling people back in, only for the move to fail again.
It would be incredible helpful for the markets if the Mag 7. And this looks quite promising right now. The equal weight Mag 7 index has done the same thing since the 2022 low every single time, grind higher, pause, consolidate, and eventually break out again.
Apple just hit a fresh all time high and is neck and neck with Nvidia again for the title of largest company in the world.
We could see some rotation back into the Mag 7.
The group is underowned by institutions, cheap relative to its own history, and technically setting up for another leg higher.
Nvidia is currently the most underweighted stock in institutional portfolios relative to its weight in the S&P 500, with Microsoft and Amazon not far behind. That creates potential buying power. So, there is still a lot of fuel sitting on the sidelines.
Most of the Mag 7 are reporting over the next 2 weeks. So, these will be important to track. Wall Street will likely scrutinize every single word and number around AI and CAPEX.
While the general has been moving sideways. Momentum stocks, the high beta, high flying names that led this market higher, have gone through large corrections.
In fact, Goldman’s High Beta Momentum basket is on pace for its worst month in roughly 17 years, down more than 20% and closing in on levels not seen since the financial crisis. That’s not a small pullback, that’s a flush. So, that could be the start of a bottom.
Semis are caught up in this too. In the last 32 months, it’s already worked through two separate 20%+ drawdowns since, a 26% hit in one month, and a 35% hit in two. Compare that to the 90s bull market, which ran 63 months after its own blow-off signal and only saw about one 20% drawdown per year. We’re moving through these corrections faster and more often this cycle. Now this would be the third time.
This drawdown in Semis so fsr is pretty par for the course. The average drawdown for the year is 29%, as of Thursday it was down 23% and after Friday it’s nearly 25%.
There’s also a correlation signal worth highlighting. The relationship between semis and the high beta factor has been the highest in recent memory. Semis are basically the momentum trade right now.
The timing also fits the seasonal pattern. July tends to be a strong month for the broader market, but it has been the single worst month for momentum stocks over the past 5 years. This year’s heat map is already flashing red in that column, suggesting the rotation may have already started.
The momentum unwind is actually par for the course. If you look at the “average episode” it’s evident that many of these stocks likely topped out and need to build a base again before they continue higher.
Now inflation has come down as well. Prices rose 3.5% year over year, a sharp drop from 4.2% in May and well below Wall Street’s expectation of 3.8%. That was the largest one month slowdown in inflation since April 2020. Excluding food and energy, core inflation came in at 2.6%, down from 2.9% in May and below the 2.8% consensus estimate.
Cheaper gas drove most of the decline. On a monthly basis, headline prices fell 0.4%, marking the sharpest drop since May 2020. Energy alone pulled the reading down by nearly half a percentage point, with gasoline prices falling almost 10% and accounting for most of the weakness. Unfortunately, oil prices have been rising again. So, we'll see if this is only short-lived.
There are tons of important earnings reports this week and over the coming weeks. So, make sure to check out the earnings calendar.
For now, my bias is still cautiously optimistic, but I’m not blindly optimistic.
The market needs to prove itself first.
As long as the major indices hold their key moving averages, I’m willing to treat this as a violent correction in AI and tech, while money rotates into other parts of the market. Now we're in the depth of earnings season. So there will be a ton of data to analyze and track.
The market will eventually give us more clarity.
Until then, I’m keeping new positions small, protecting capital, and letting price action lead.
Read More
Lin
Market Update: DeepSeek 2.0
Last January, the market sold off hard after a Chinese lab launched its frontier model, DeepSeek. Following its launch, it erased trillions of dollars in market cap. Right now, the same thing is happening again.
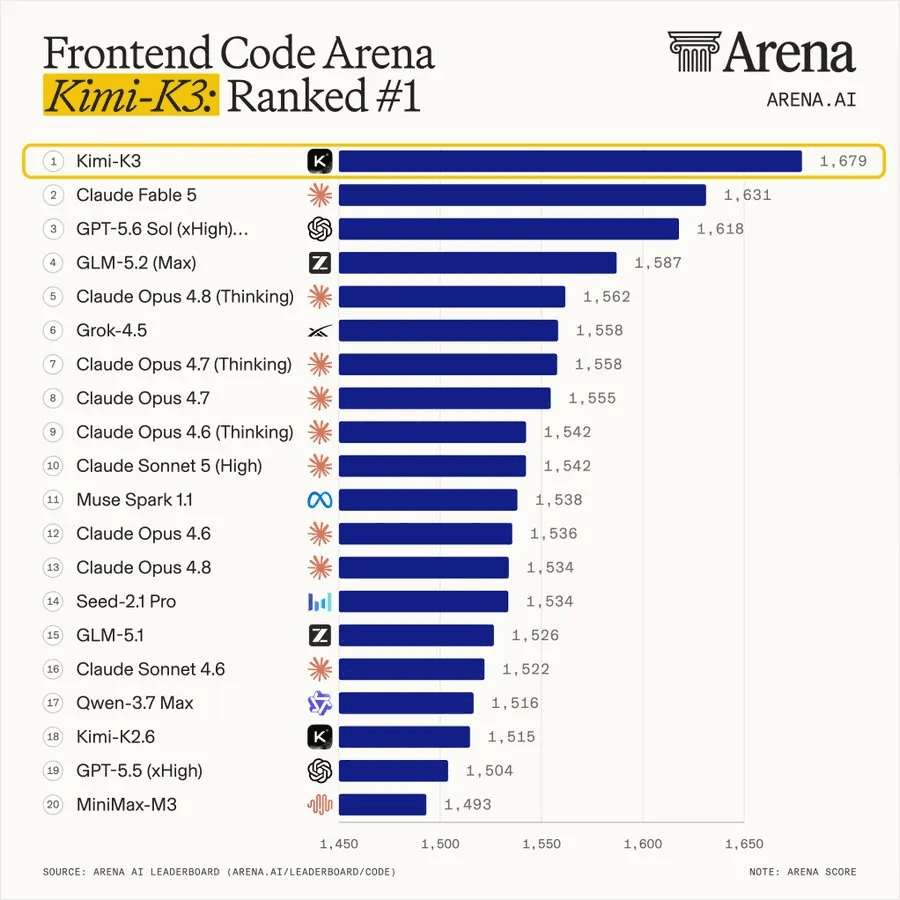
China’s Moonshot AI just released Kimi K3. Moonshot is valued at roughly $31.5B while leading U.S. AI labs are being discussed at valuations approaching or exceeding $1T.
The simple but flawed argument goes as follows:
Right now, the most expensive part of developing AI is training. OpenAI and others spend hundreds of millions on compute to create better AI models. This requires massive data centers with thousands of GPUs and entire power plants.
But DeepSeek and now Kimi are shaking up the entire industry.
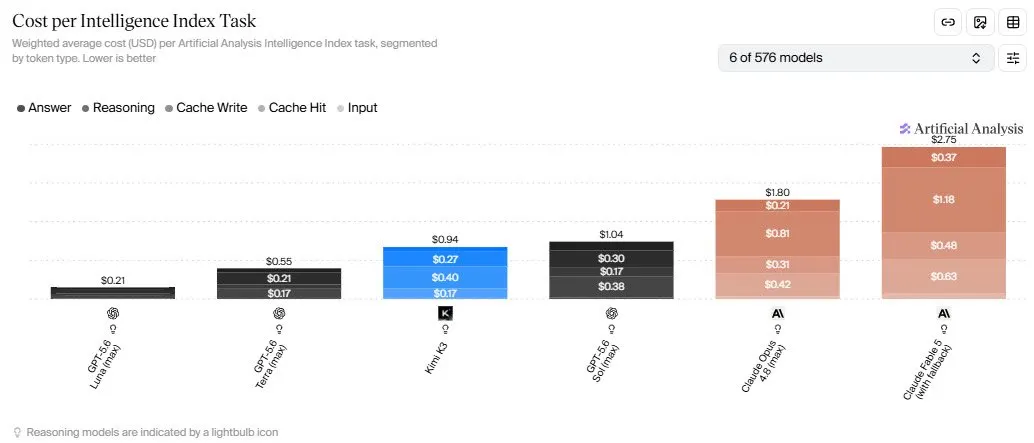
They developed state-of-the-art models that are not only better but also cheaper than almost any other model right now. Their models beat the latest models from leading AI companies such as OpenAI and Anthropic. And they cost up to 70% less to run than their competitors.
The cost per token has been falling fast.
Since ChatGPT launched in 2022, we’ve seen roughly a 1,000x decrease in the price per token. This is how technology works. Everyone expected this to happen. DeepSeek and Kimi simply accelerated the trend even further.
But isn’t that a good thing? I would say yes.
Whenever you lower the cost of a good, new applications emerge that were previously not economically feasible. This is known as Jevons Paradox.
Think of mobile phones. They used to cost tens of thousands of dollars. Now you can get a smartphone for a few hundred dollars.
In the long run, this will probably increase the total demand for AI computation. But Wall Street doesn’t like it when industries are shaken up and the current status quo is questioned.
So what’s the fuss about? Why is everyone panicking?
The reason for the panic is simple. DeepSeek and Kimi showed that you don’t need to be a huge tech company to compete in AI.
You don’t need billion-dollar data centers. You don’t need a team of thousands of highly paid AI engineers. Around 75% of Nvidia employees are reportedly millionaires due to their salaries and stock-based compensation.
The result is that investors and shareholders are once again questioning and scrutinizing the current level of immense CAPEX spending. Billions upon billions have been invested in infrastructure and personnel. Many more billions are planned. But DeepSeek and Kimi showed that a lot is possible with far less.
That’s why Wall Street is panicking.
Nobody knows what will happen next. The selloff could easily continue if the market becomes more emotional, which leads to overreactions.
However, in the long run, there is no way around AI.
The best way to think about AI is as a foundational layer that others will build on top of. Think railways, mobile phones, or electricity. It was always clear that AI models themselves would eventually become commoditized.
So what should investors look out for?
There is no real moat around the AI models themselves. As we’ve seen, almost anyone can create their own models for less, often using existing models and technology as a reference. It is now becoming a race to the bottom for research labs.
Of course, the 2 giants, OpenAI and Anthropic, won’t stand still. They will try to capture as much market share as possible by integrating deeper into the broader ecosystem.
But what now? I think there are 2 key points.
First, we will still need AI infrastructure. Maybe the short-term hype has been dampened somewhat. But after the internet bubble, nobody argued that we should stop building internet infrastructure.
Second, most of the value will be created at the application layer. What does that mean? Basically, the internet created an entirely new pathway for value creation in software.
The next major companies will create completely new categories of applications. I think many of them will be built around AI agents.
Imagine an army of agents doing work for you, connected to your own data, which you can orchestrate for pennies, 24/7. They will replace some white-collar jobs while augmenting many others.
In short, while the short-term hype has been dampened, DeepSeek and Kimi are a net positive. They have shown everyone that incredible AI models can be built even with limited resources.
Fewer resources spent on training and inference means more resources can be directed toward new use cases. And the biggest beneficiaries will be the companies creating entirely new applications.
The path toward artificial general intelligence just accelerated.
And the last time this happened and the market overreacted, turned out to be a very good buying opportunity. But it’s important to be patient, build your watchlist, and wait for the sell-off to calm down.
Read More
Lin
Market Update: DeepSeek 2.0
Last January, the market sold off hard after a Chinese lab launched its frontier model, DeepSeek. Following its launch, it erased trillions of dollars in market cap. Right now, the same thing is happening again.
China’s Moonshot AI just released Kimi K3. Moonshot is valued at roughly $31.5B while leading U.S. AI labs are being discussed at valuations approaching or exceeding $1T.
The simple but flawed argument goes as follows:
Right now, the most expensive part of developing AI is training. OpenAI and others spend hundreds of millions on compute to create better AI models. This requires massive data centers with thousands of GPUs and entire power plants.
But DeepSeek and now Kimi are shaking up the entire industry.
They developed state-of-the-art models that are not only better but also cheaper than almost any other model right now. Their models beat the latest models from leading AI companies such as OpenAI and Anthropic. And they cost up to 70% less to run than their competitors.
The cost per token has been falling fast.
Since ChatGPT launched in 2022, we’ve seen roughly a 1,000x decrease in the price per token. This is how technology works. Everyone expected this to happen. DeepSeek and Kimi simply accelerated the trend even further.
But isn’t that a good thing? I would say yes.
Whenever you lower the cost of a good, new applications emerge that were previously not economically feasible. This is known as Jevons Paradox.
Think of mobile phones. They used to cost tens of thousands of dollars. Now you can get a smartphone for a few hundred dollars.
In the long run, this will probably increase the total demand for AI computation. But Wall Street doesn’t like it when industries are shaken up and the current status quo is questioned.
So what’s the fuss about? Why is everyone panicking?
The reason for the panic is simple. DeepSeek and Kimi showed that you don’t need to be a huge tech company to compete in AI.
You don’t need billion-dollar data centers. You don’t need a team of thousands of highly paid AI engineers. Around 75% of Nvidia employees are reportedly millionaires due to their salaries and stock-based compensation.
The result is that investors and shareholders are once again questioning and scrutinizing the current level of immense CAPEX spending. Billions upon billions have been invested in infrastructure and personnel. Many more billions are planned. But DeepSeek and Kimi showed that a lot is possible with far less.
That’s why Wall Street is panicking.
Nobody knows what will happen next. The selloff could easily continue if the market becomes more emotional, which leads to overreactions.
However, in the long run, there is no way around AI.
The best way to think about AI is as a foundational layer that others will build on top of. Think railways, mobile phones, or electricity. It was always clear that AI models themselves would eventually become commoditized.
So what should investors look out for?
There is no real moat around the AI models themselves. As we’ve seen, almost anyone can create their own models for less, often using existing models and technology as a reference. It is now becoming a race to the bottom for research labs.
Of course, the 2 giants, OpenAI and Anthropic, won’t stand still. They will try to capture as much market share as possible by integrating deeper into the broader ecosystem.
But what now? I think there are 2 key points.
First, we will still need AI infrastructure. Maybe the short-term hype has been dampened somewhat. But after the internet bubble, nobody argued that we should stop building internet infrastructure.
Second, most of the value will be created at the application layer. What does that mean? Basically, the internet created an entirely new pathway for value creation in software.
The next major companies will create completely new categories of applications. I think many of them will be built around AI agents.
Imagine an army of agents doing work for you, connected to your own data, which you can orchestrate for pennies, 24/7. They will replace some white-collar jobs while augmenting many others.
In short, while the short-term hype has been dampened, DeepSeek and Kimi are a net positive. They have shown everyone that incredible AI models can be built even with limited resources.
Fewer resources spent on training and inference means more resources can be directed toward new use cases. And the biggest beneficiaries will be the companies creating entirely new applications.
The path toward artificial general intelligence just accelerated.
And the last time this happened and the market overreacted, turned out to be a very good buying opportunity. But it’s important to be patient, build your watchlist, and wait for the sell-off to calm down.
Read More
Exposure Level
Guidance:
Neutral
0%
100%
Trend Indicator
Long-Term:
Up
Intermediate-Term:
Sideways
Short-Term:
Sideways
Risk Indicators
Volatility:
High
Sentiment:
Neutral
Momentum:
Neutral
Leading Sectors
View All
Energy
Biotech
Fintech
Cybersecurity
The Fullstack Investor Handbook
BASICS
5 Steps to Improve Your Investing Strategy
The Fullstack Investor Handbook
BASICS
5 Steps to Improve Your Investing Strategy