
Lin
Market Update: The Secret AI Model
AI is one of the biggest opportunities of this decade, and likely the defining one. It is reshaping every industry, changing how work gets done, how decisions are made, and how value is created. This is the leading sector in the market right now, and that is not by coincidence. The demand for compute keeps rising and there is no sign of it slowing.
AI systems require enormous computational power. Training models, running real-time inference, operating AI agents, generating images and video, controlling robots, and enabling autonomous vehicles all depend on massive data center capacity, advanced chips, high-bandwidth networking, and reliable energy infrastructure. The more capable these systems become, the more compute they consume. Most people still underestimate this.
And this is still early. AI is not just a tool. It is a new form of intelligence that can plan, reason, and solve complex problems. As these systems move from research environments into everyday products, enterprise workflows, and real physical applications, compute requirements will expand dramatically from here.
There is practically no limit to how much intelligence we can use.
And now Anthropic just did something you almost never see in tech. They built a new secret AI model called Claude Mythos, and it’s so good at cybersecurity that they think it could actually be dangerous to release. Claude Mythos blew past existing benchmarks and showed a huge jump in autonomous hacking ability.
So, instead of launching it like a normal product, they’re holding it back and sharing it with selected partners. The idea is to strengthen global systems first, before tools like this fall into the wrong hands.
It clearly shows that we’re not even close to the limit of what these models are capable of much much more. And hence we’ll need more AI compute.
That’s why this continues to be the most important theme. And companies across chips, cloud, hardware manufacturing, networking, and power systems are seeing incredible growth. Recent earnings have confirmed how strong demand really is. Many suppliers are reporting record orders, multi-year backlog commitments, and faster deployment cycles. Even second-order players such as design tools, memory, cooling, and optical components are benefiting as the ecosystem scales.
That is why the AI infrastructure theme continues to lead. If you have not yet explored the AI infrastructure, semiconductor, and photonics portfolios, it is critical to be taking a look.
The companies that did pull back are already recovering quickly. And many of the strongest names barely moved at all, while many growth stocks were selling off.
So, here are a few on the key names and subsectors to keep an eye on right now. Many of them should be already familiar but I wanted to highlight them anyway.
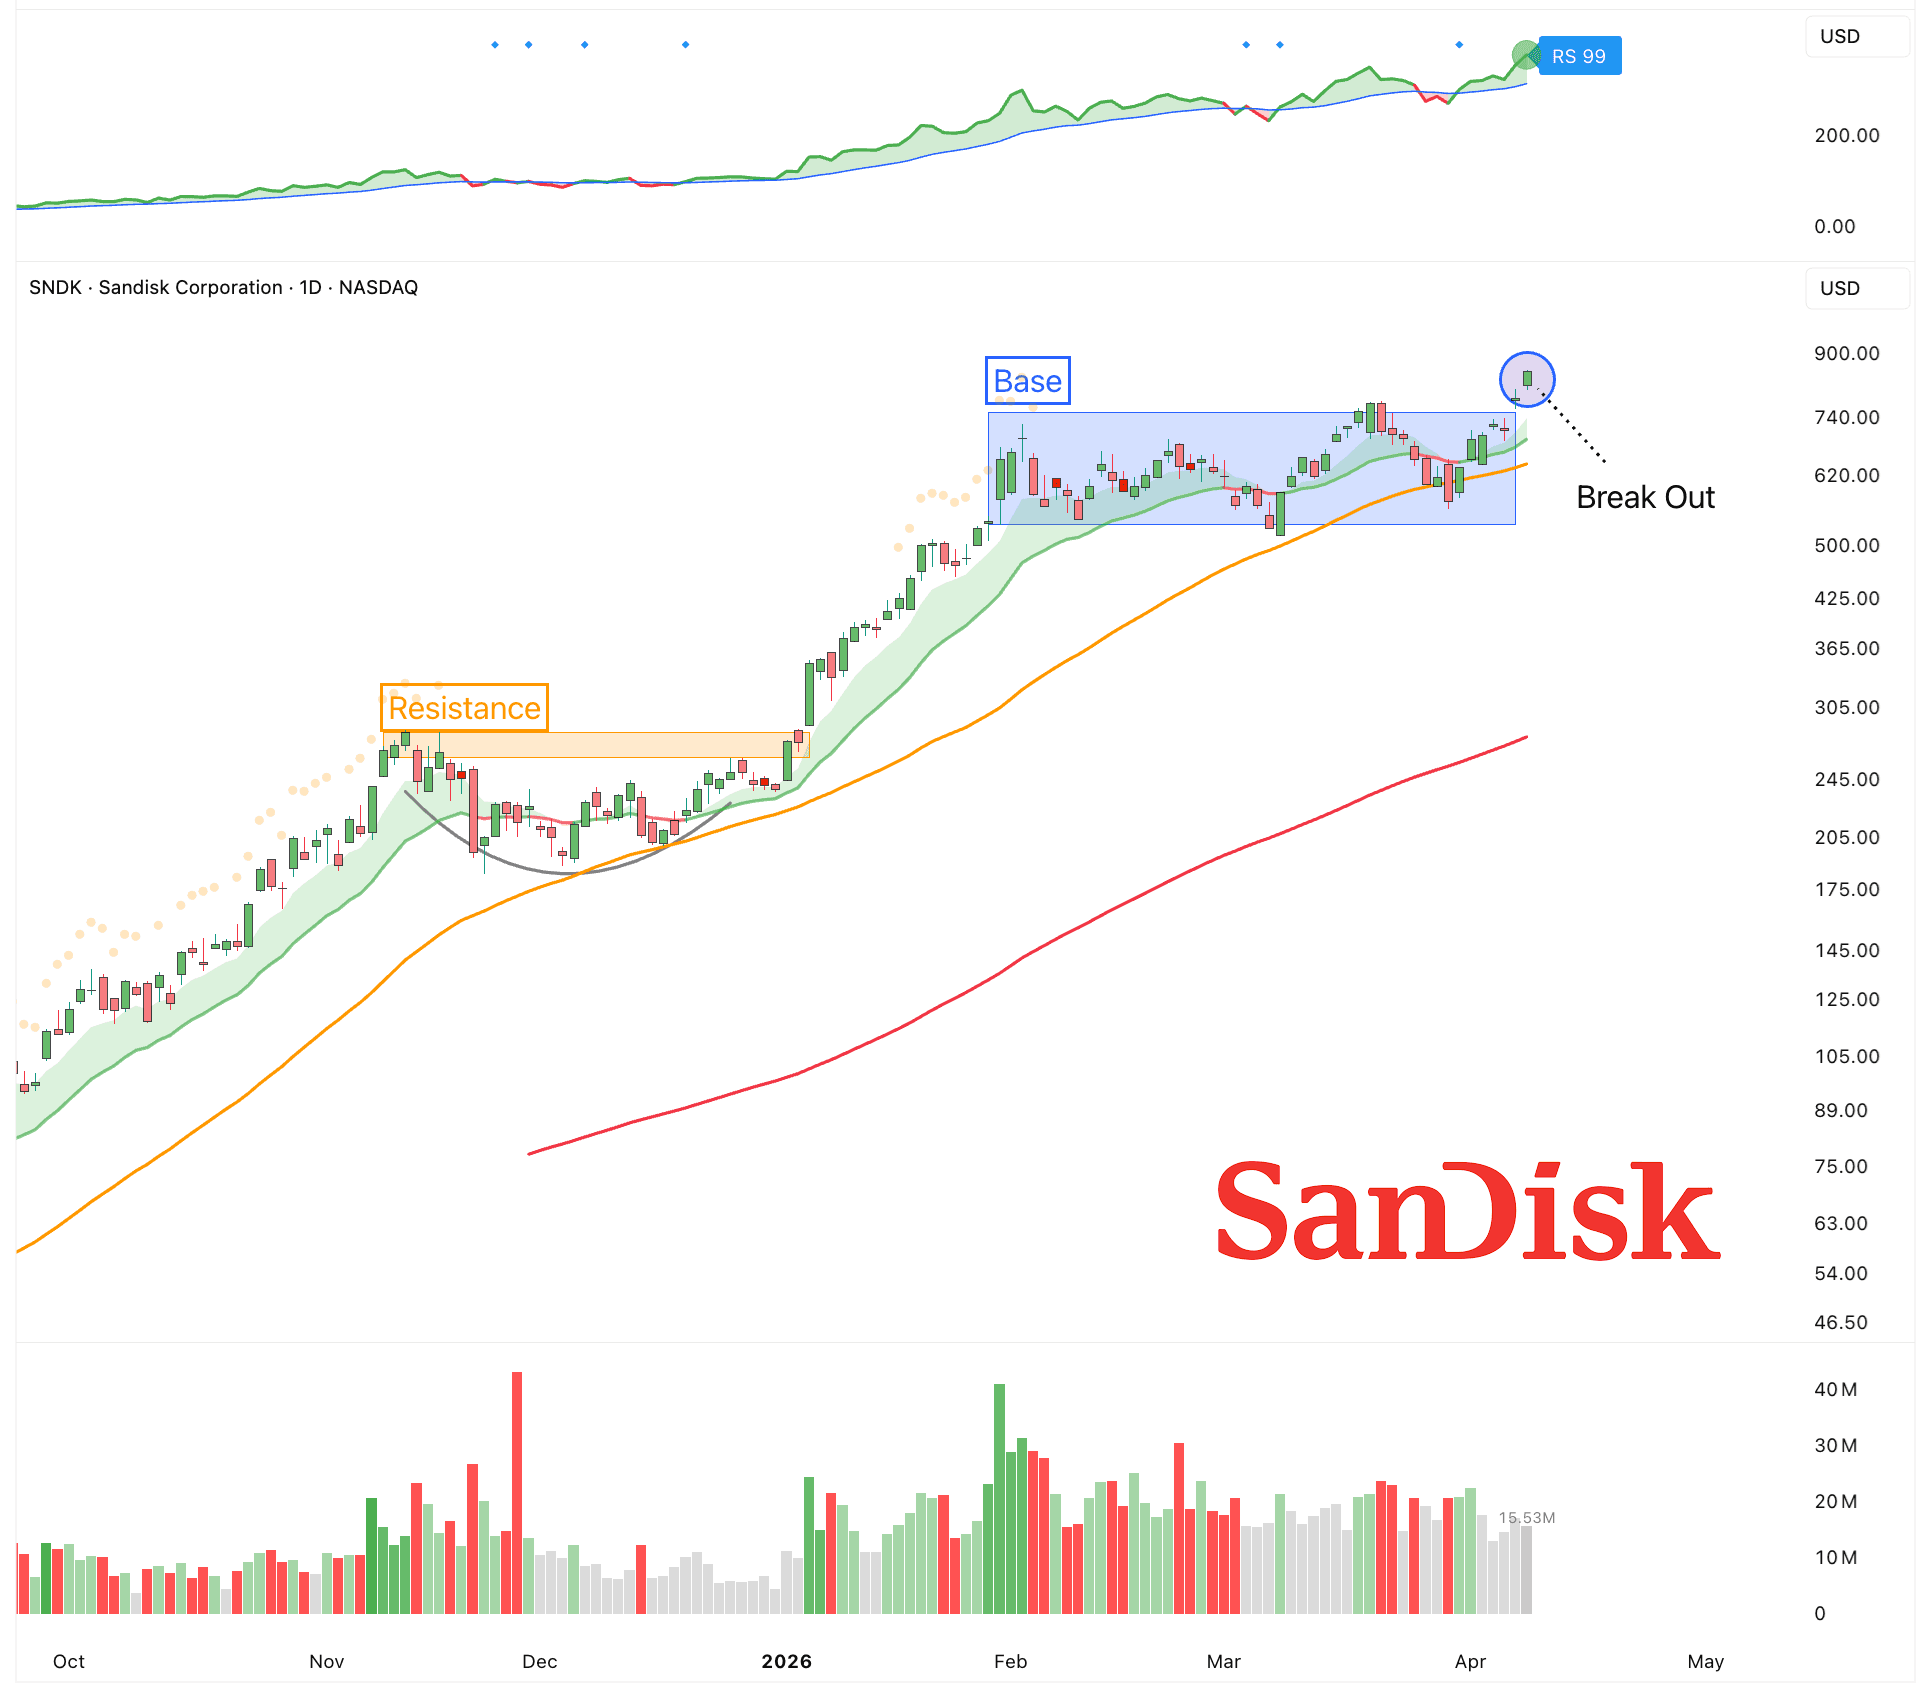
Memory & Storage
Storage is becoming a critical part of the AI infrastructure stack.
Training and running large models requires moving massive amounts of data quickly, which puts pressure on both capacity and speed. Solid-state drives are increasingly used because they offer much faster read and write performance than traditional hard drives, which helps keep GPUs fully utilized instead of waiting for data. Hard drives still matter for long-term data retention and training datasets.
Sandisk ($SNDK)
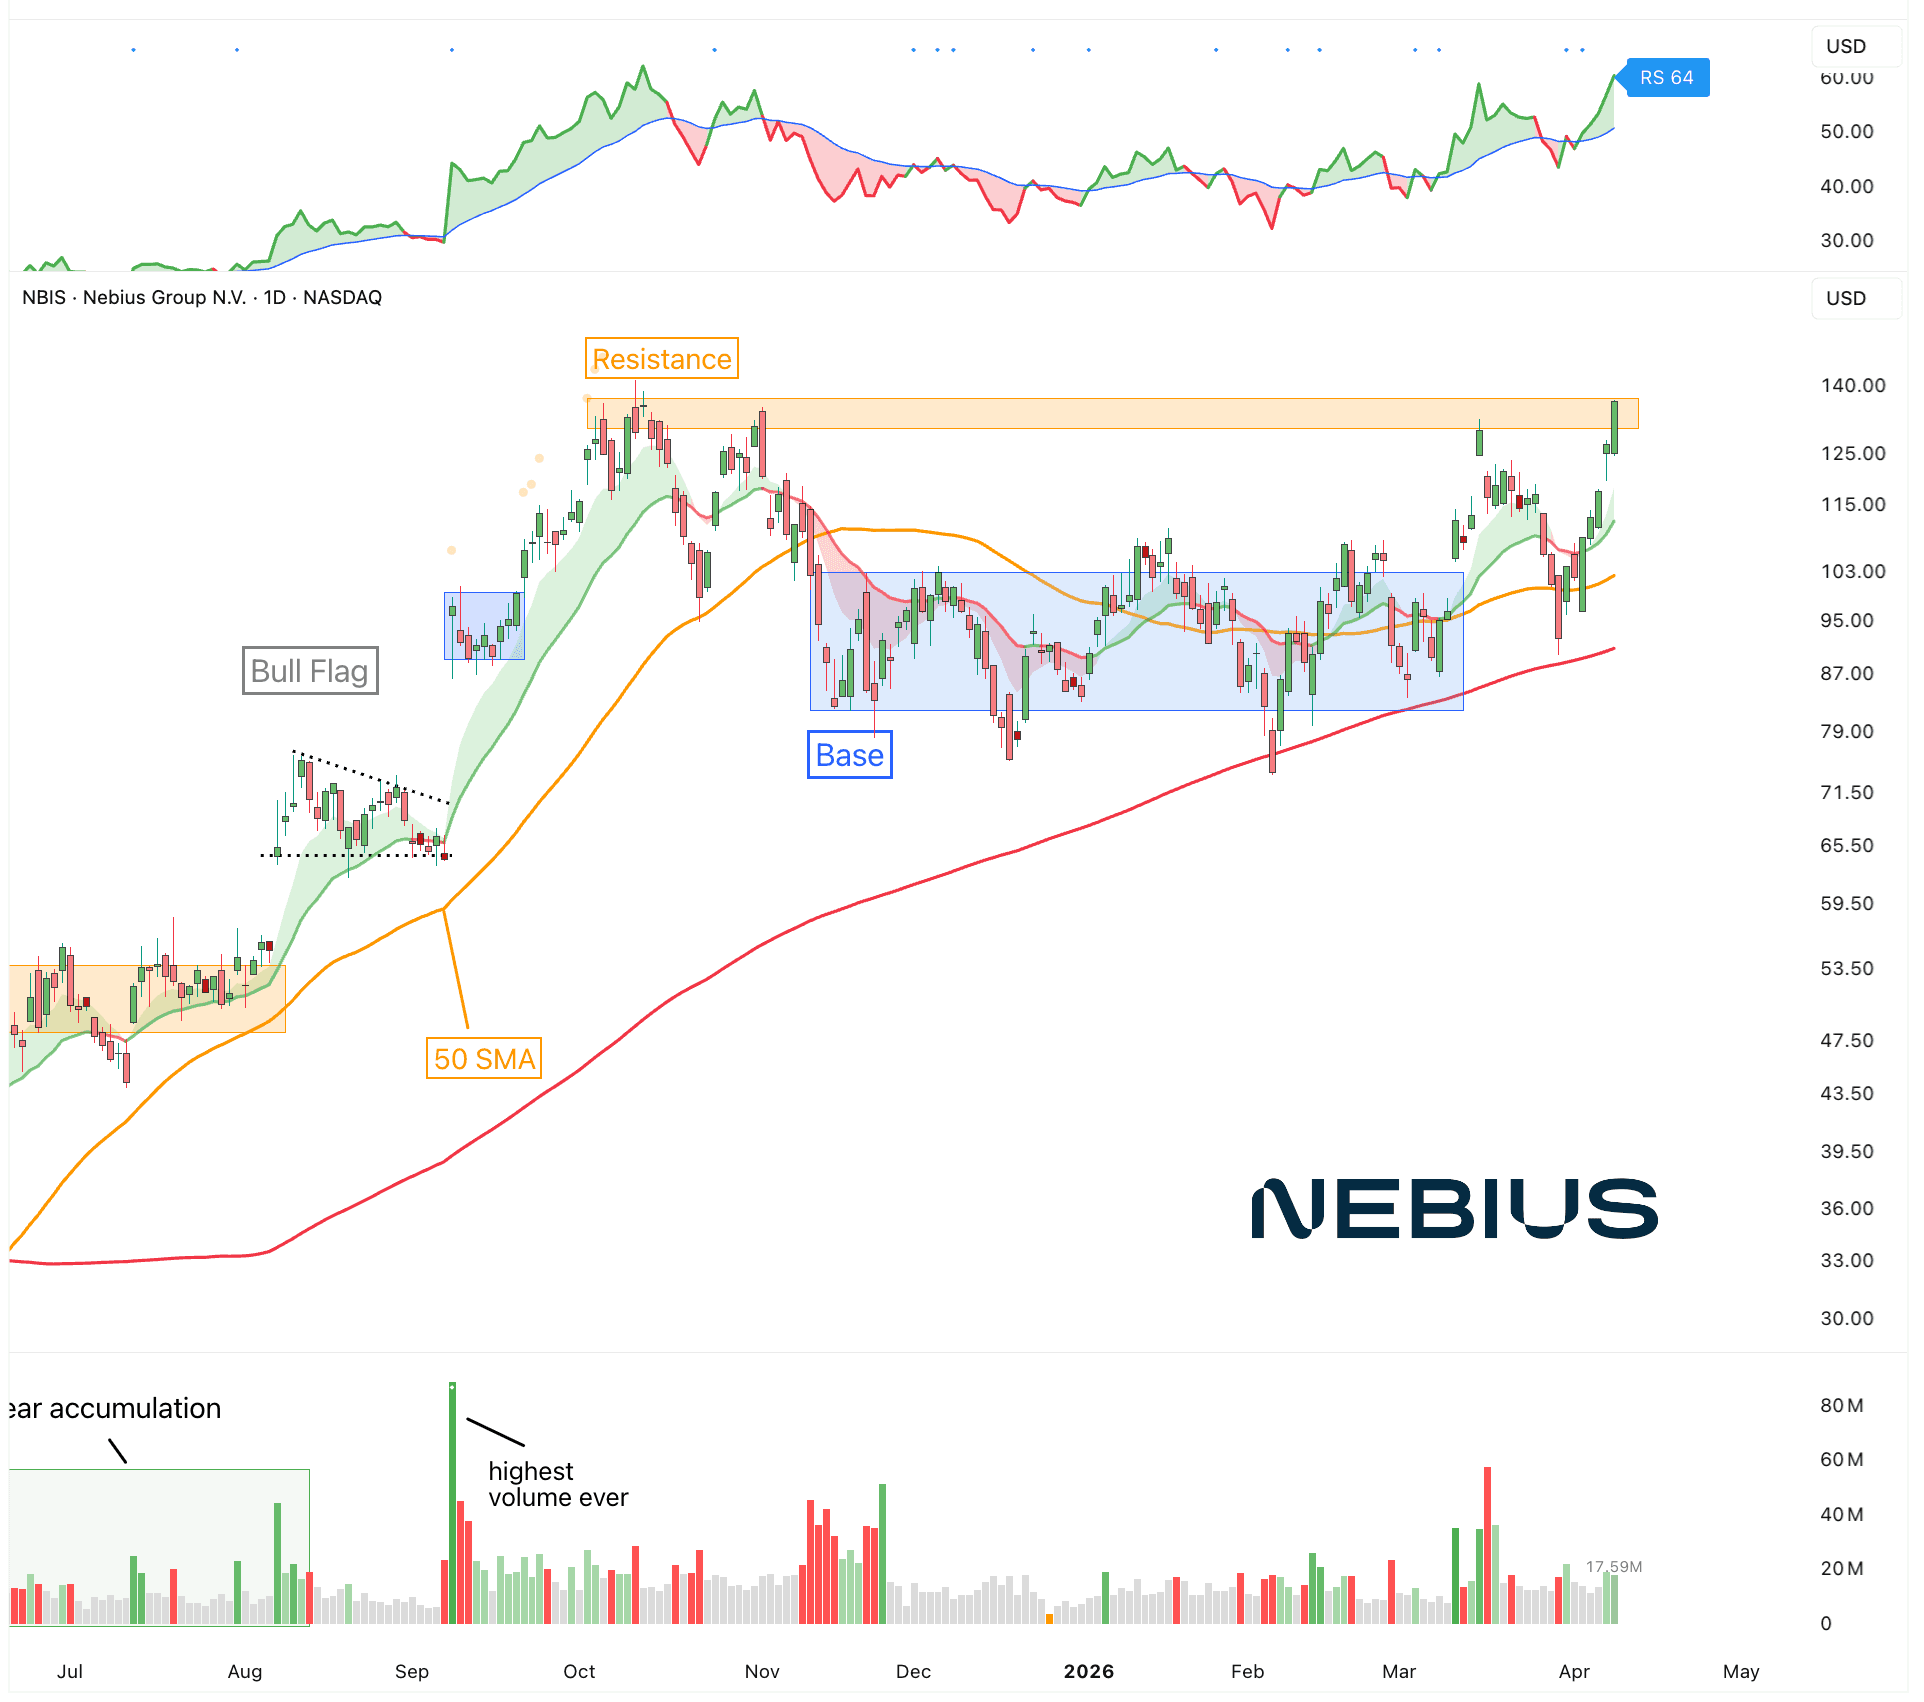
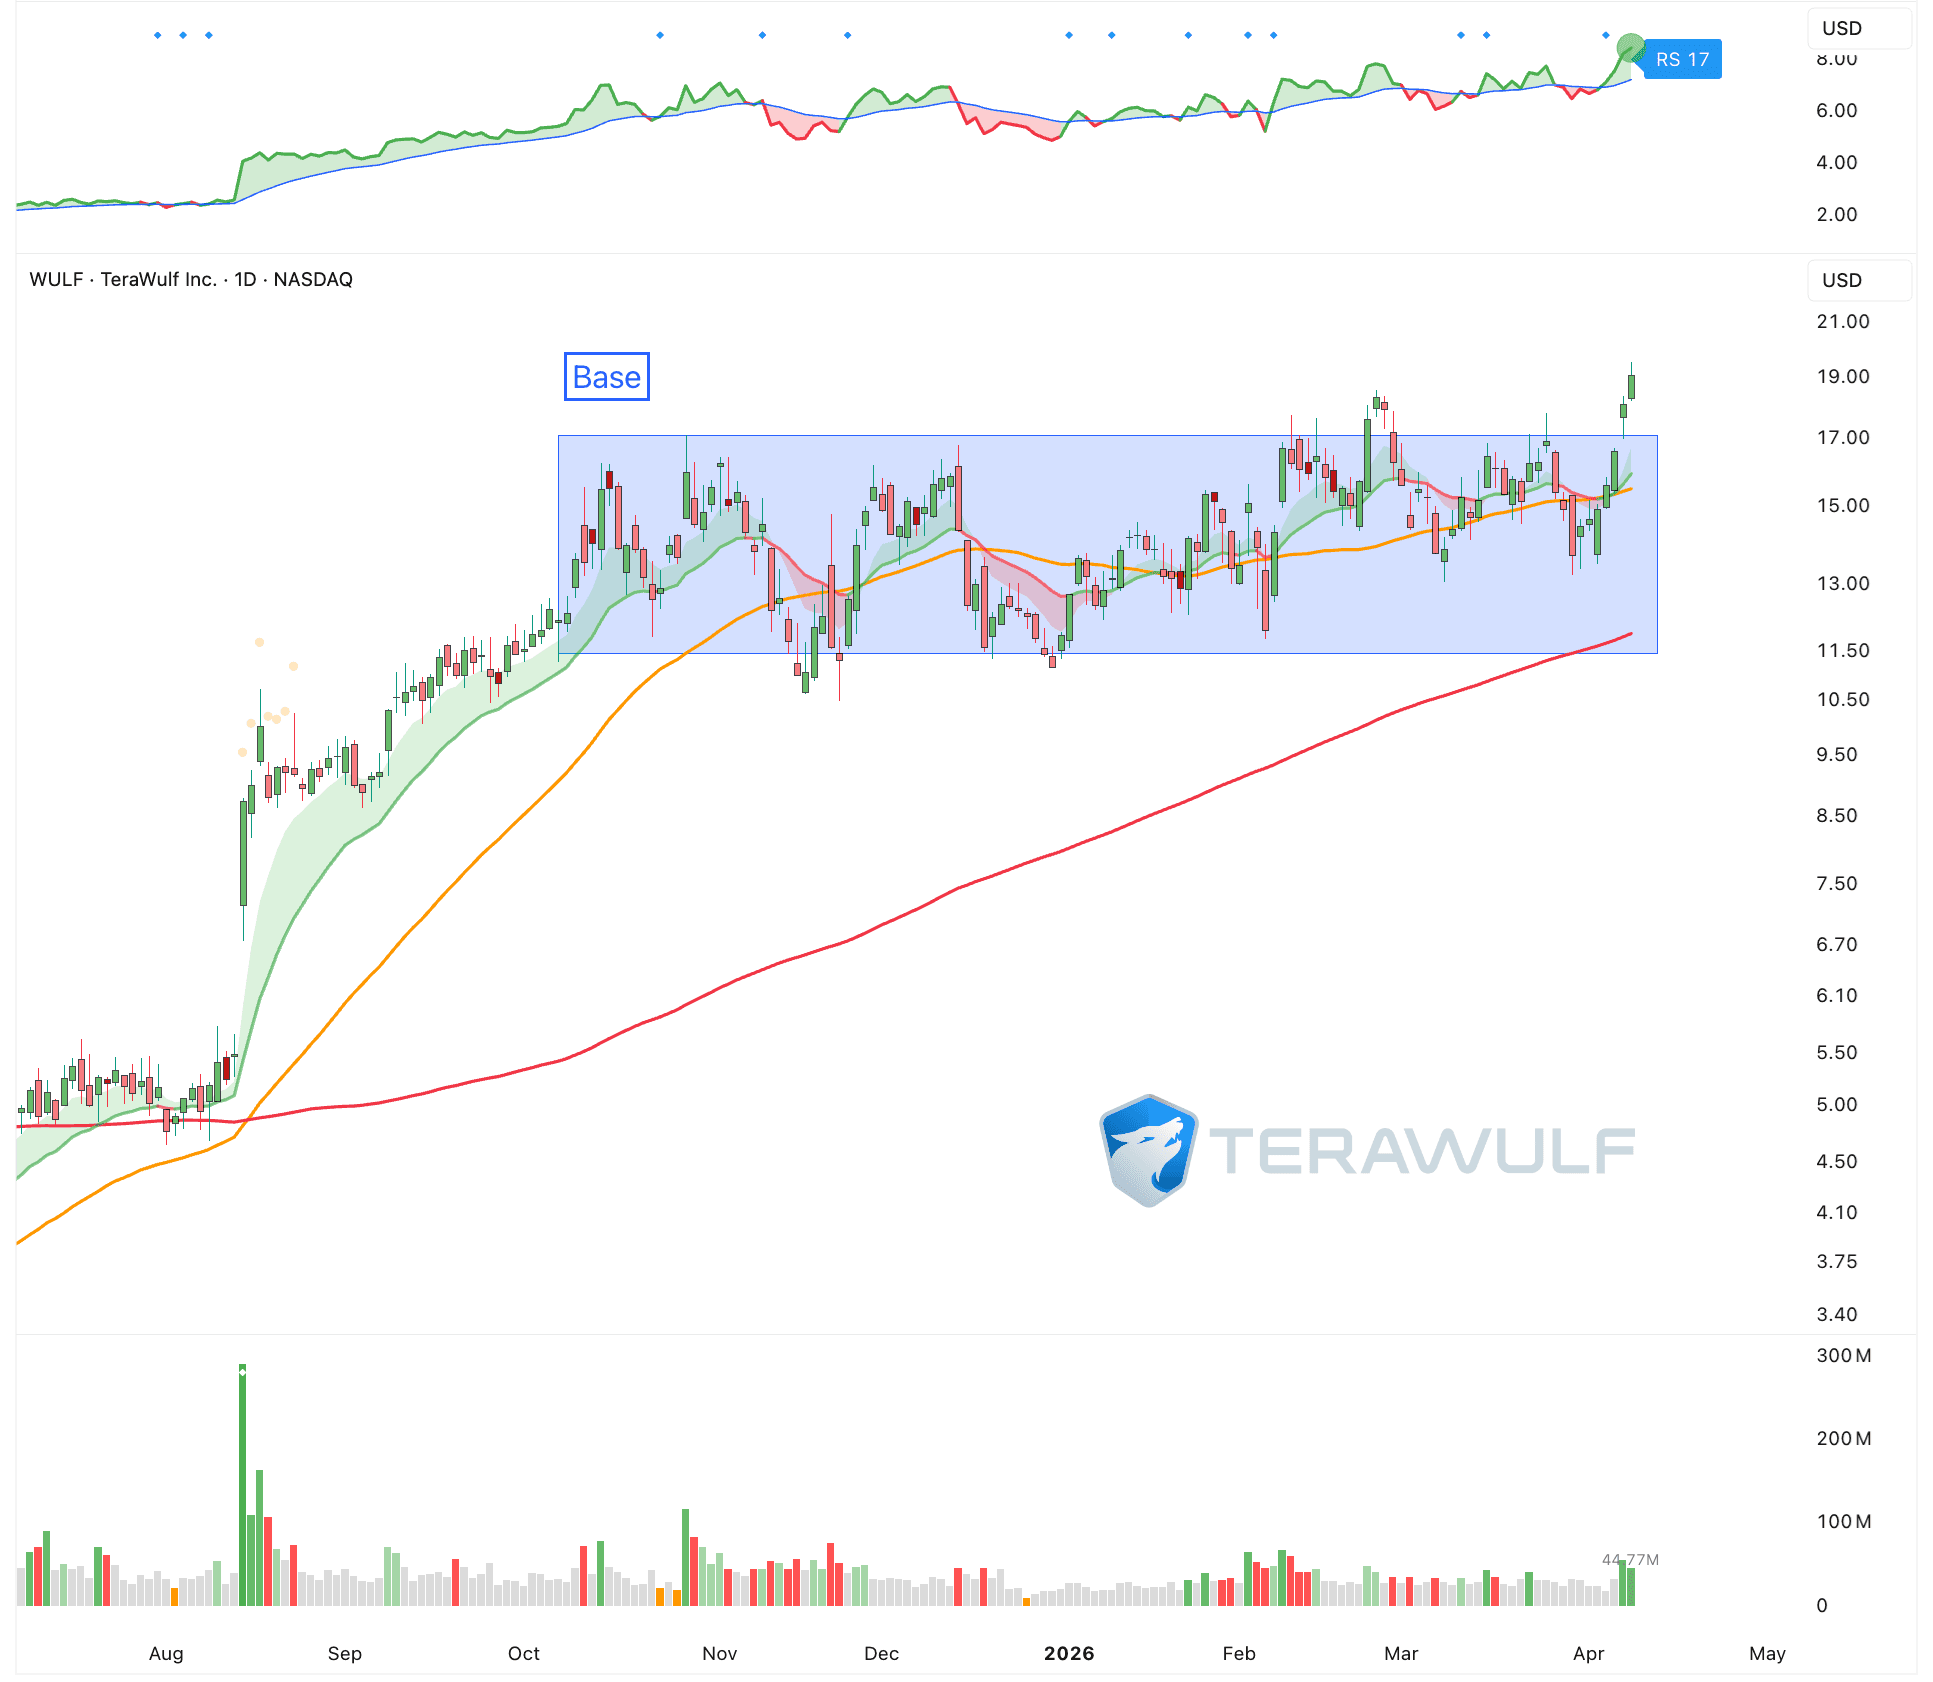
Neocloud Providers
The new generation of cloud providers are at the cire of the AI boom.
They supply the physical infrastructure that makes large-scale training and inference possible. This includes high-density racks, advanced cooling systems, high-bandwidth networking, and the power capacity to run clusters of GPUs around the clock.
Traditional hyperscalers are expanding aggressively, but smaller and more specialized AI cloud companies are growing even faster. These firms move quicker and can tailor their architecture specifically for AI workloads.
Nebius ($NBIS)
Terawulf ($WULF)
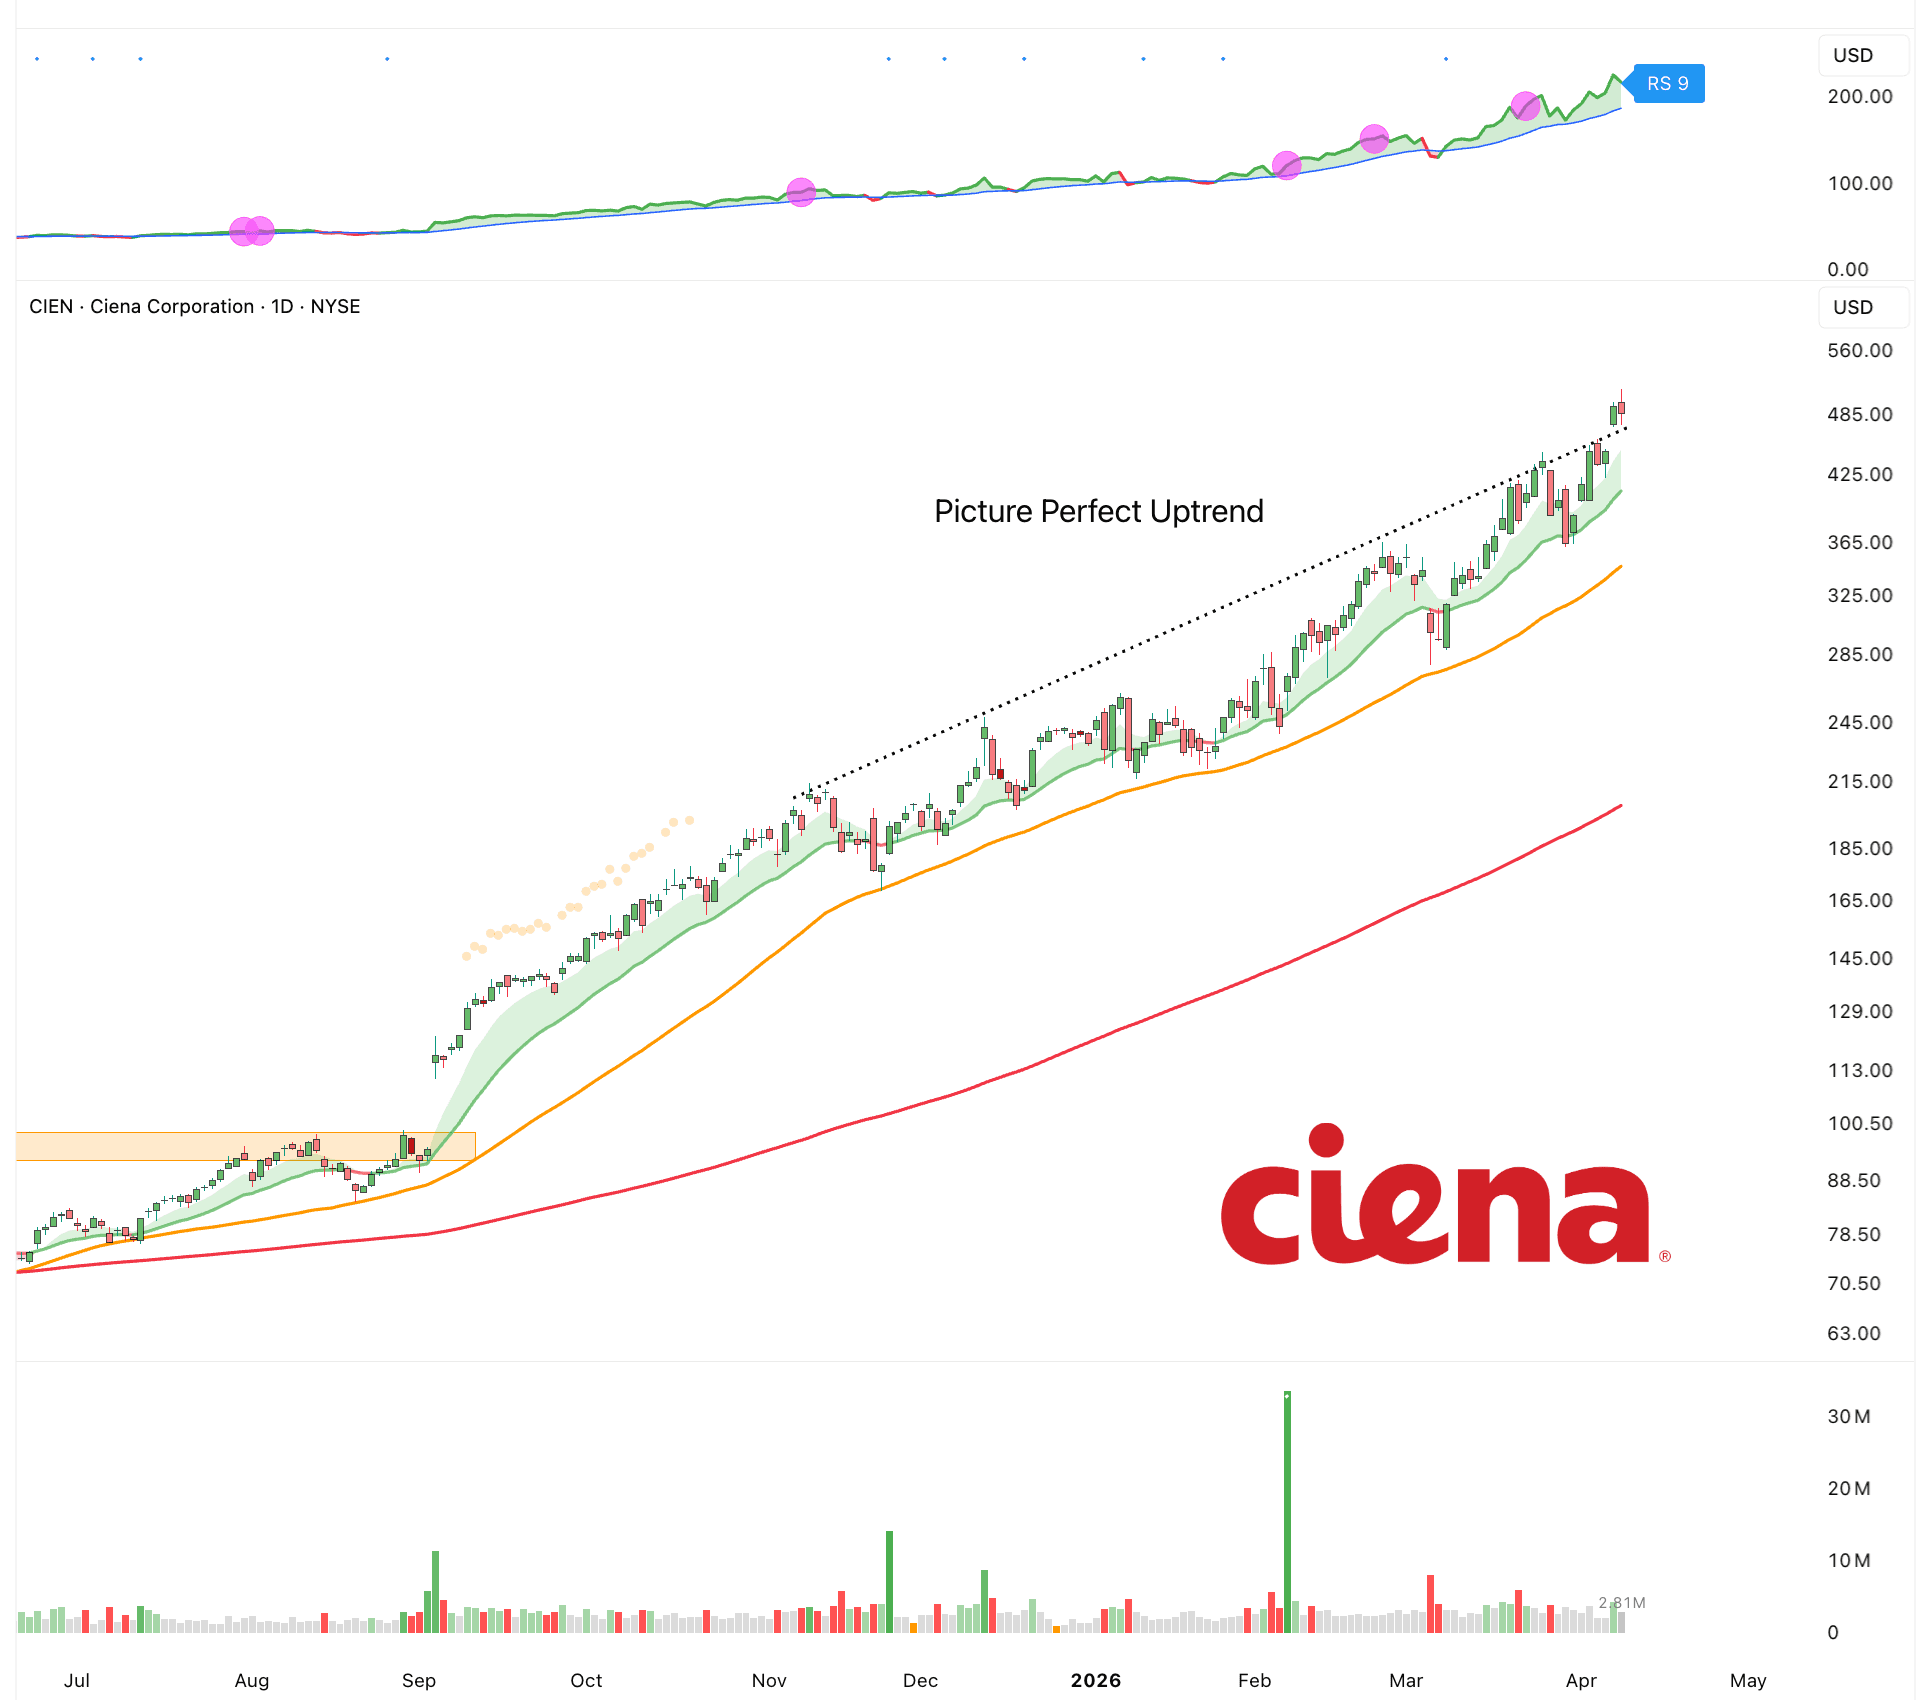
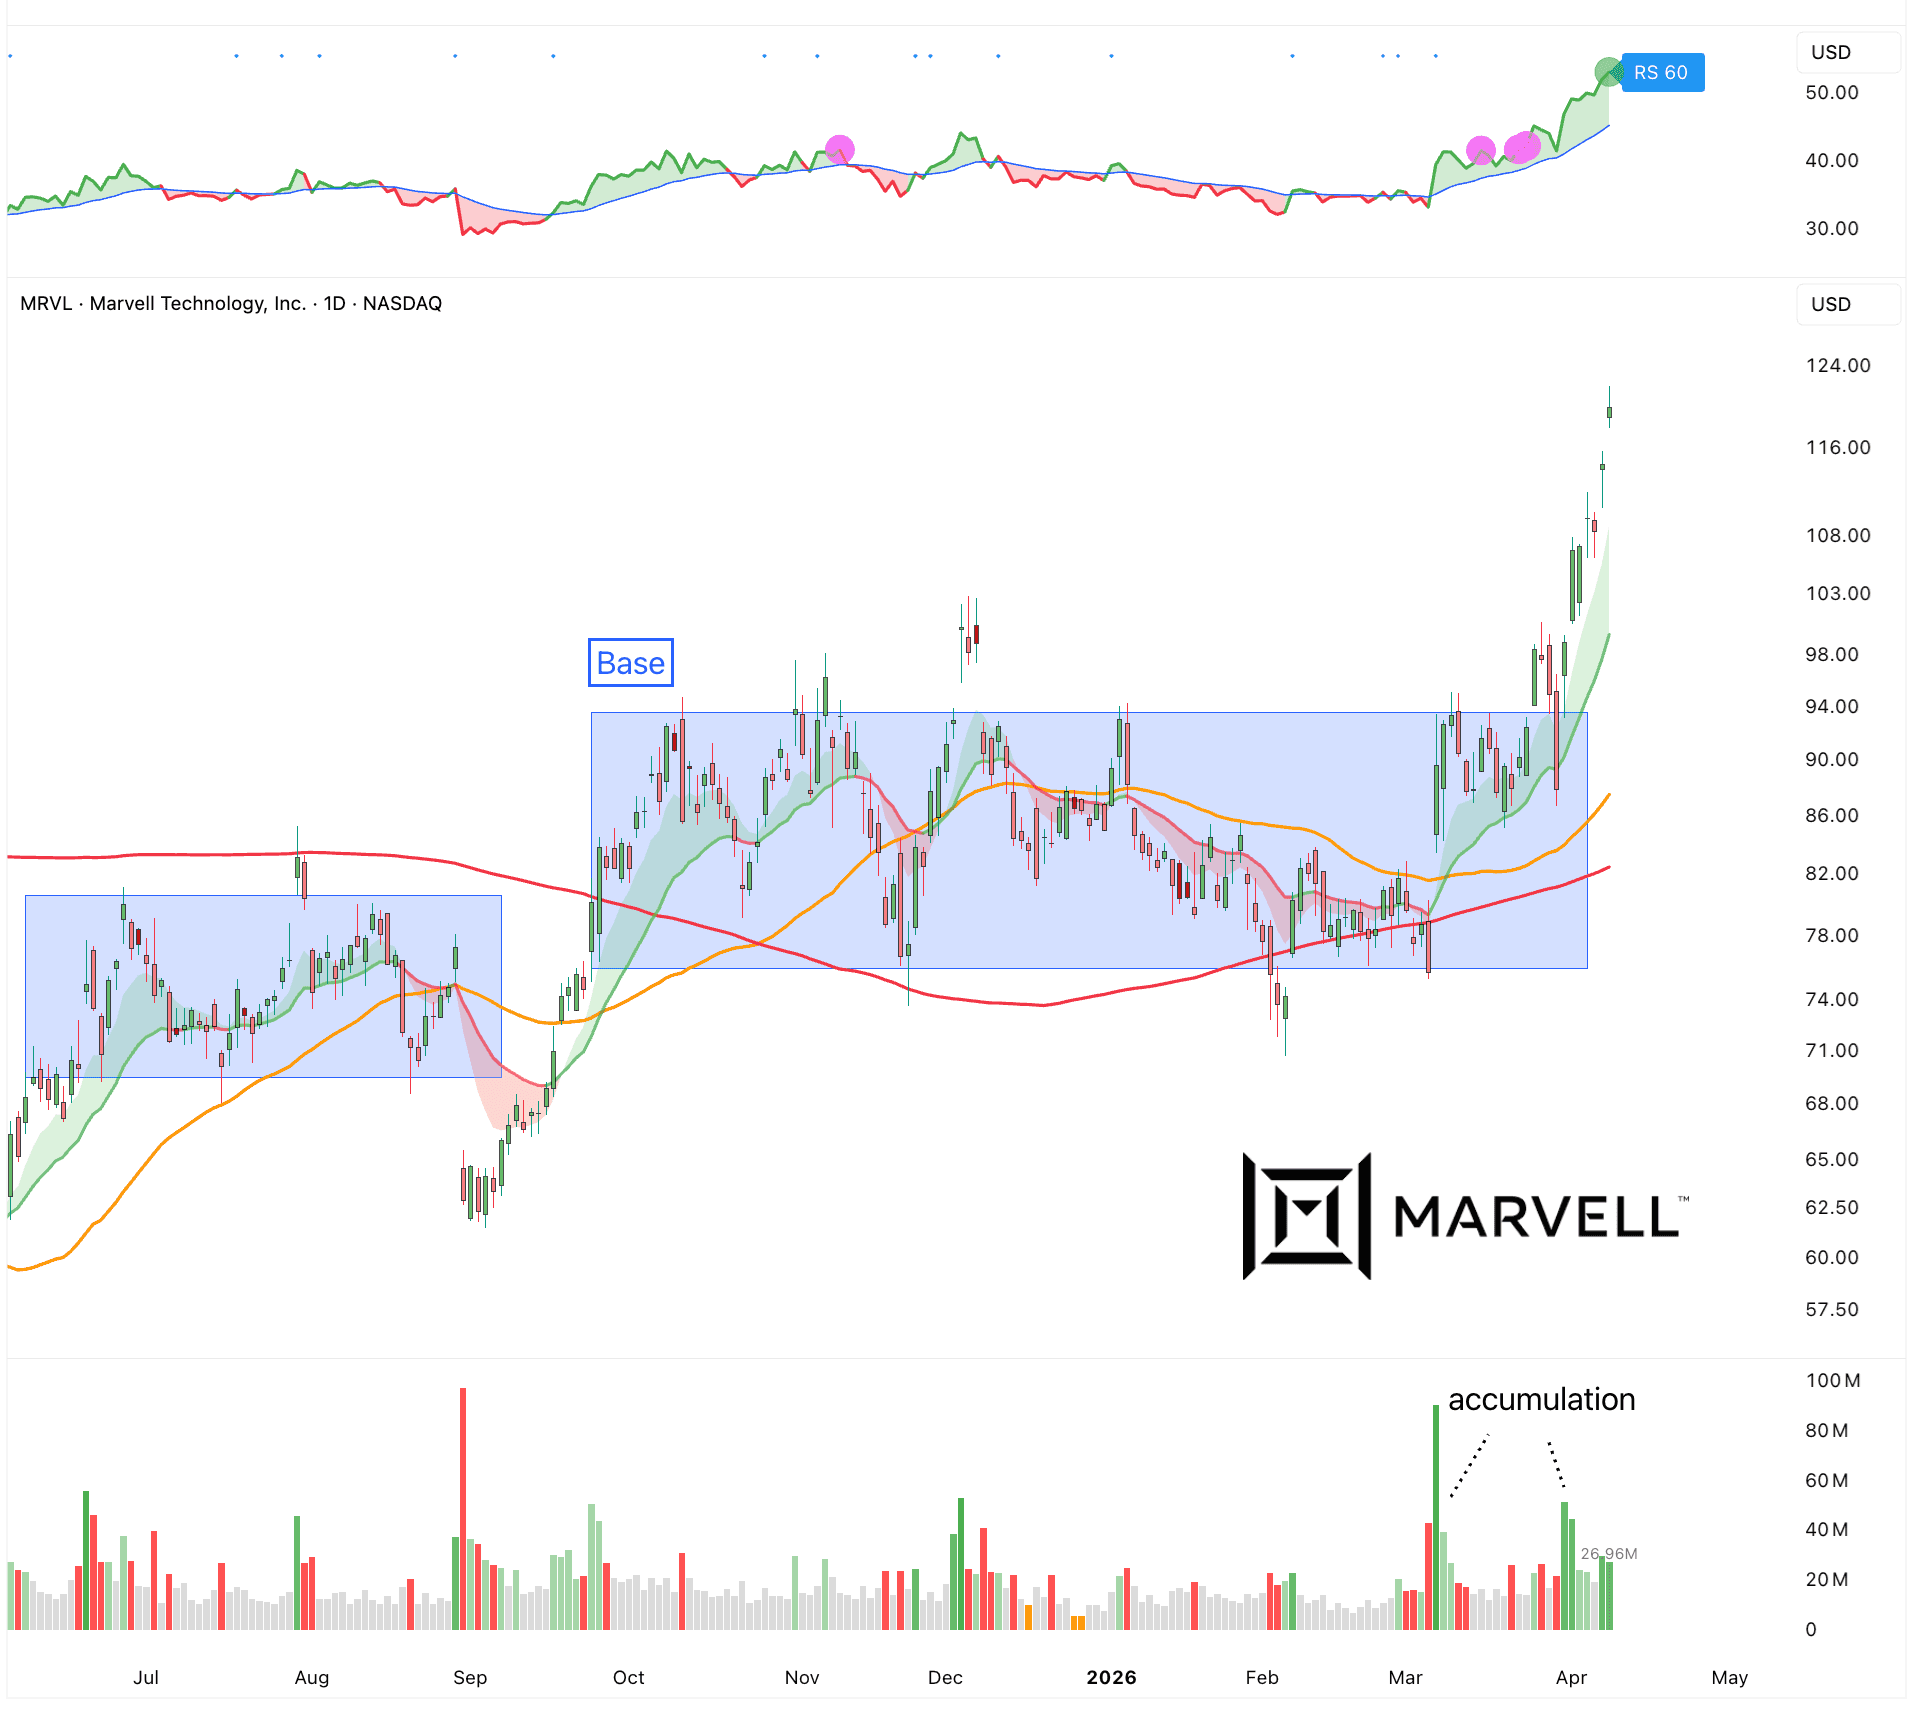
Networking
Moving data between GPUs, servers, and storage systems requires extremely high bandwidth and low latency. Without fast networking, even the most advanced chips sit idle waiting for data.
This is why technologies like high-speed optical interconnects, advanced switches, and specialized network fabrics are seeing strong demand. As models grow and training clusters scale to thousands of GPUs, the bottleneck is no longer just the chip. It is how fast data can move across the system.
High-bandwidth, low-latency networking is required to keep GPUs fully utilized, which is why demand for optical interconnects, advanced switches, and specialized network fabrics is accelerating.
The faster the network, the more efficient the compute.
Networking is not a supporting role. It is a critical layer that directly determines the performance and cost of AI.
Ciena ($CIEN)
Marvell ($MRVL)
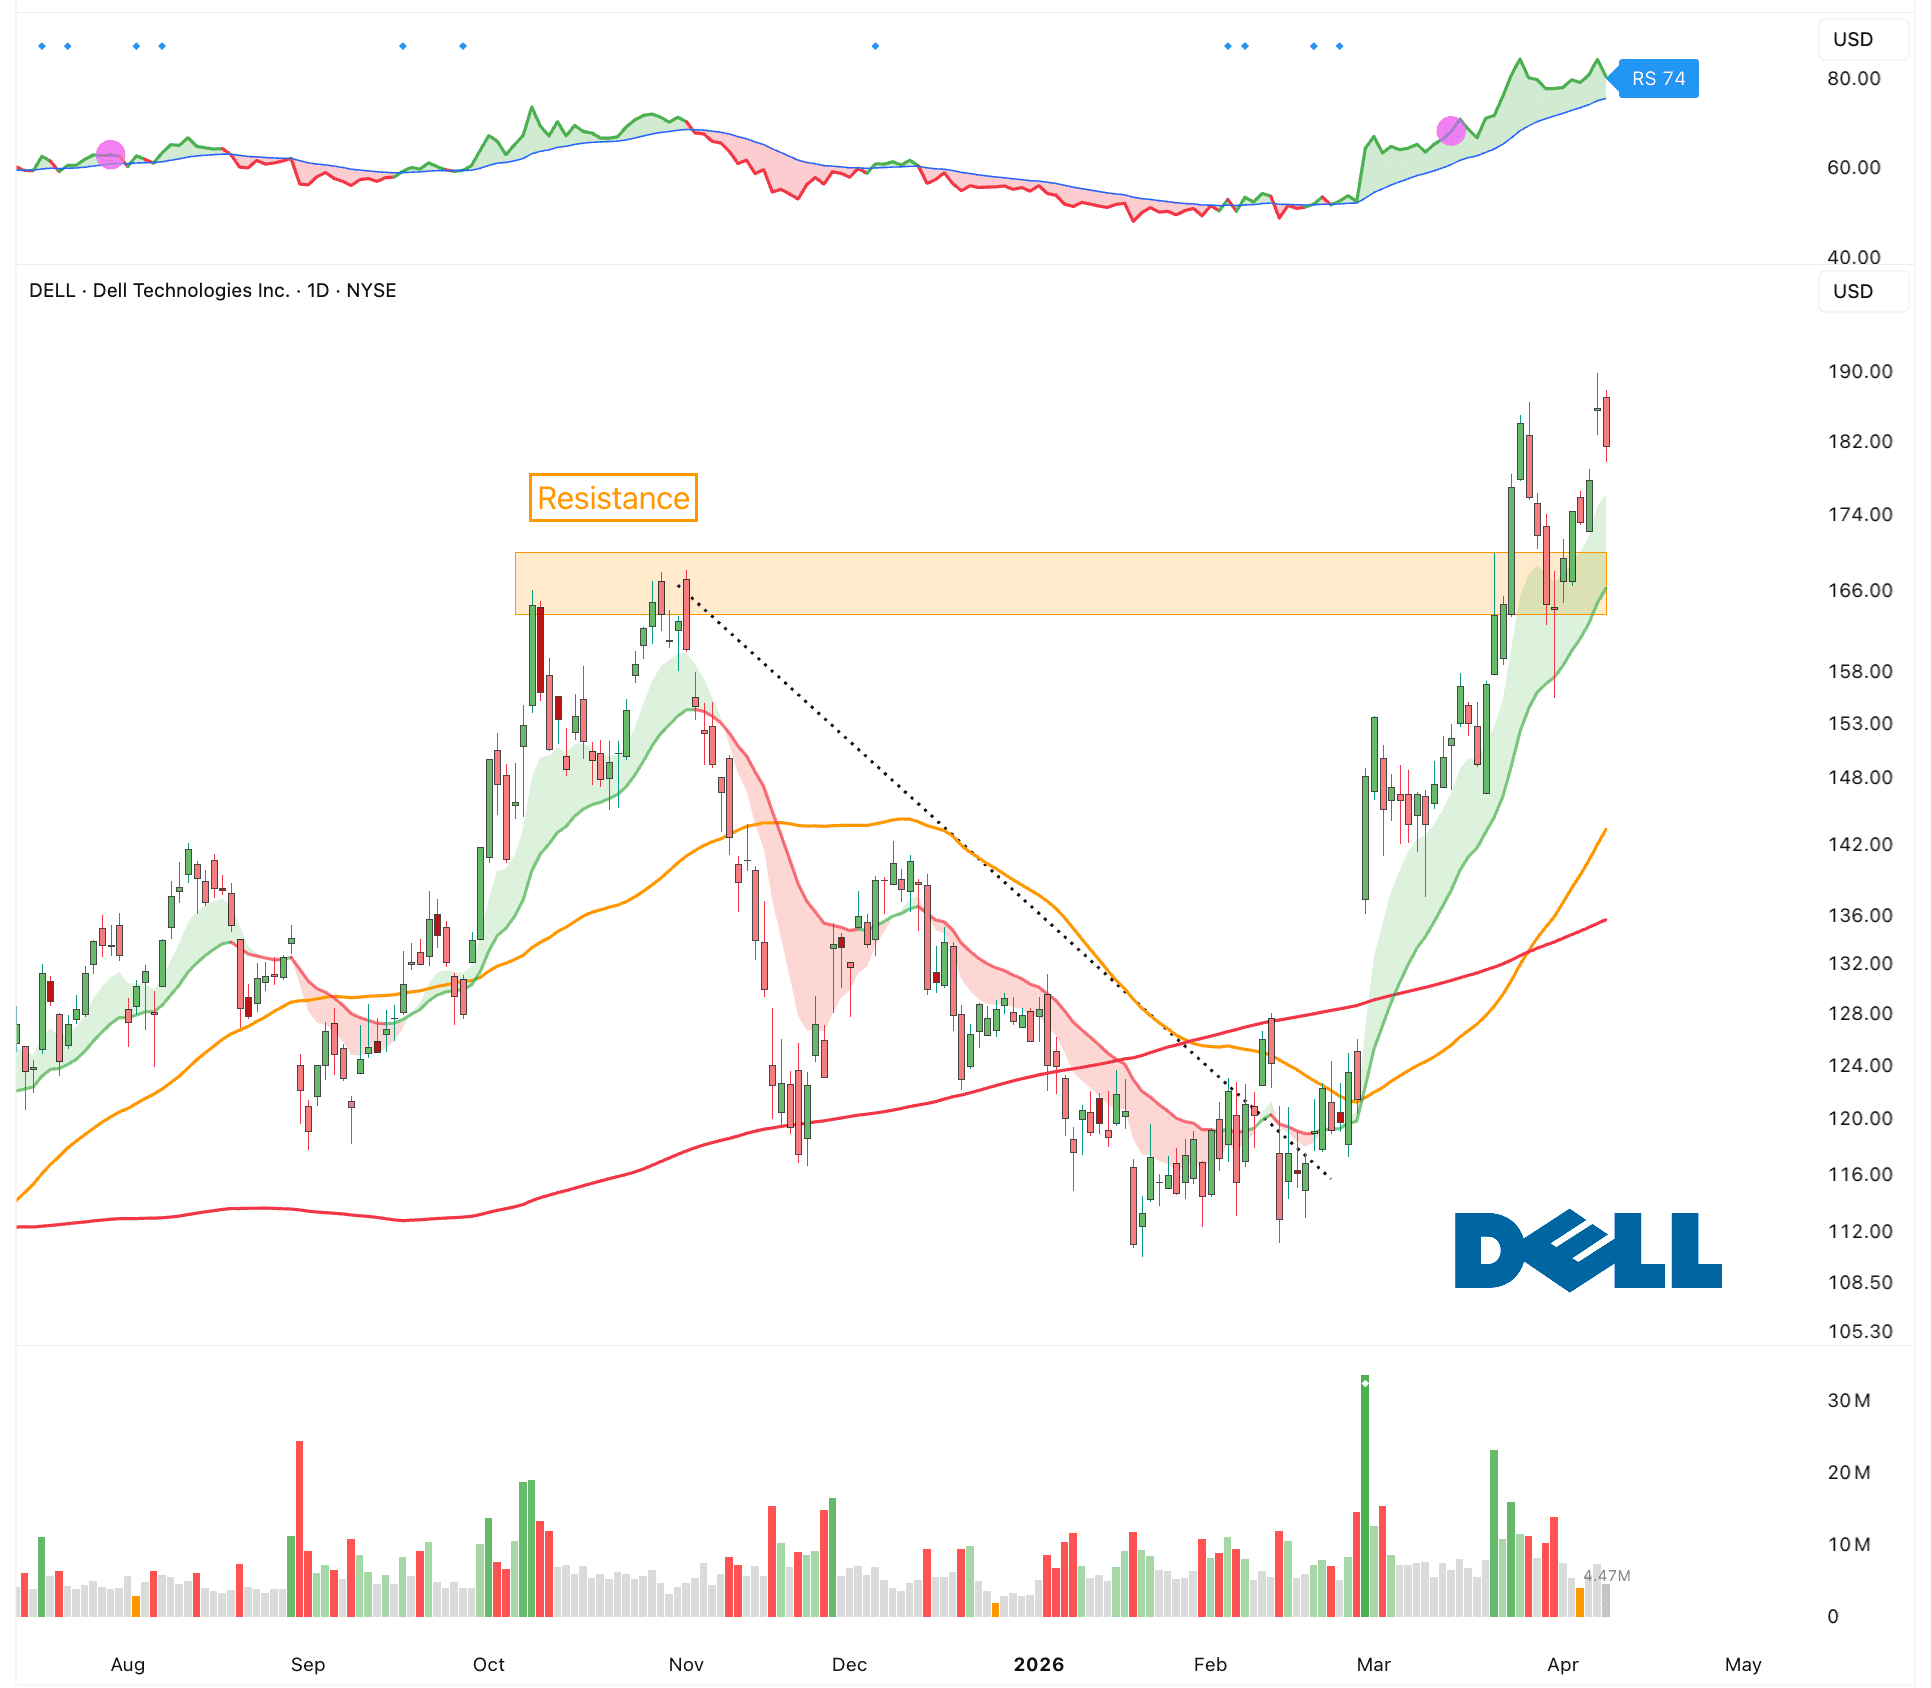
Data Centers
Every app, every AI model, every payment, every video call depends on servers that need constant power, cooling, and uptime. If power fails or systems overheat, everything goes down fast. As AI grows, this becomes even more critical. AI workloads use way more energy and create more heat than normal computing. That means better power systems, liquid cooling, and reliable infrastructure are no longer optional. They are the bottleneck.
Vertiv ($VRT)
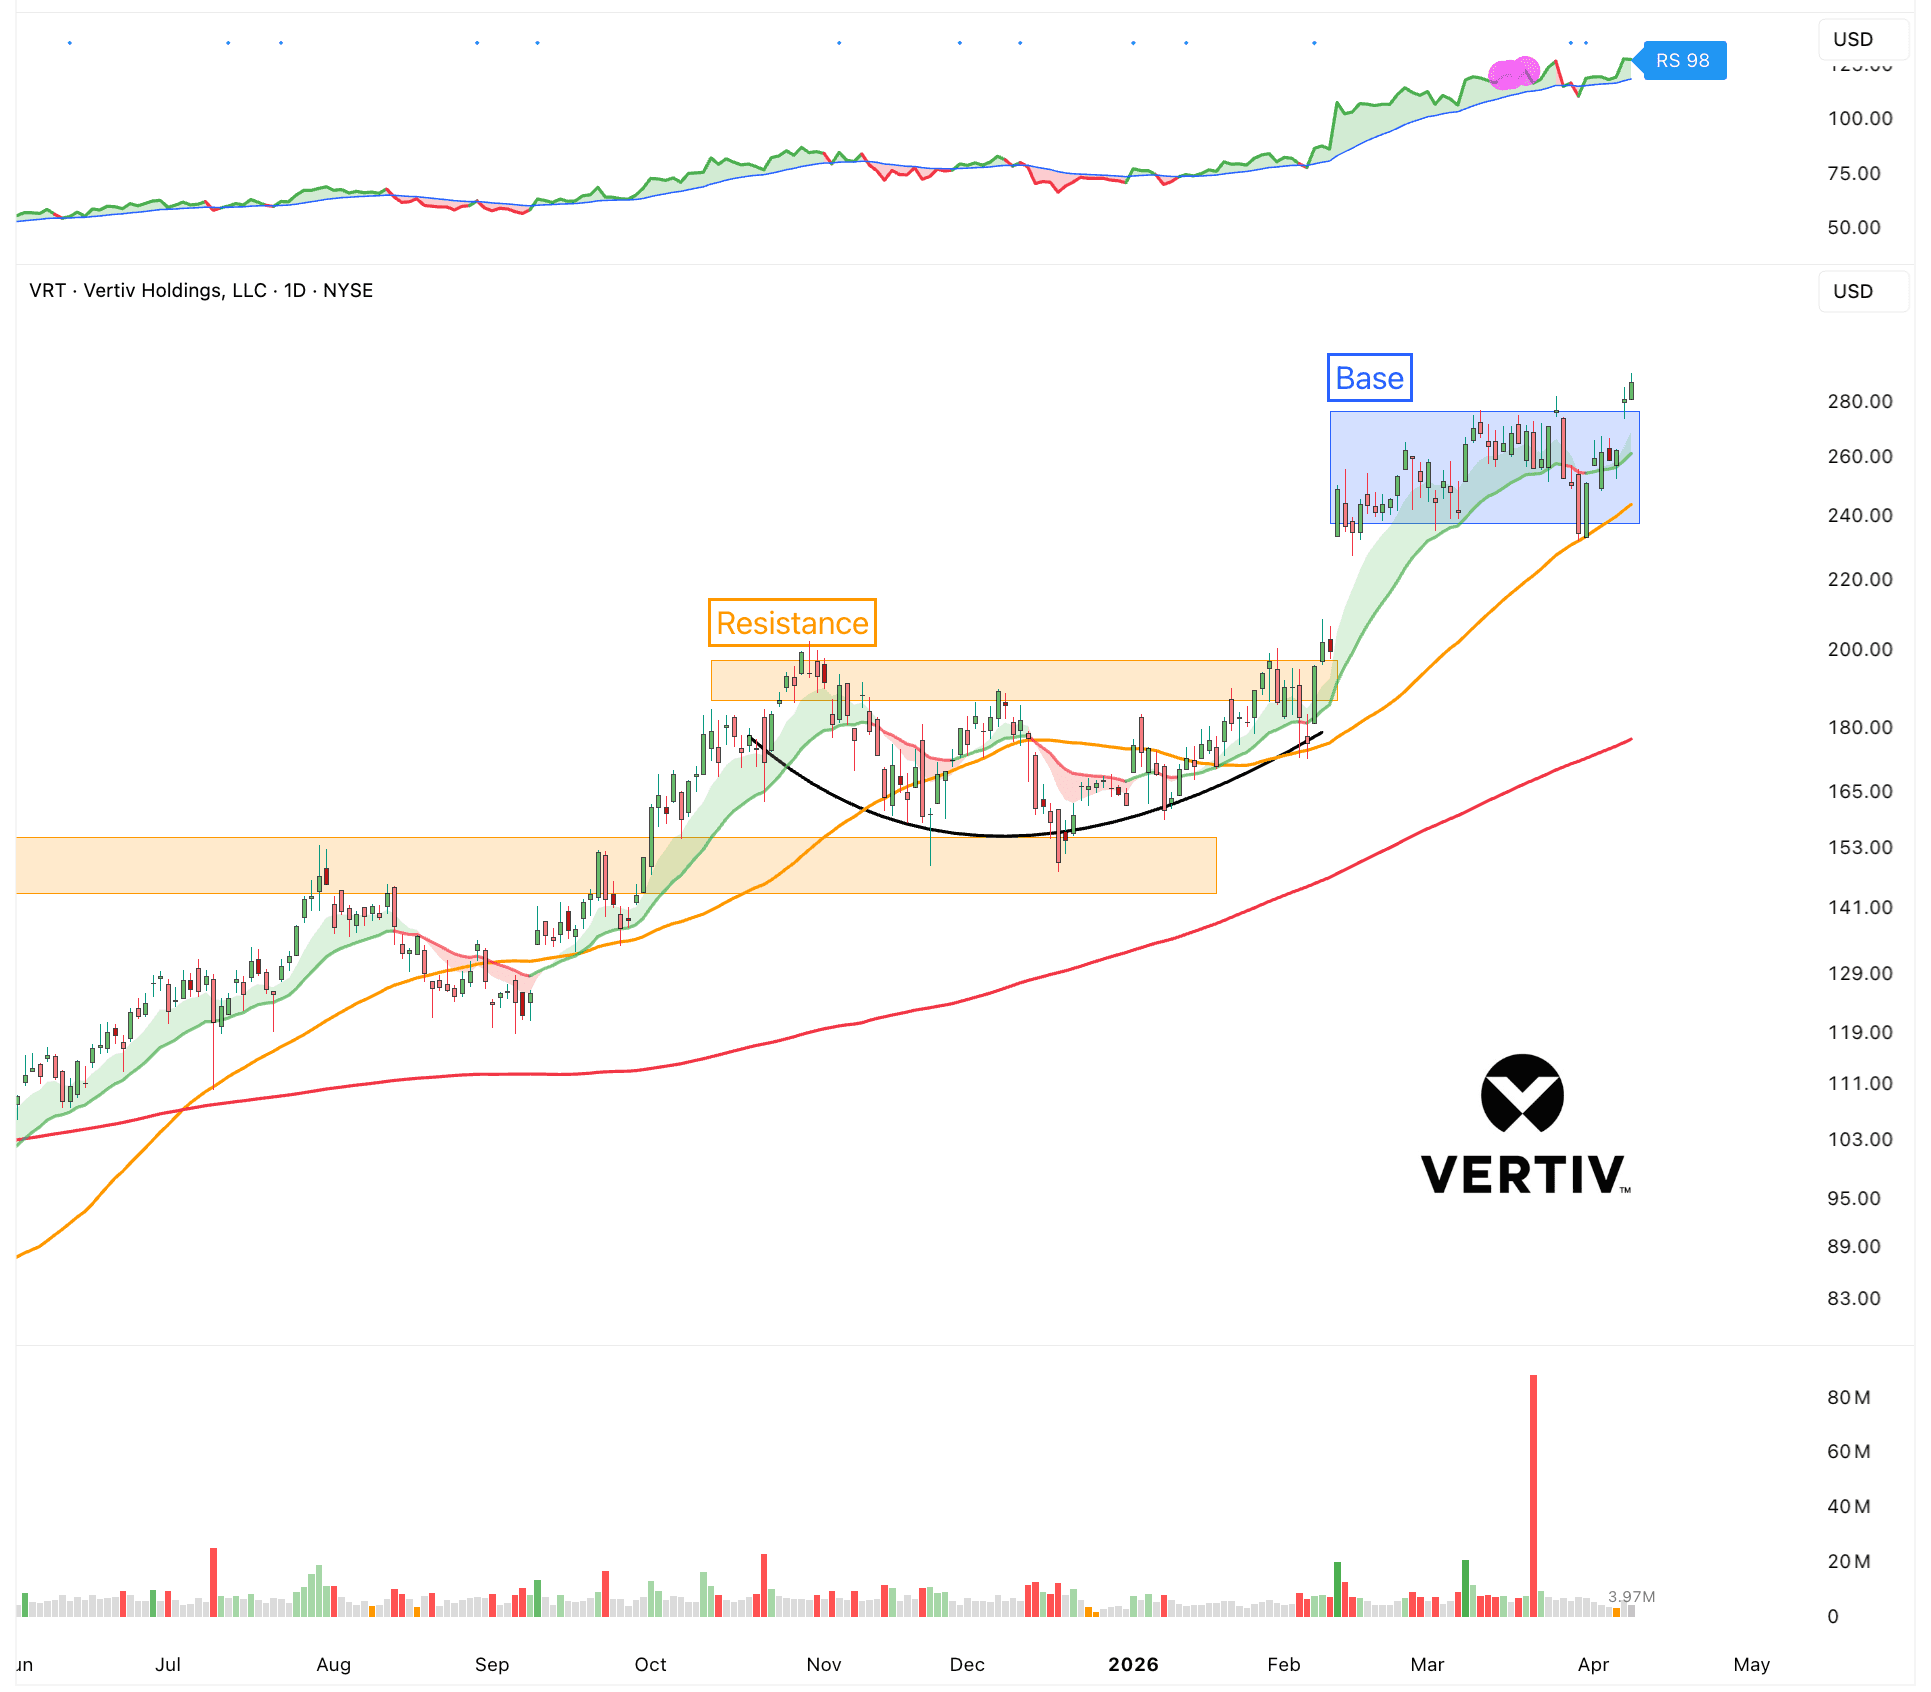
Dell ($DELL)
Semiconductors
Semiconductors remain the foundation of the entire AI ecosystem. Every improvement in model size, speed, and capability depends on more advanced chips and manufacturing processes. Demand for high-performance GPUs, specialized accelerators, memory, and advanced packaging continues to rise as training clusters grow larger and inference moves into real products. At the same time, new fabrication nodes and supply chain capacity are becoming strategic priorities for both companies and governments. Simply put, without continued progress in semiconductors, the AI wave cannot scale.
TSMC ($TSM)
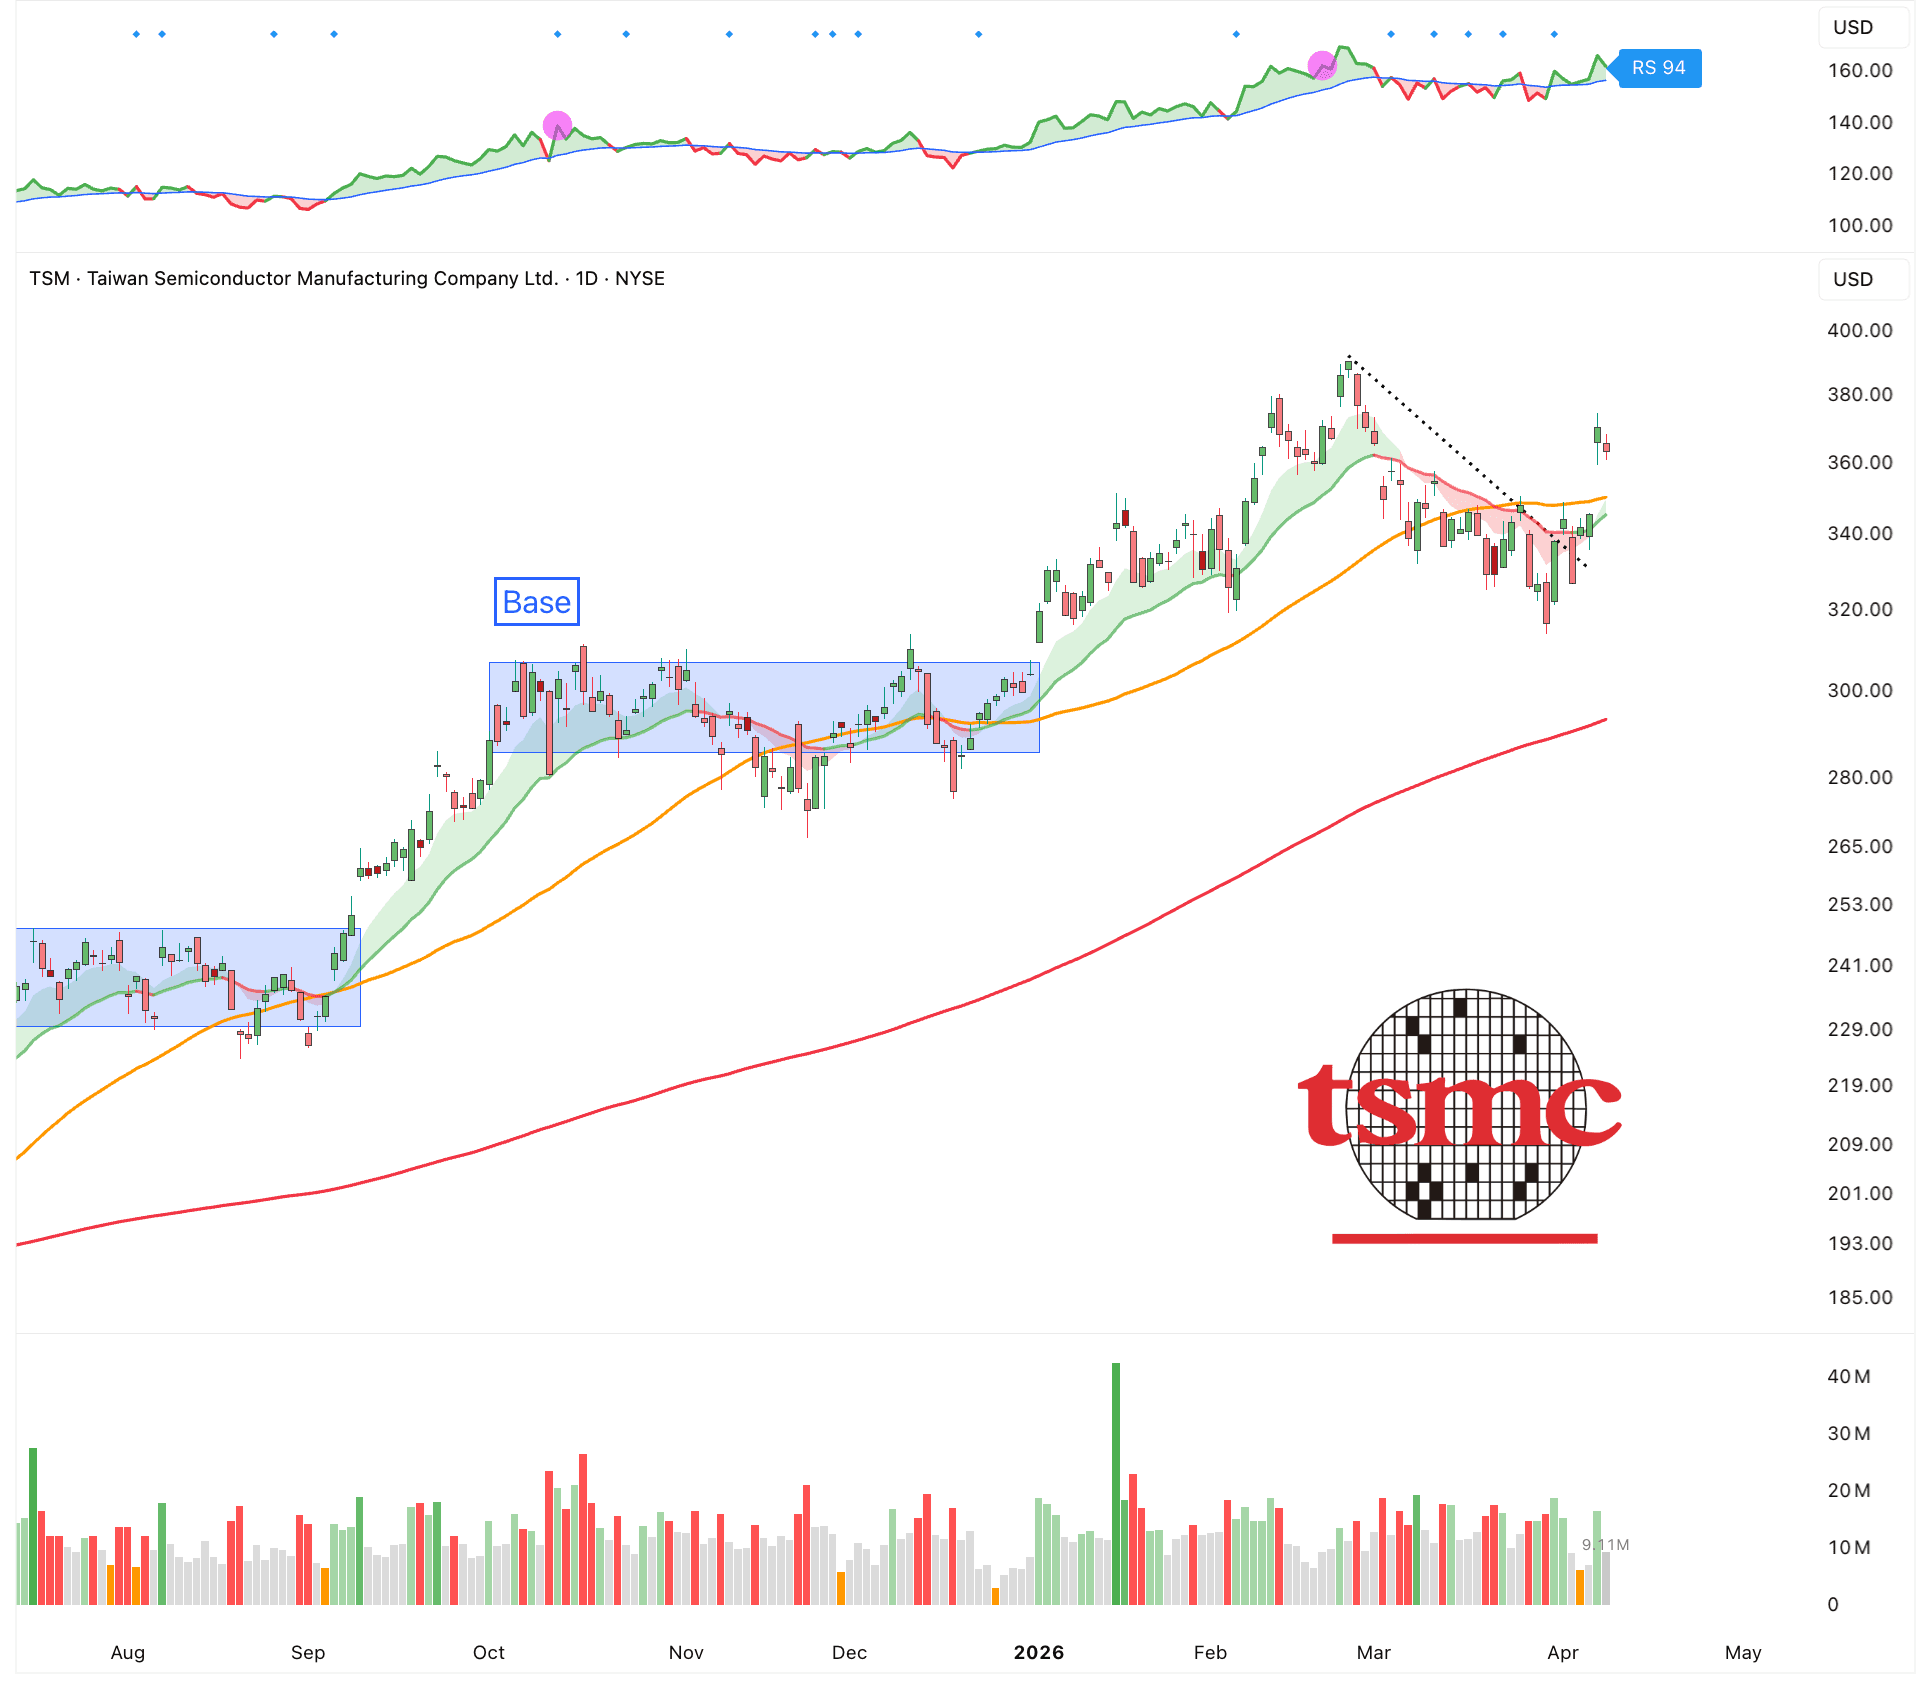
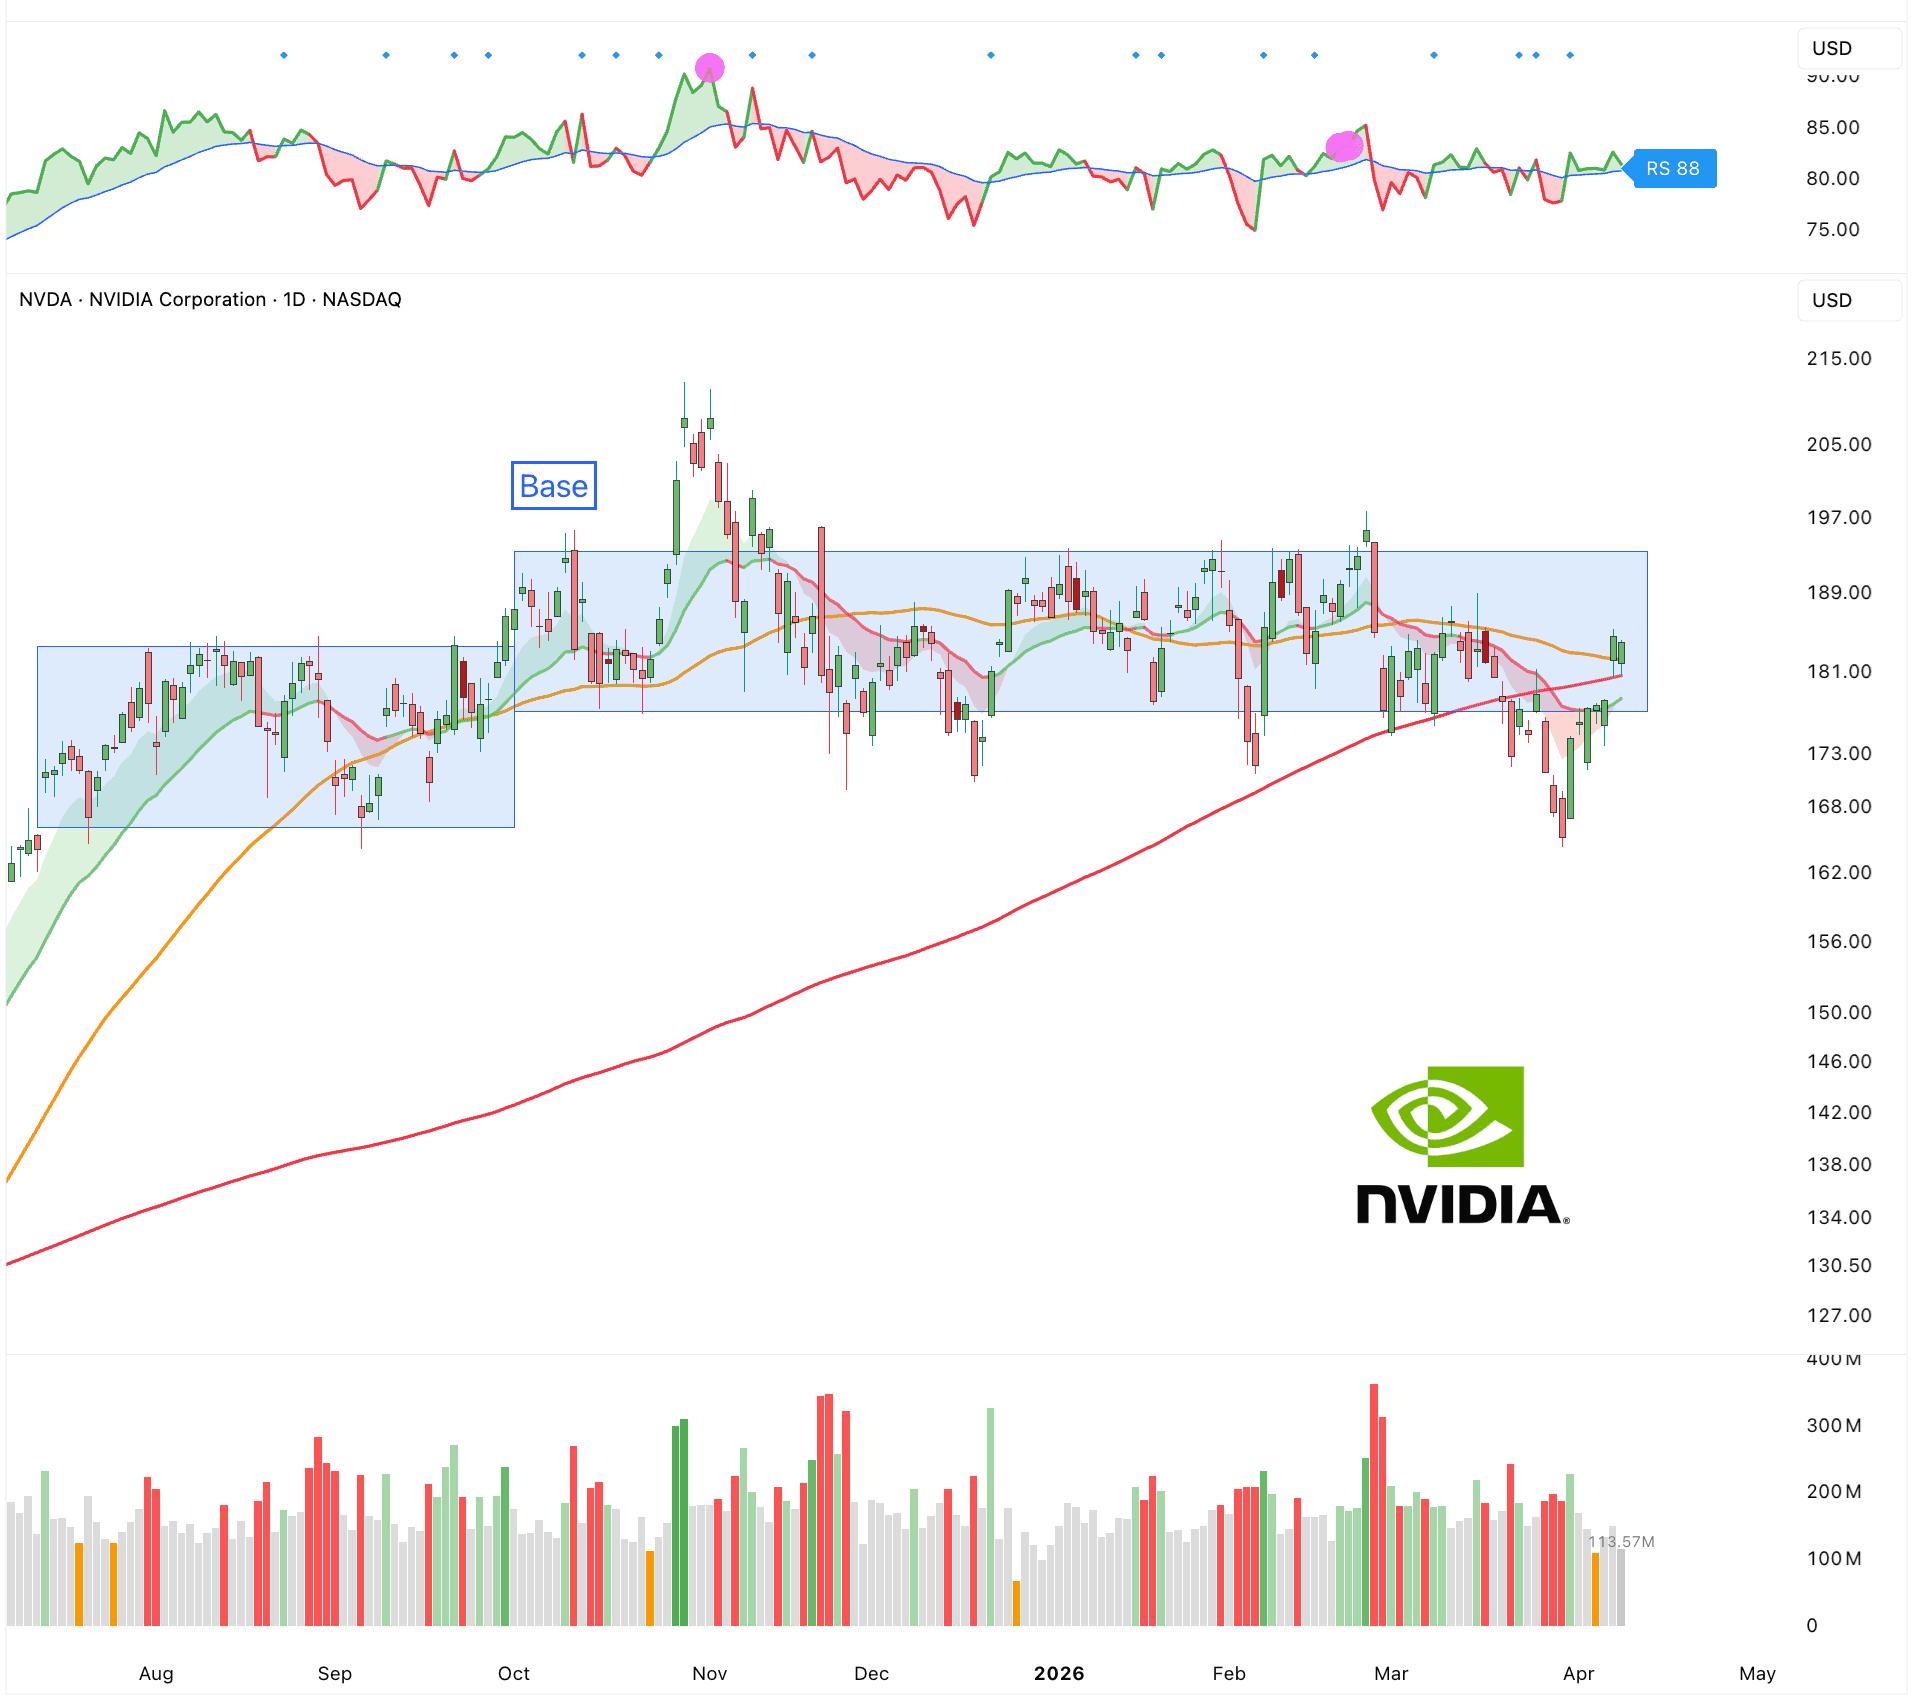
Nvidia ($NVDA)
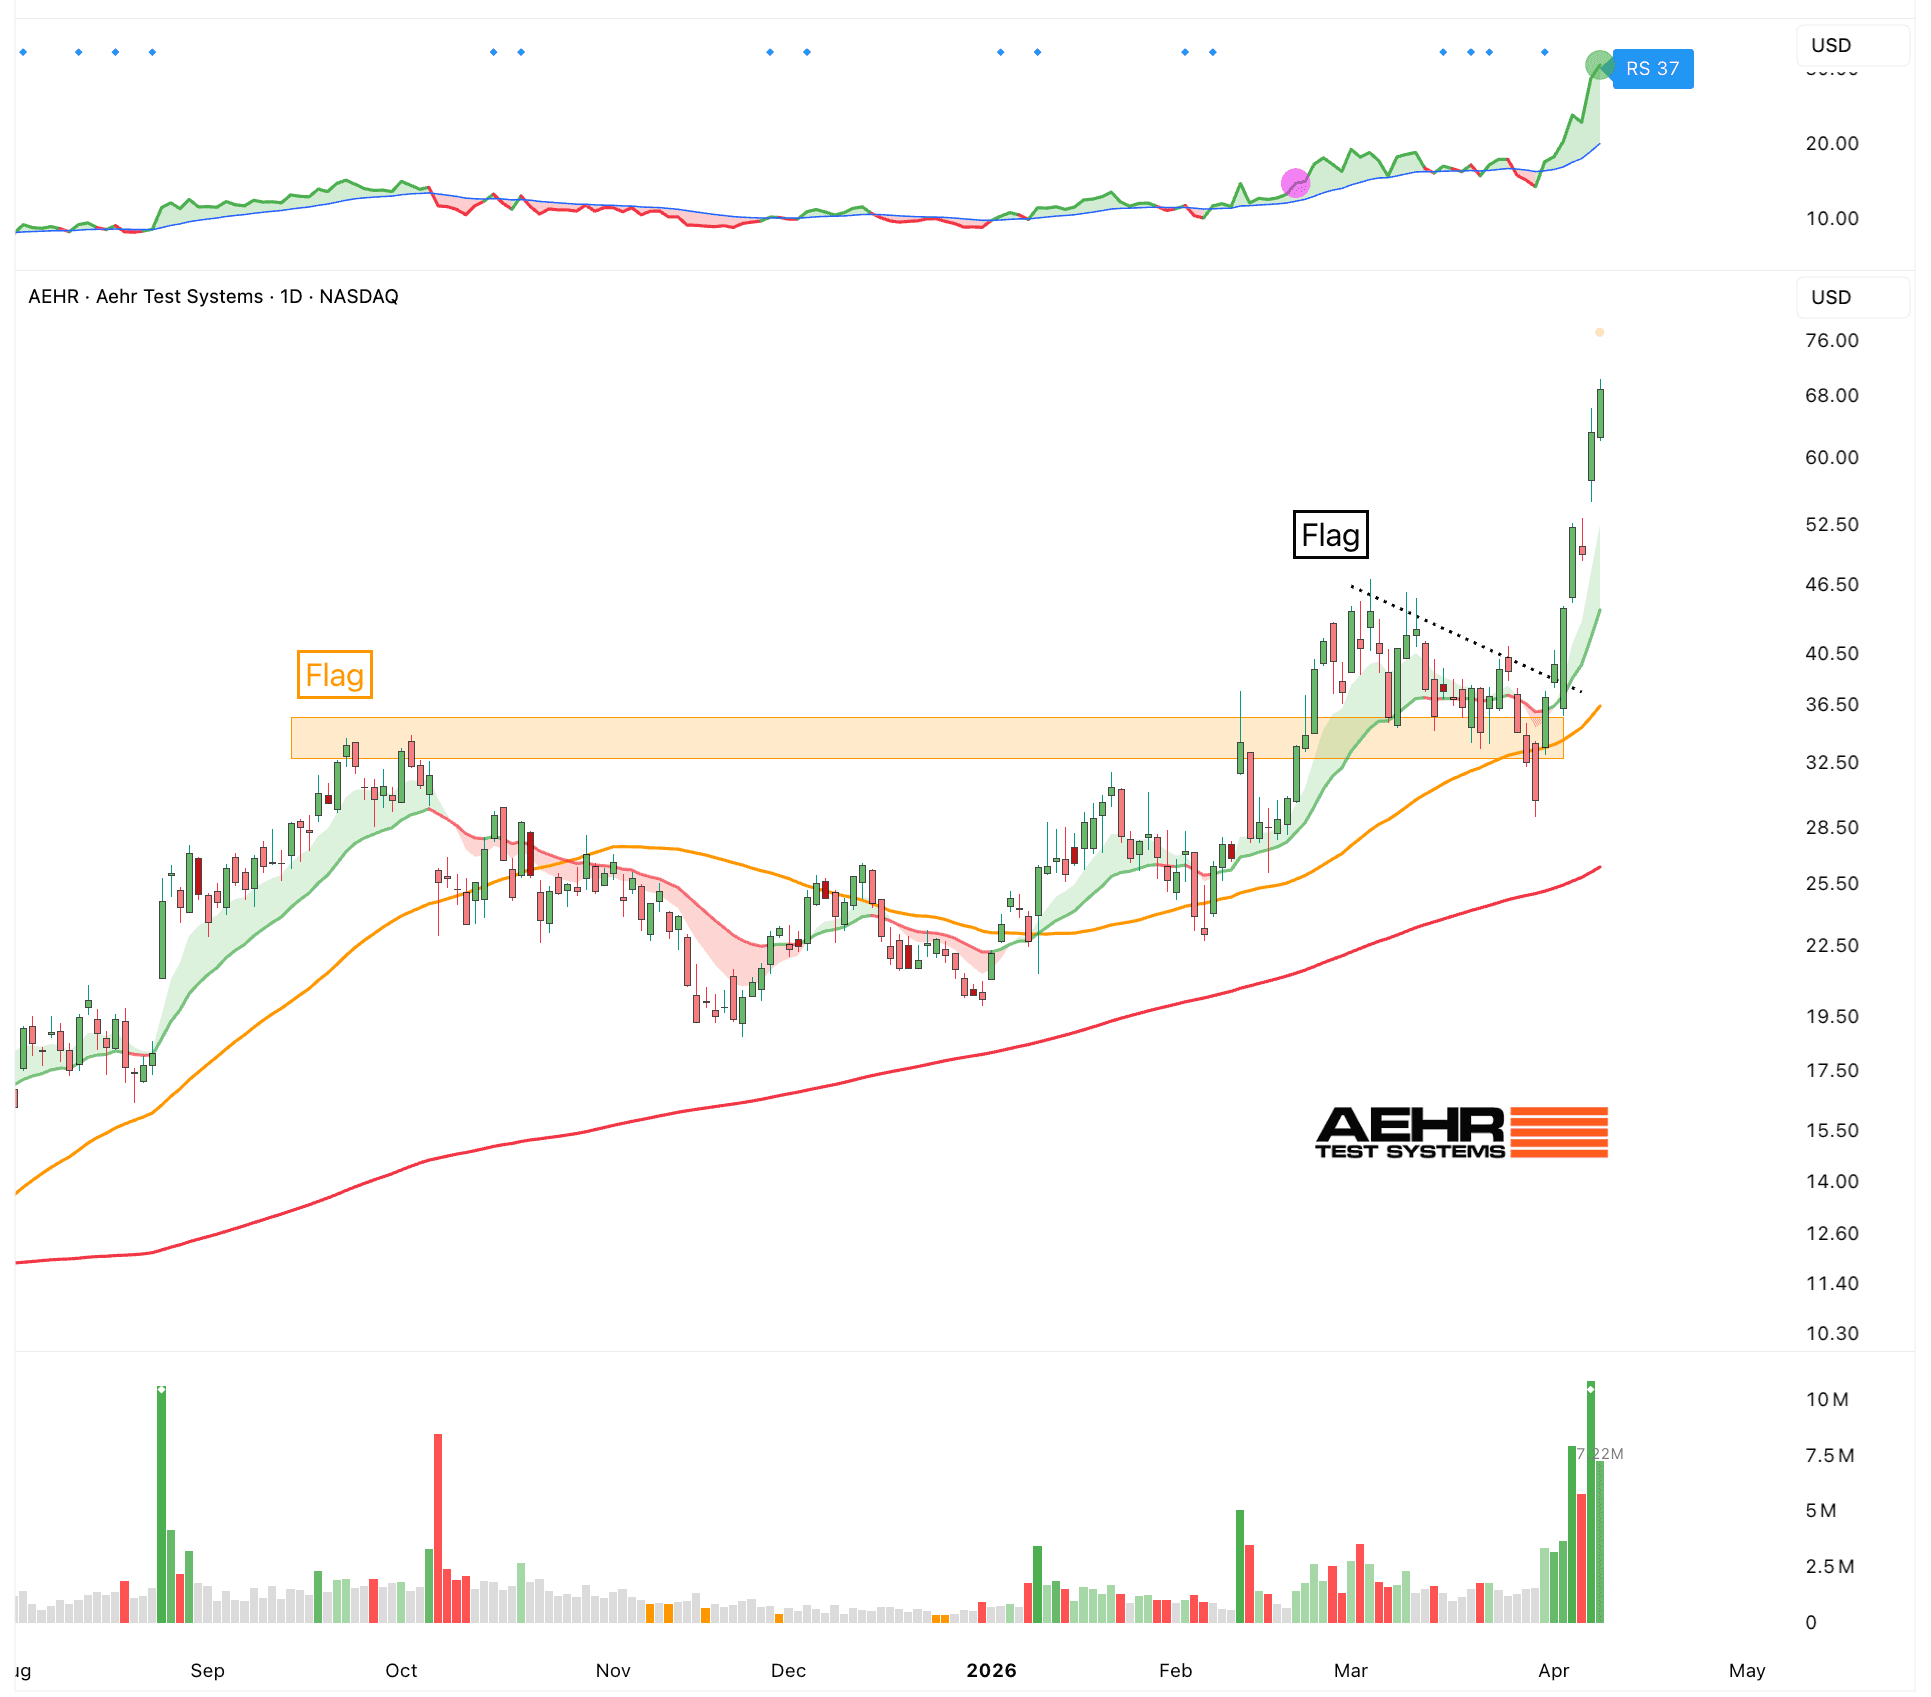
Aehr Test Systems ($AEHR)
Energy
Energy is the core input of computing. Every calculation, every AI model, every database query is just electricity being turned into work. No power means no compute. It is that simple. As workloads grow, especially with AI, the amount of energy needed explodes. Training one large AI model can use as much electricity as thousands of homes. So the limit is no longer just chips. It is also how much energy you can access and deliver reliably.
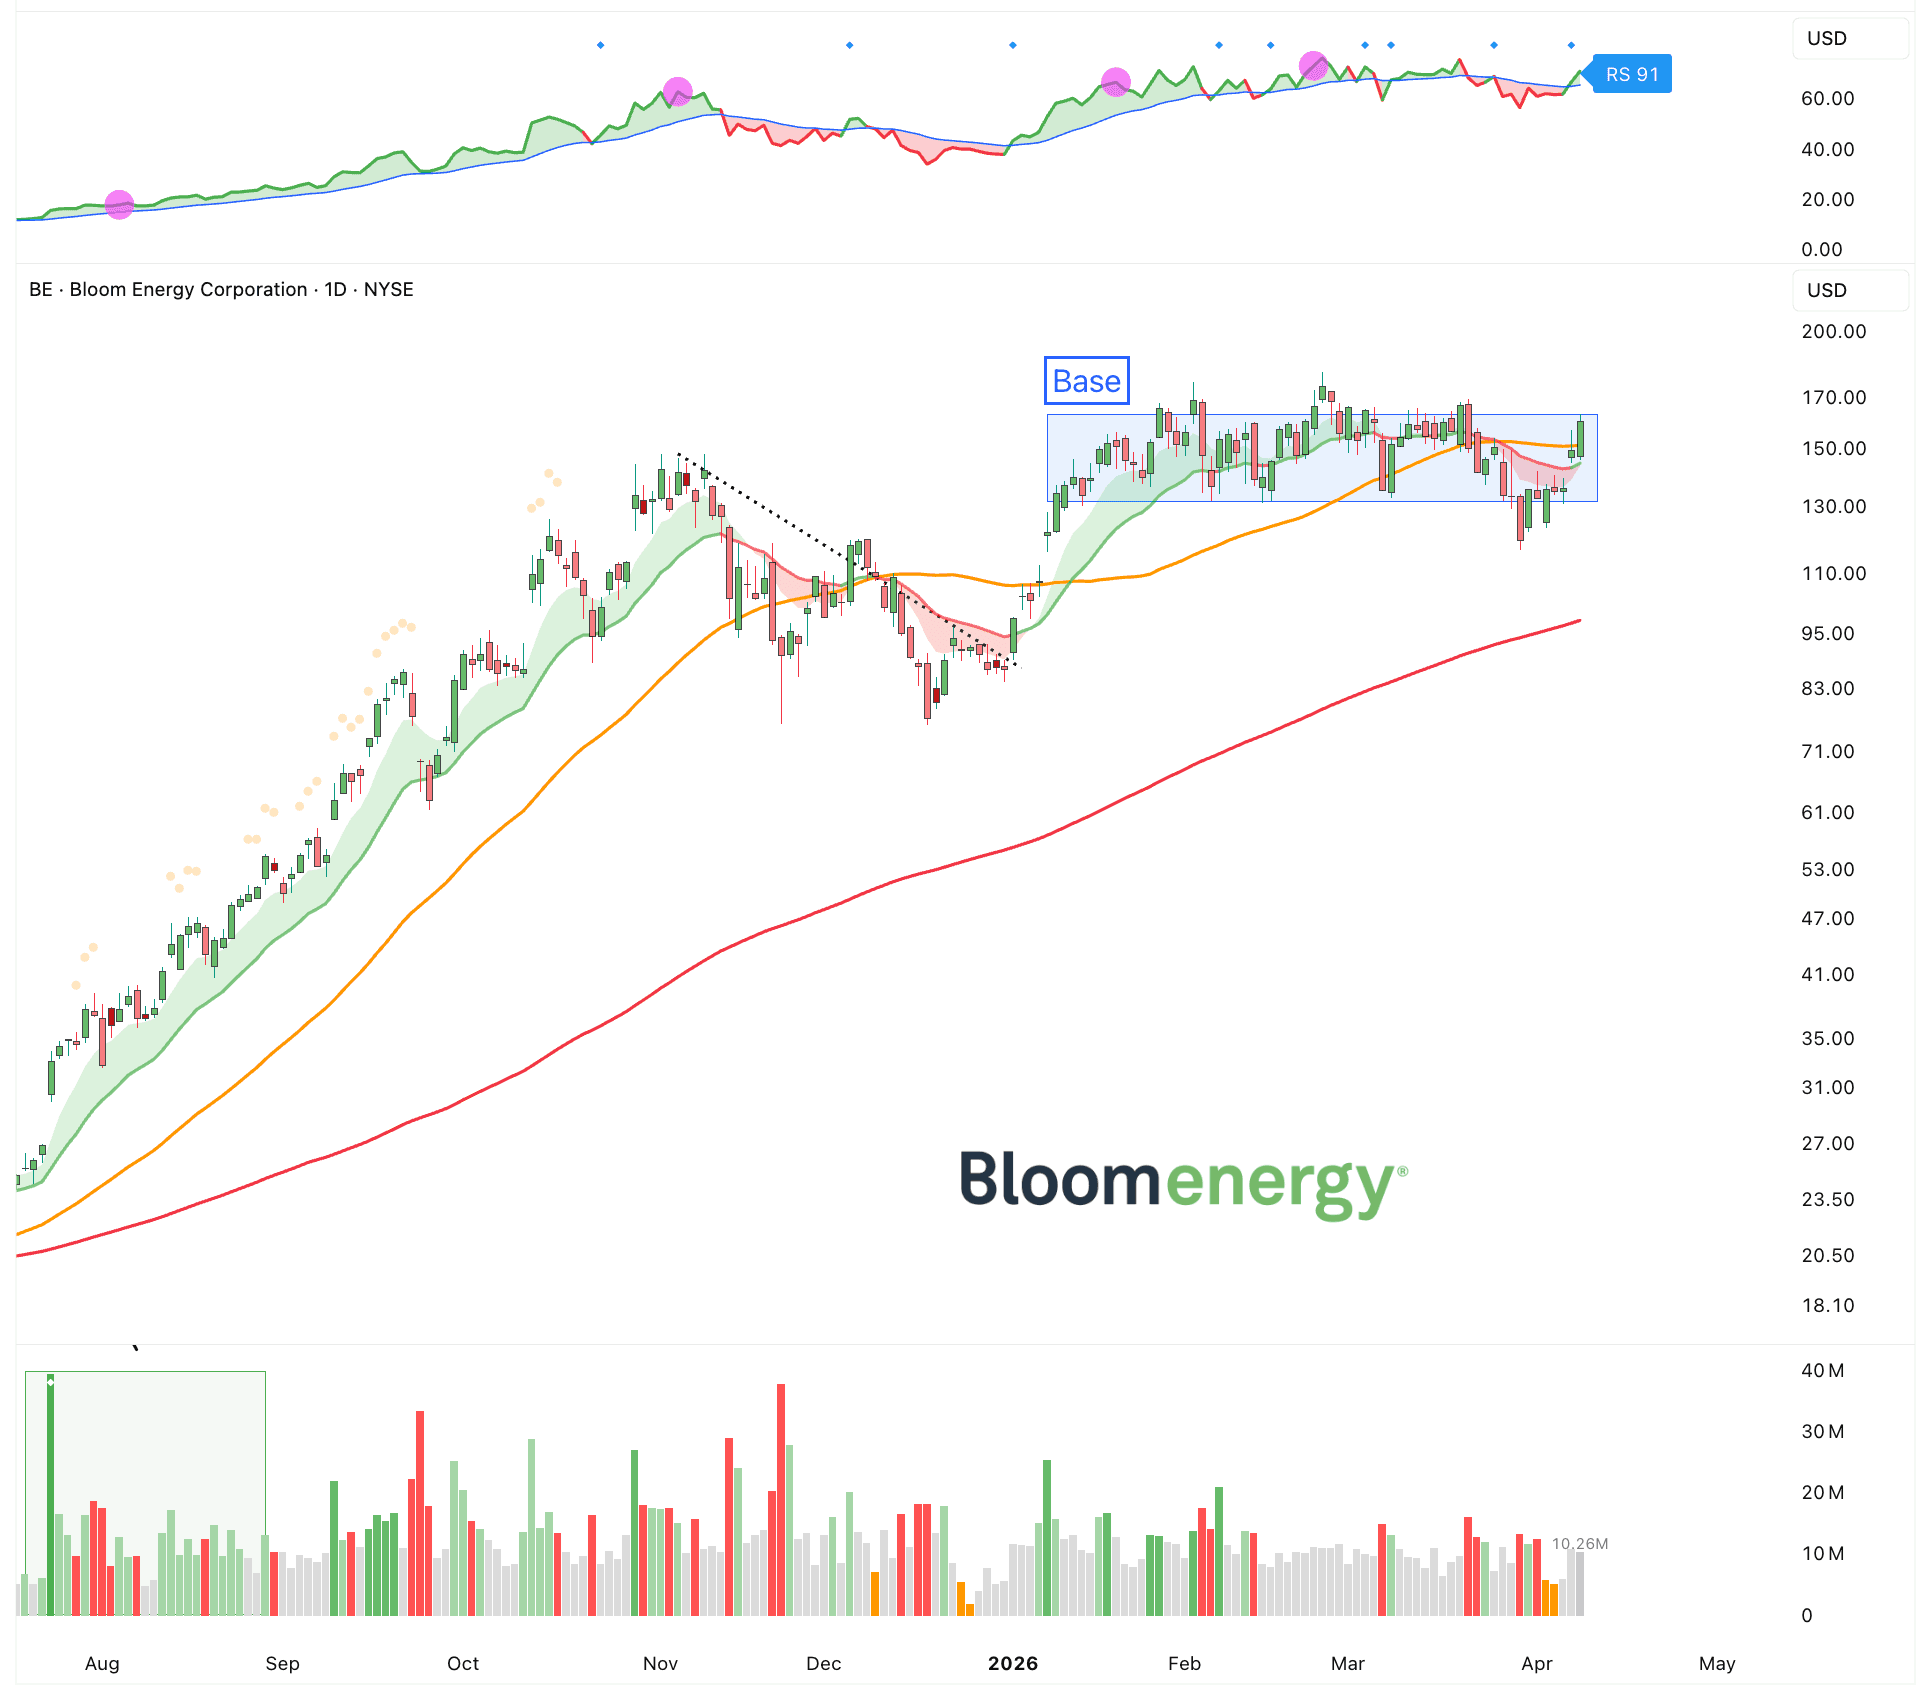
Bloom Energy ($BE)
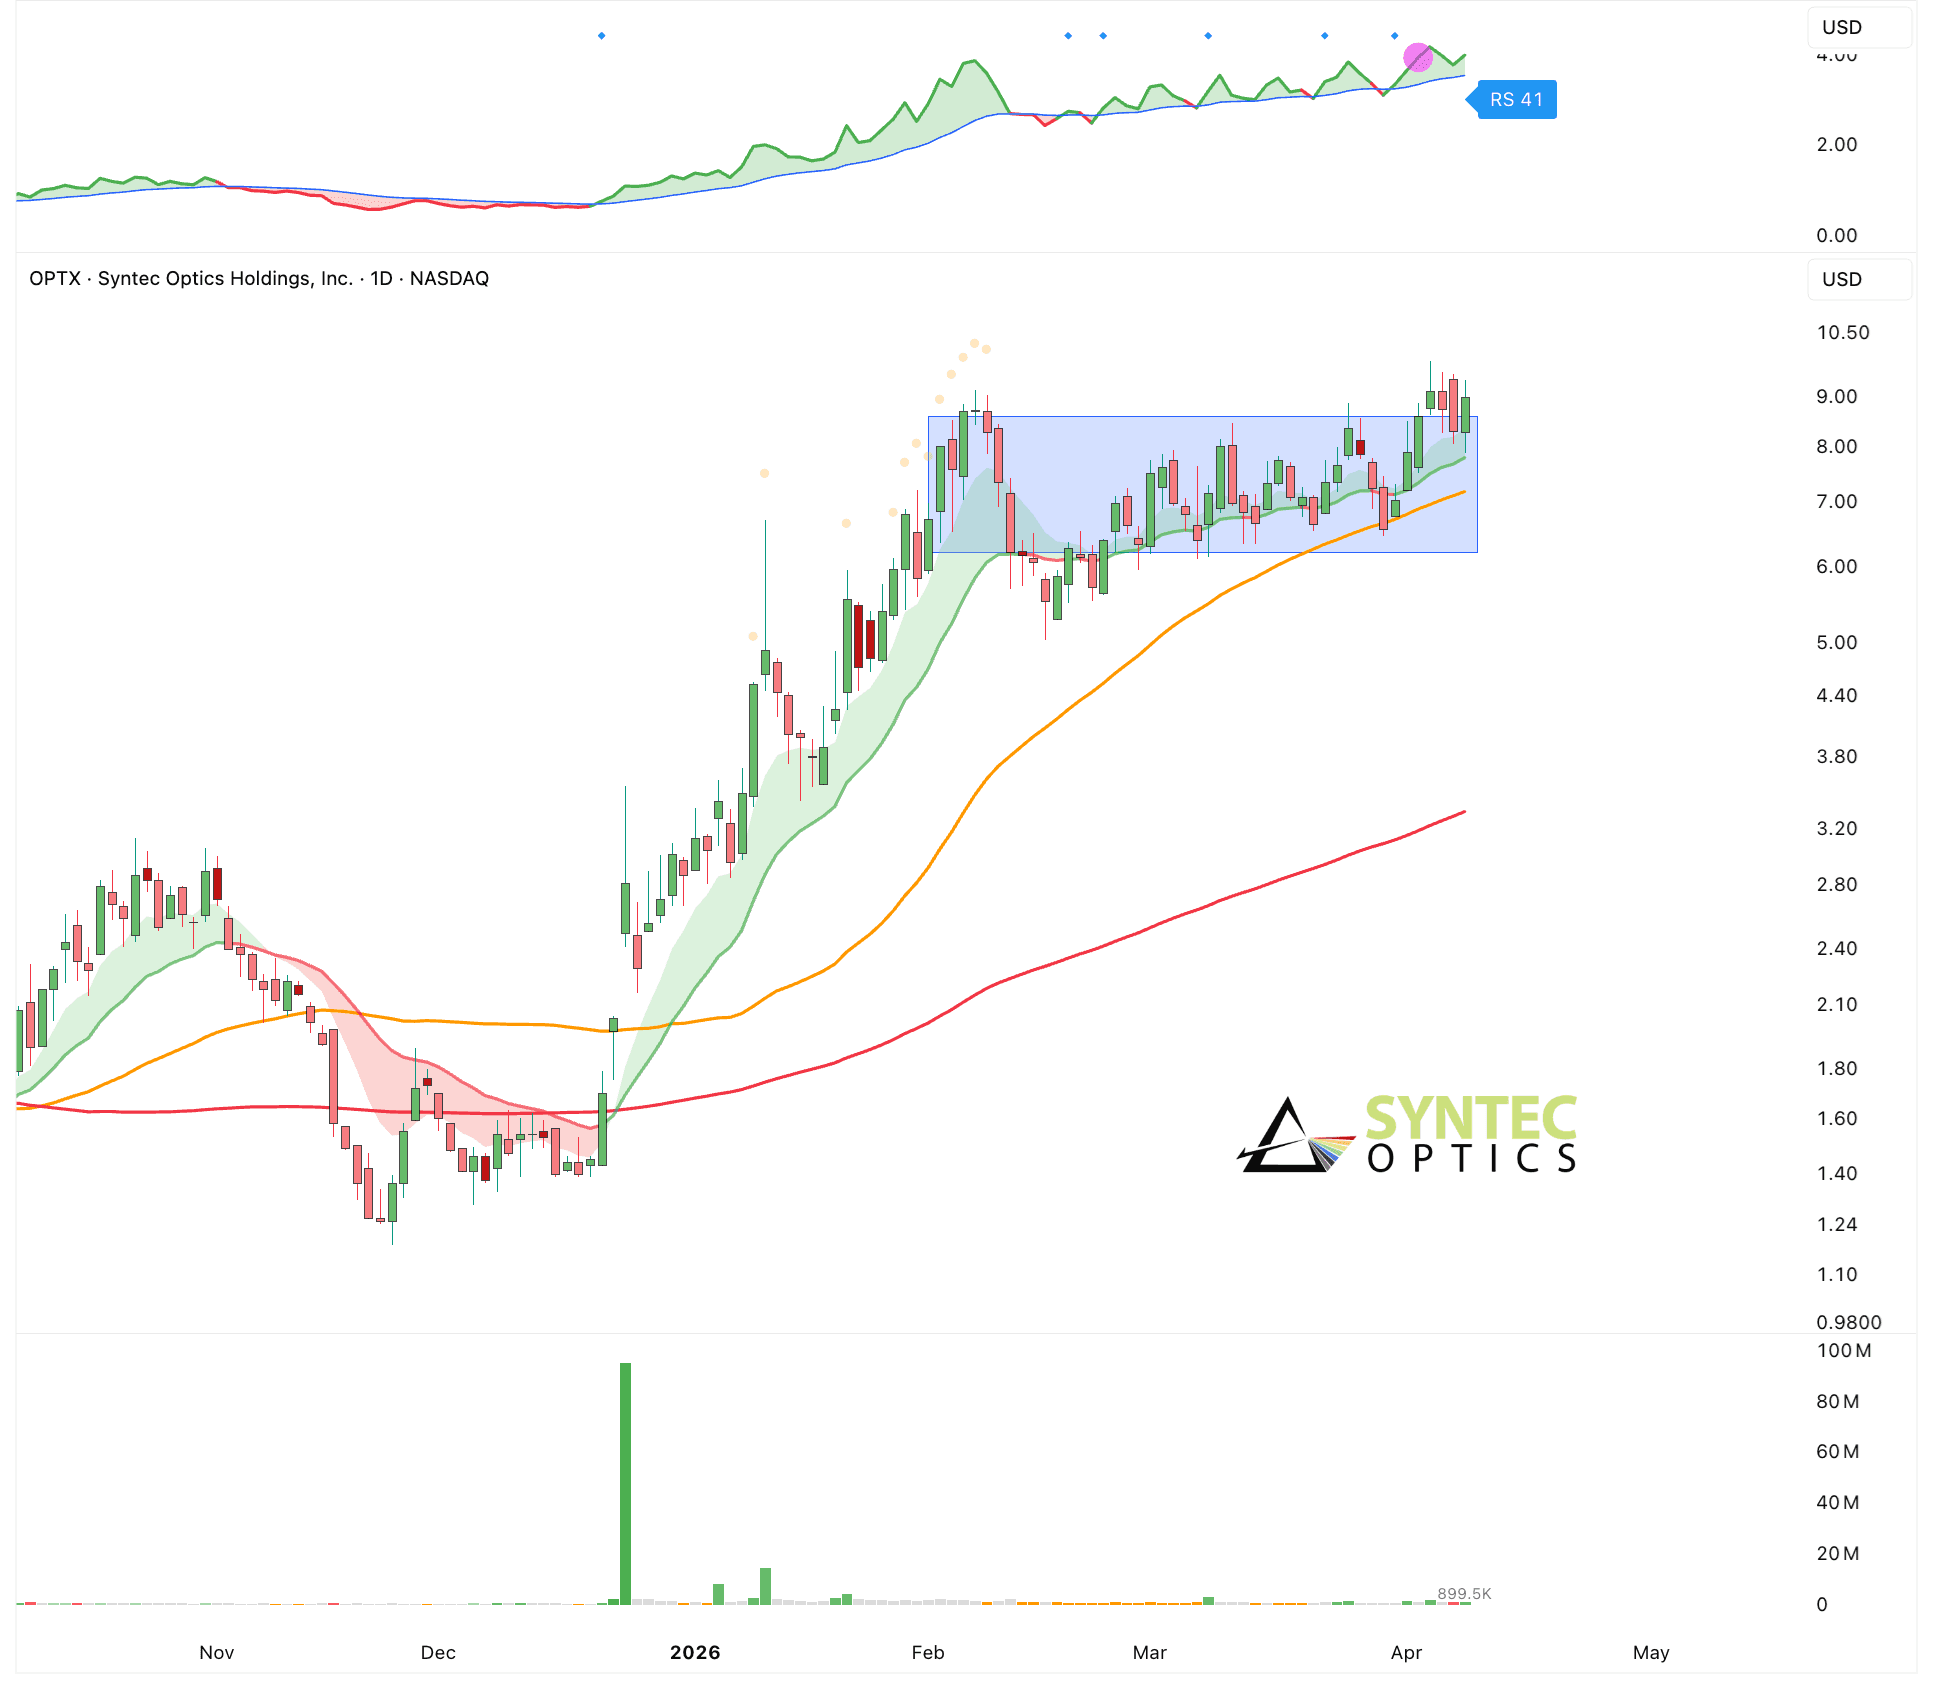
Photonics
Ais limited by how fast data can move. Inside data centers, chips need to talk to each other constantly. GPUs send massive amounts of data back and forth. Copper cables are hitting their limits. They get hot, lose signal over distance, and cannot scale well at higher speeds. Photonics fixes this by using light instead of electricity. Light moves faster, uses less energy per bit, and works better over longer distances and thus removing a major bottleneck.
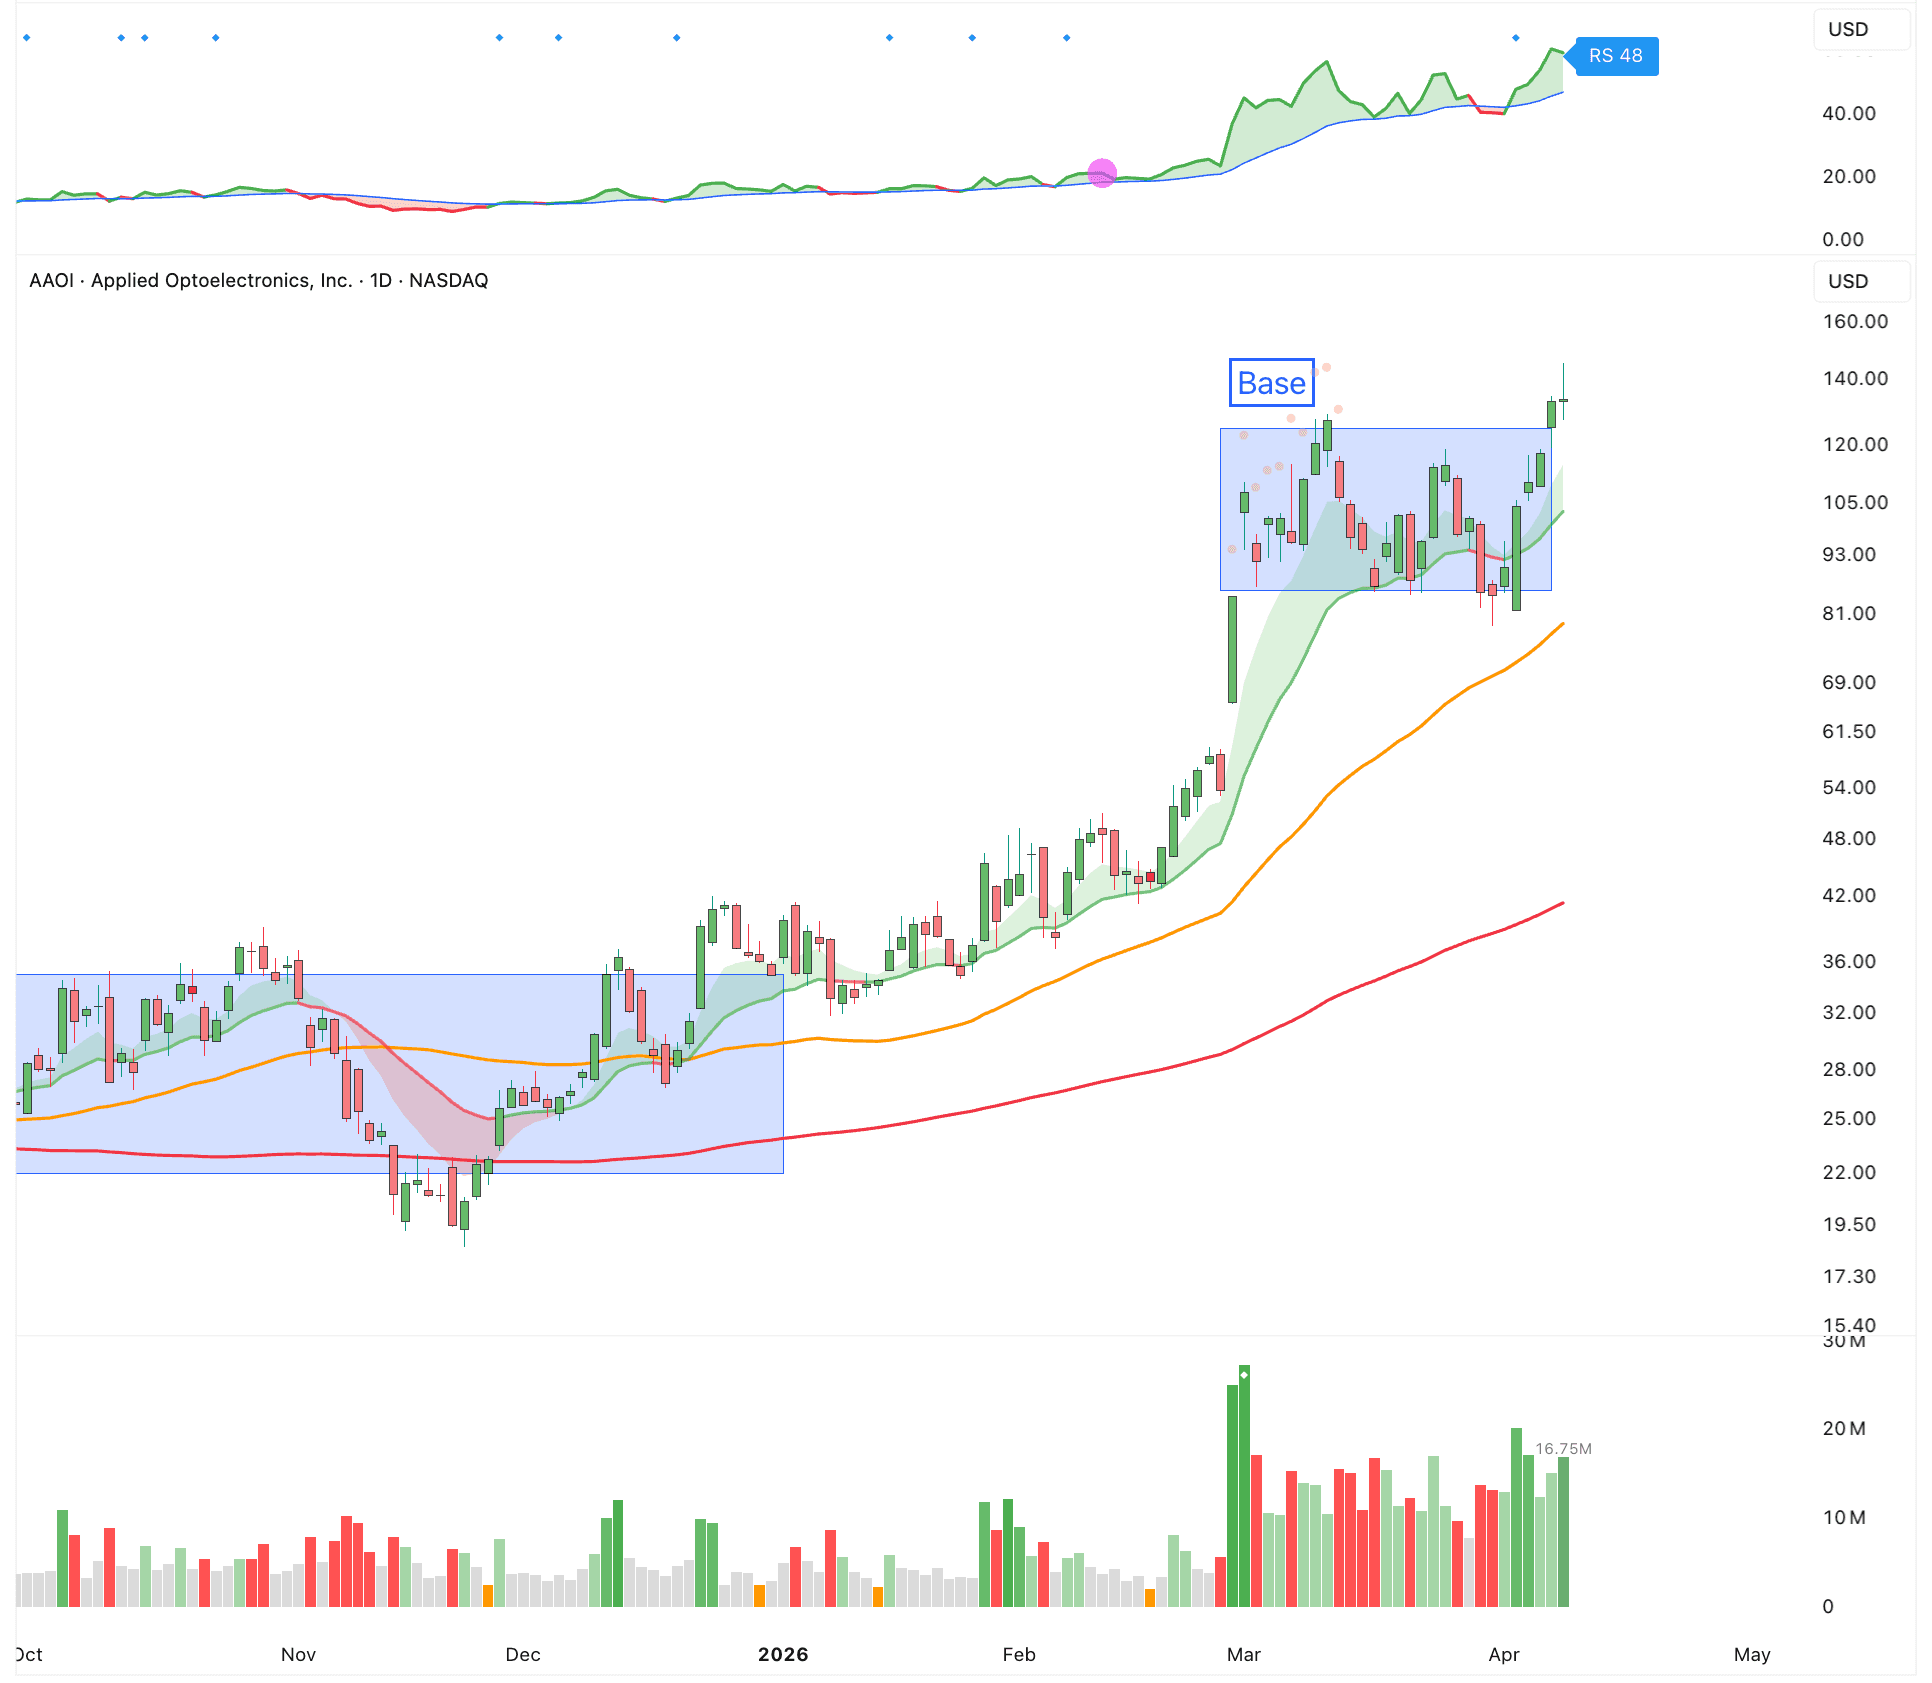
Applied Optoelectronics ($AAOI)
AXT Inc ($AXTI)
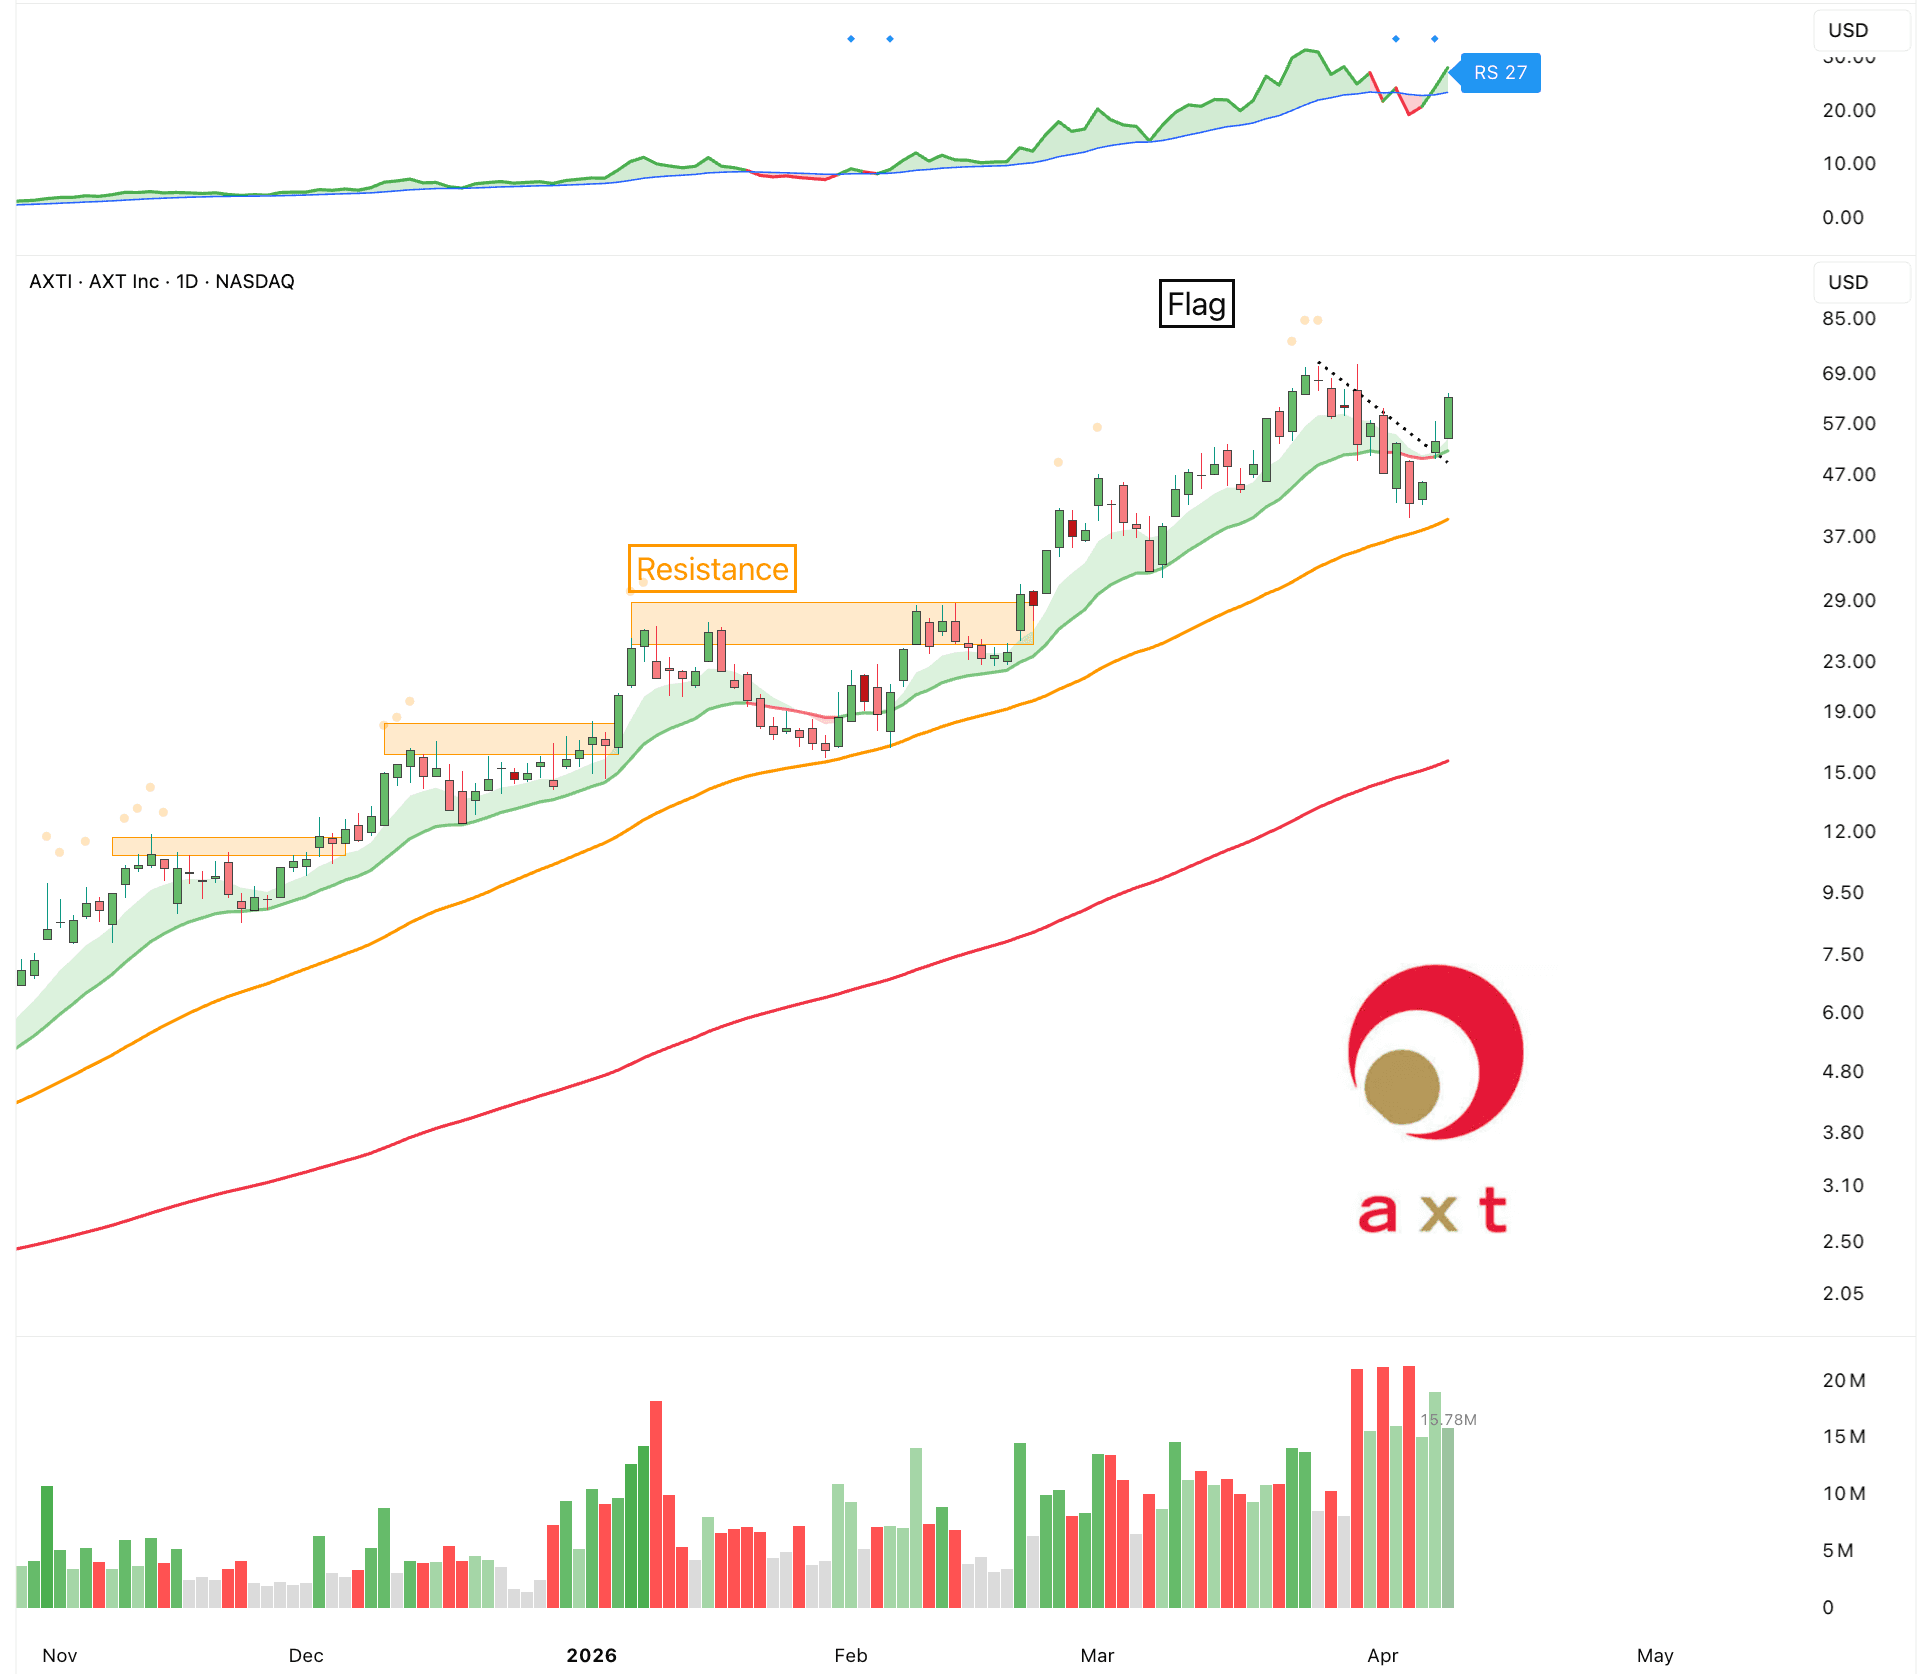
Coherent ($COHR)
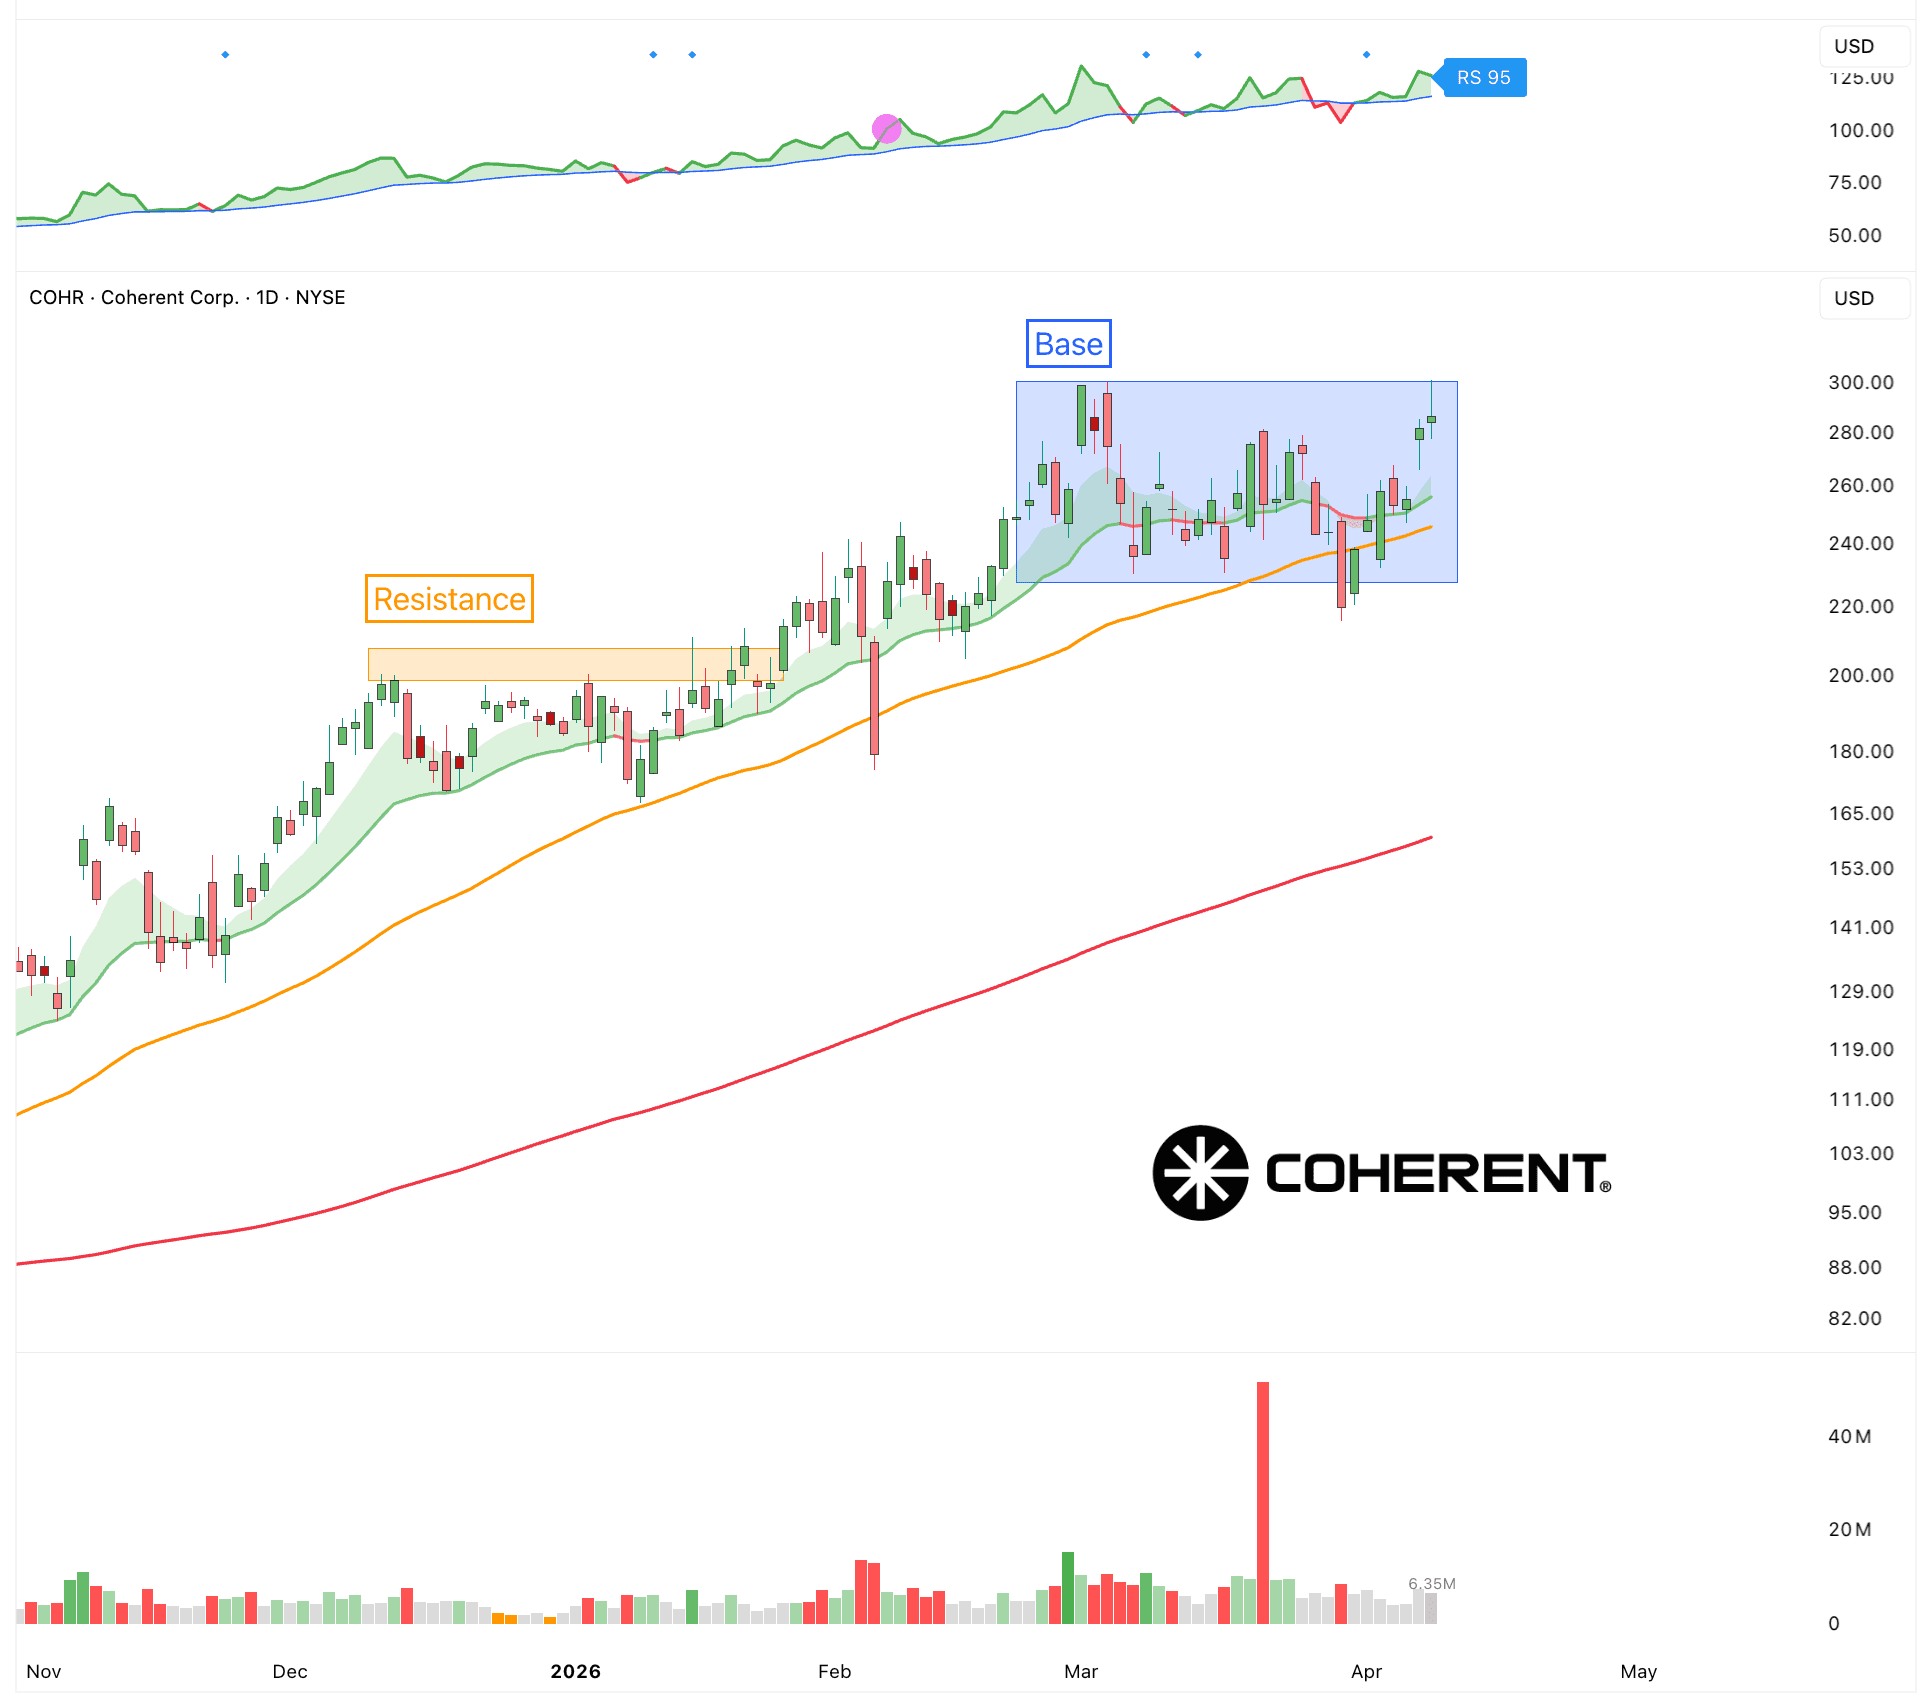
Syntec ($OPTX)
Lin
Market Update: Identifying The Market Bottom
Is this the bottom?
Buying a bottom is not the same as catching a falling knife. They are two very different things.
The best opportunities and strongest trends tend to come after major selloffs. On the other side of this one, whenever that may be, we’ll likely see a clean uptrend with plenty of opportunity.
But you need to survive the chop and messy price action long enough to capitalize.
When you try to spot a real bottom, you’re not looking for one signal. You’re looking for a combination of things coming together.
1. First, you want to see selling pressure slow down.
In a downtrend, every bounce gets sold fast. Stocks make lower highs, then break again. At a bottom, that starts to change. Selloffs get weaker. Prices stop making aggressive new lows. It feels like the market is “tired” of going down.
2. Second, you want to see some kind of base forming.
Instead of sharp moves down, price starts moving sideways. It chops around in a range. That’s actually a good sign. It means buyers and sellers are starting to balance out. The market is absorbing all the selling.
3. Third, watch how the market reacts to bad news.
This one is important.
In a weak market, bad news sends stocks straight down. At a bottom, bad news comes out… and nothing happens. Or the market even goes up. That tells you most of the fear is already priced in.
4. Fourth, look for early signs of strength.
Some stocks will start holding up better than others. They stop going down. They reclaim key levels. They become leaders before the market fully turns. That’s usually where the next winners come from.
5. Fifth, sentiment usually gets extreme.
Most people feel negative. News flow is bad. Positioning is light. It feels uncomfortable to buy anything. That’s often when markets are closer to a bottom than people think.
But you don’t need to call the exact bottom.
What you want is to see enough of these signs, and then start slowly leaning in. Small positions first. Then add more as the trend actually turns and confirms. If you can avoid the chop and most of the downtrend, then capitalize on the uptrend when it comes, the time on the sidelines will be well worth it.
That’s a lot, and of course you won’t always have all of those factors at once. But the more you can stack in your favor, the better your odds.
Investing is a game of probabilities. The goal is to put as many odds in your favor as possible.
Buying the exact bottom isn’t important, but recognizing when a bottom may be forming is. If you can spot it early, you can start increasing position sizes ahead of everyone else.
Because the real money is not made by catching the exact low.
It’s made by catching the move after the low.
Lin
Market Update: Patience
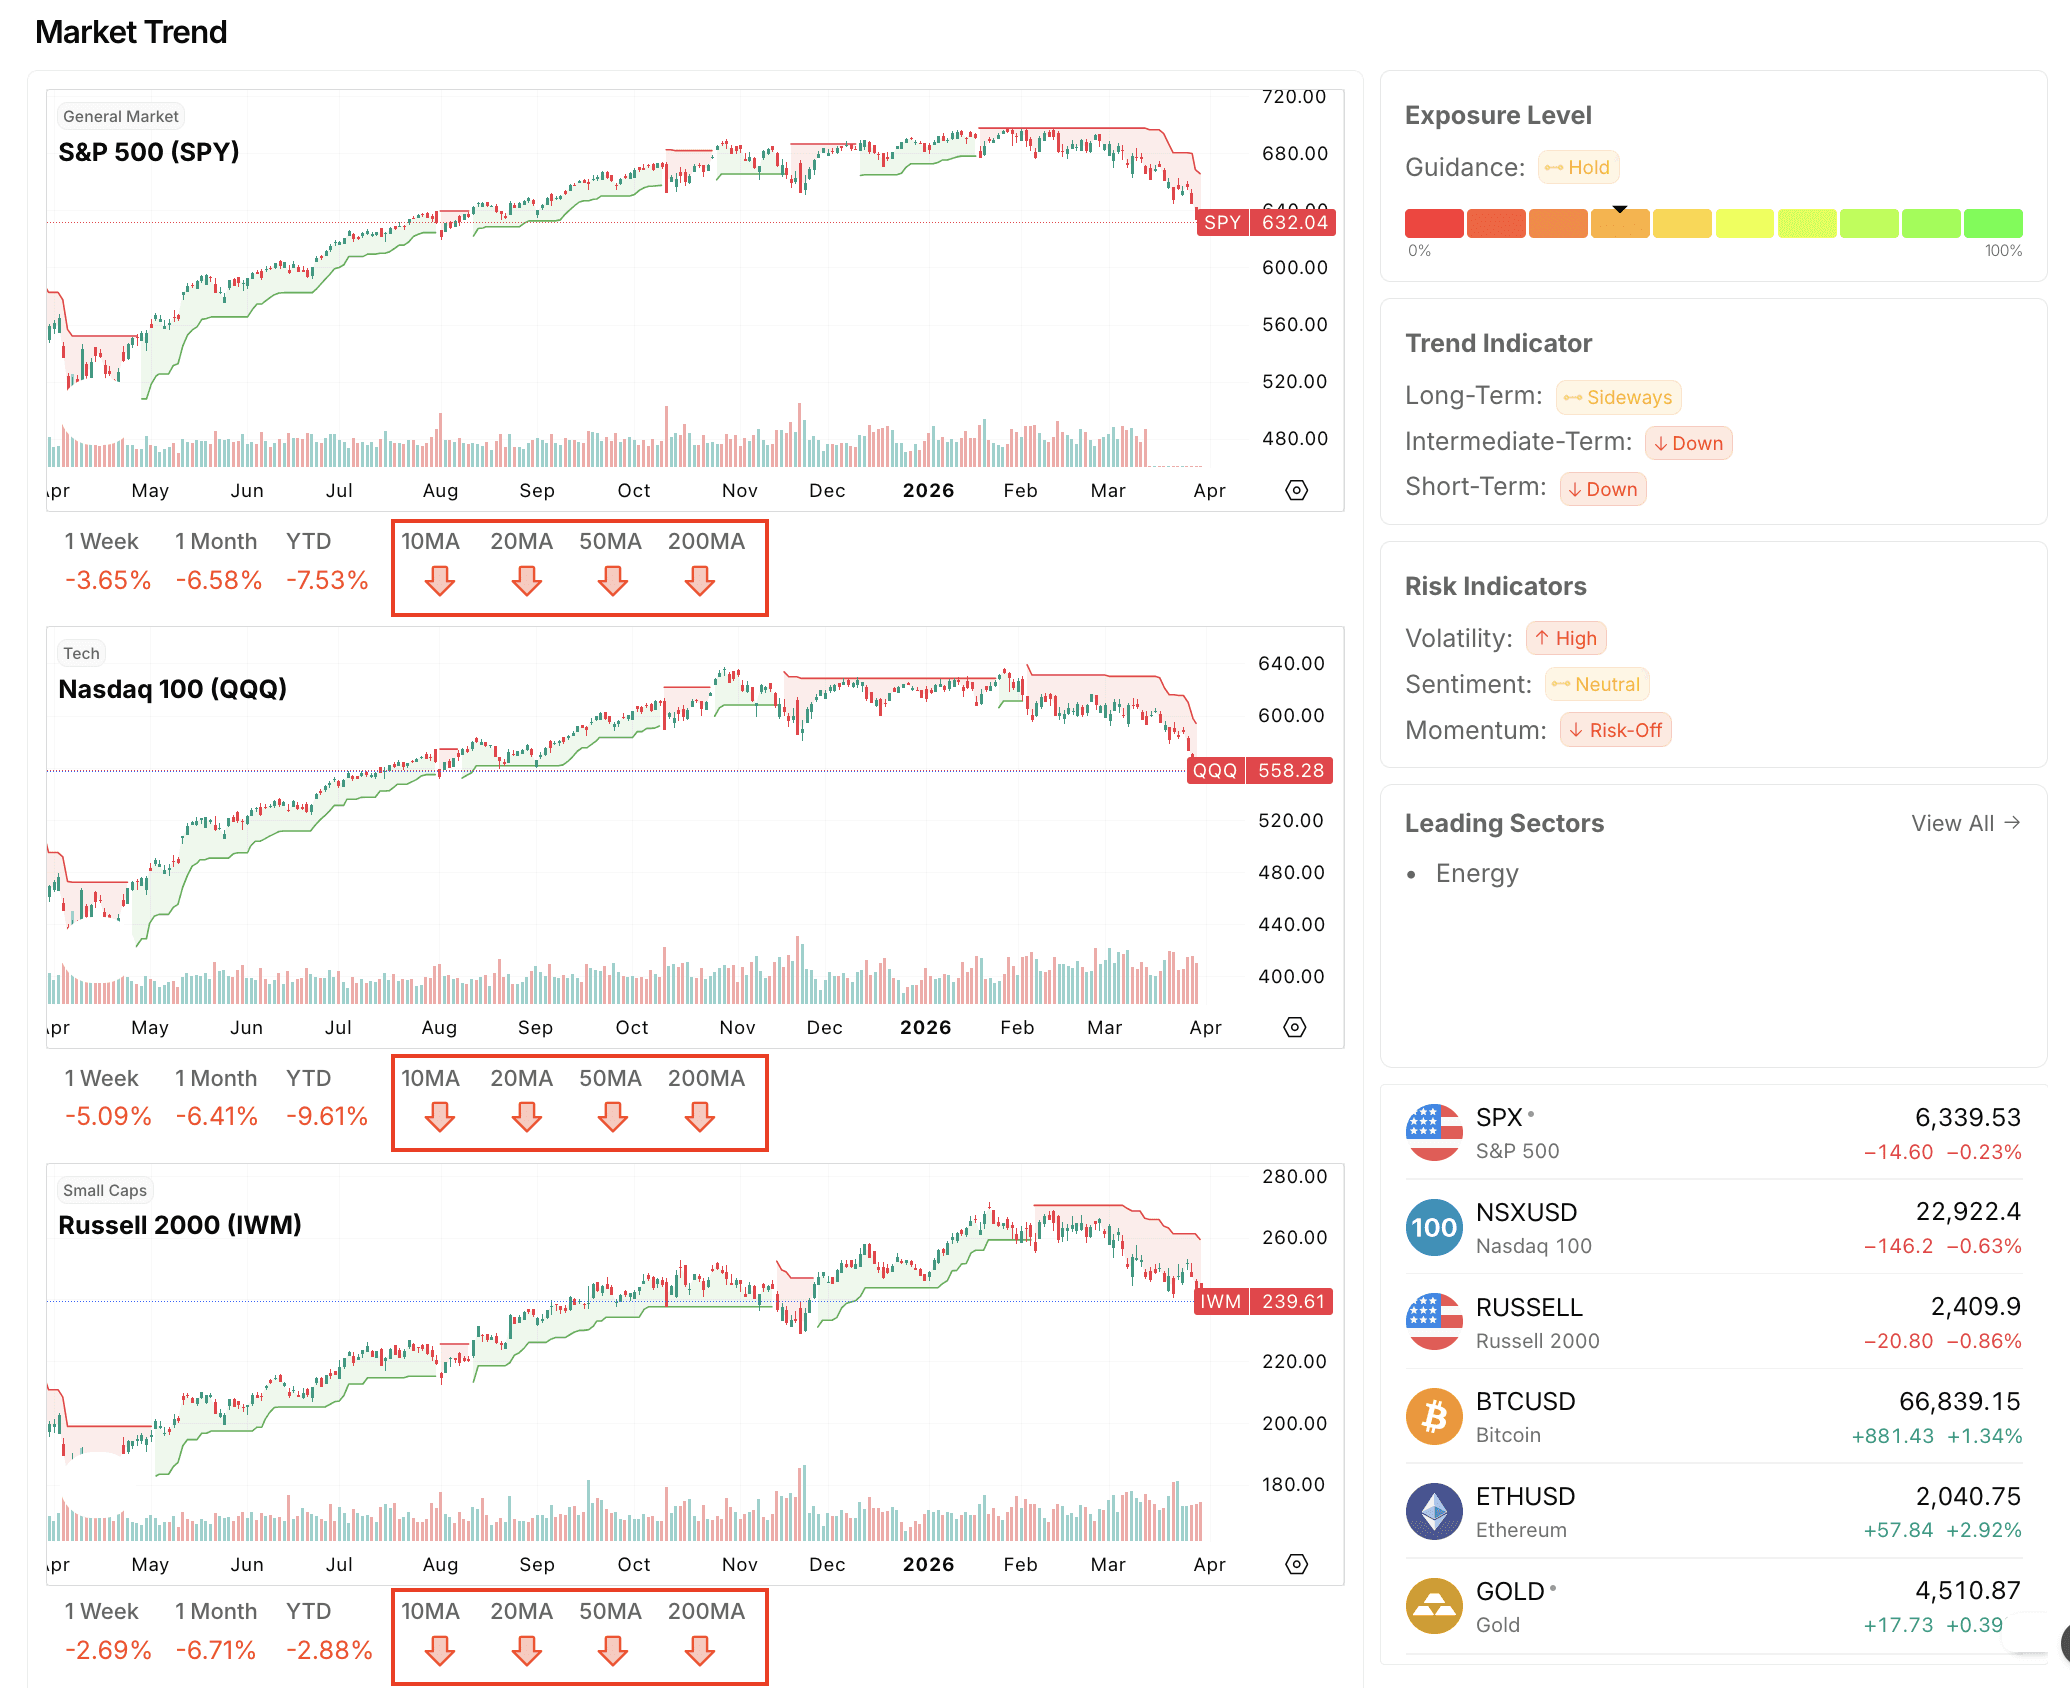
This is the first time since April that all the major indices are sitting below their 10, 20, 50, and 200 day moving averages. That’s an important detail to notice. It tells you the tone of the market changed.
If you look at the move since April it has been pretty much straight up. Now we finally see real weakness across the board. That alone is a good reason to be a bit more cautious.
You can avoid a lot of unnecessary stress if you wait for things to settle. The first sign of stability is the market reclaiming the 200 day. That one level filters out a lot of noise. If it manages to do that soon the bottom is likely in for this correction. But the longer it lives below it the risk is getting higher. Getting back above all of them would be ideal, but the 200 day is the key one to watch.
Until that happens it makes sense to stay a little more careful.
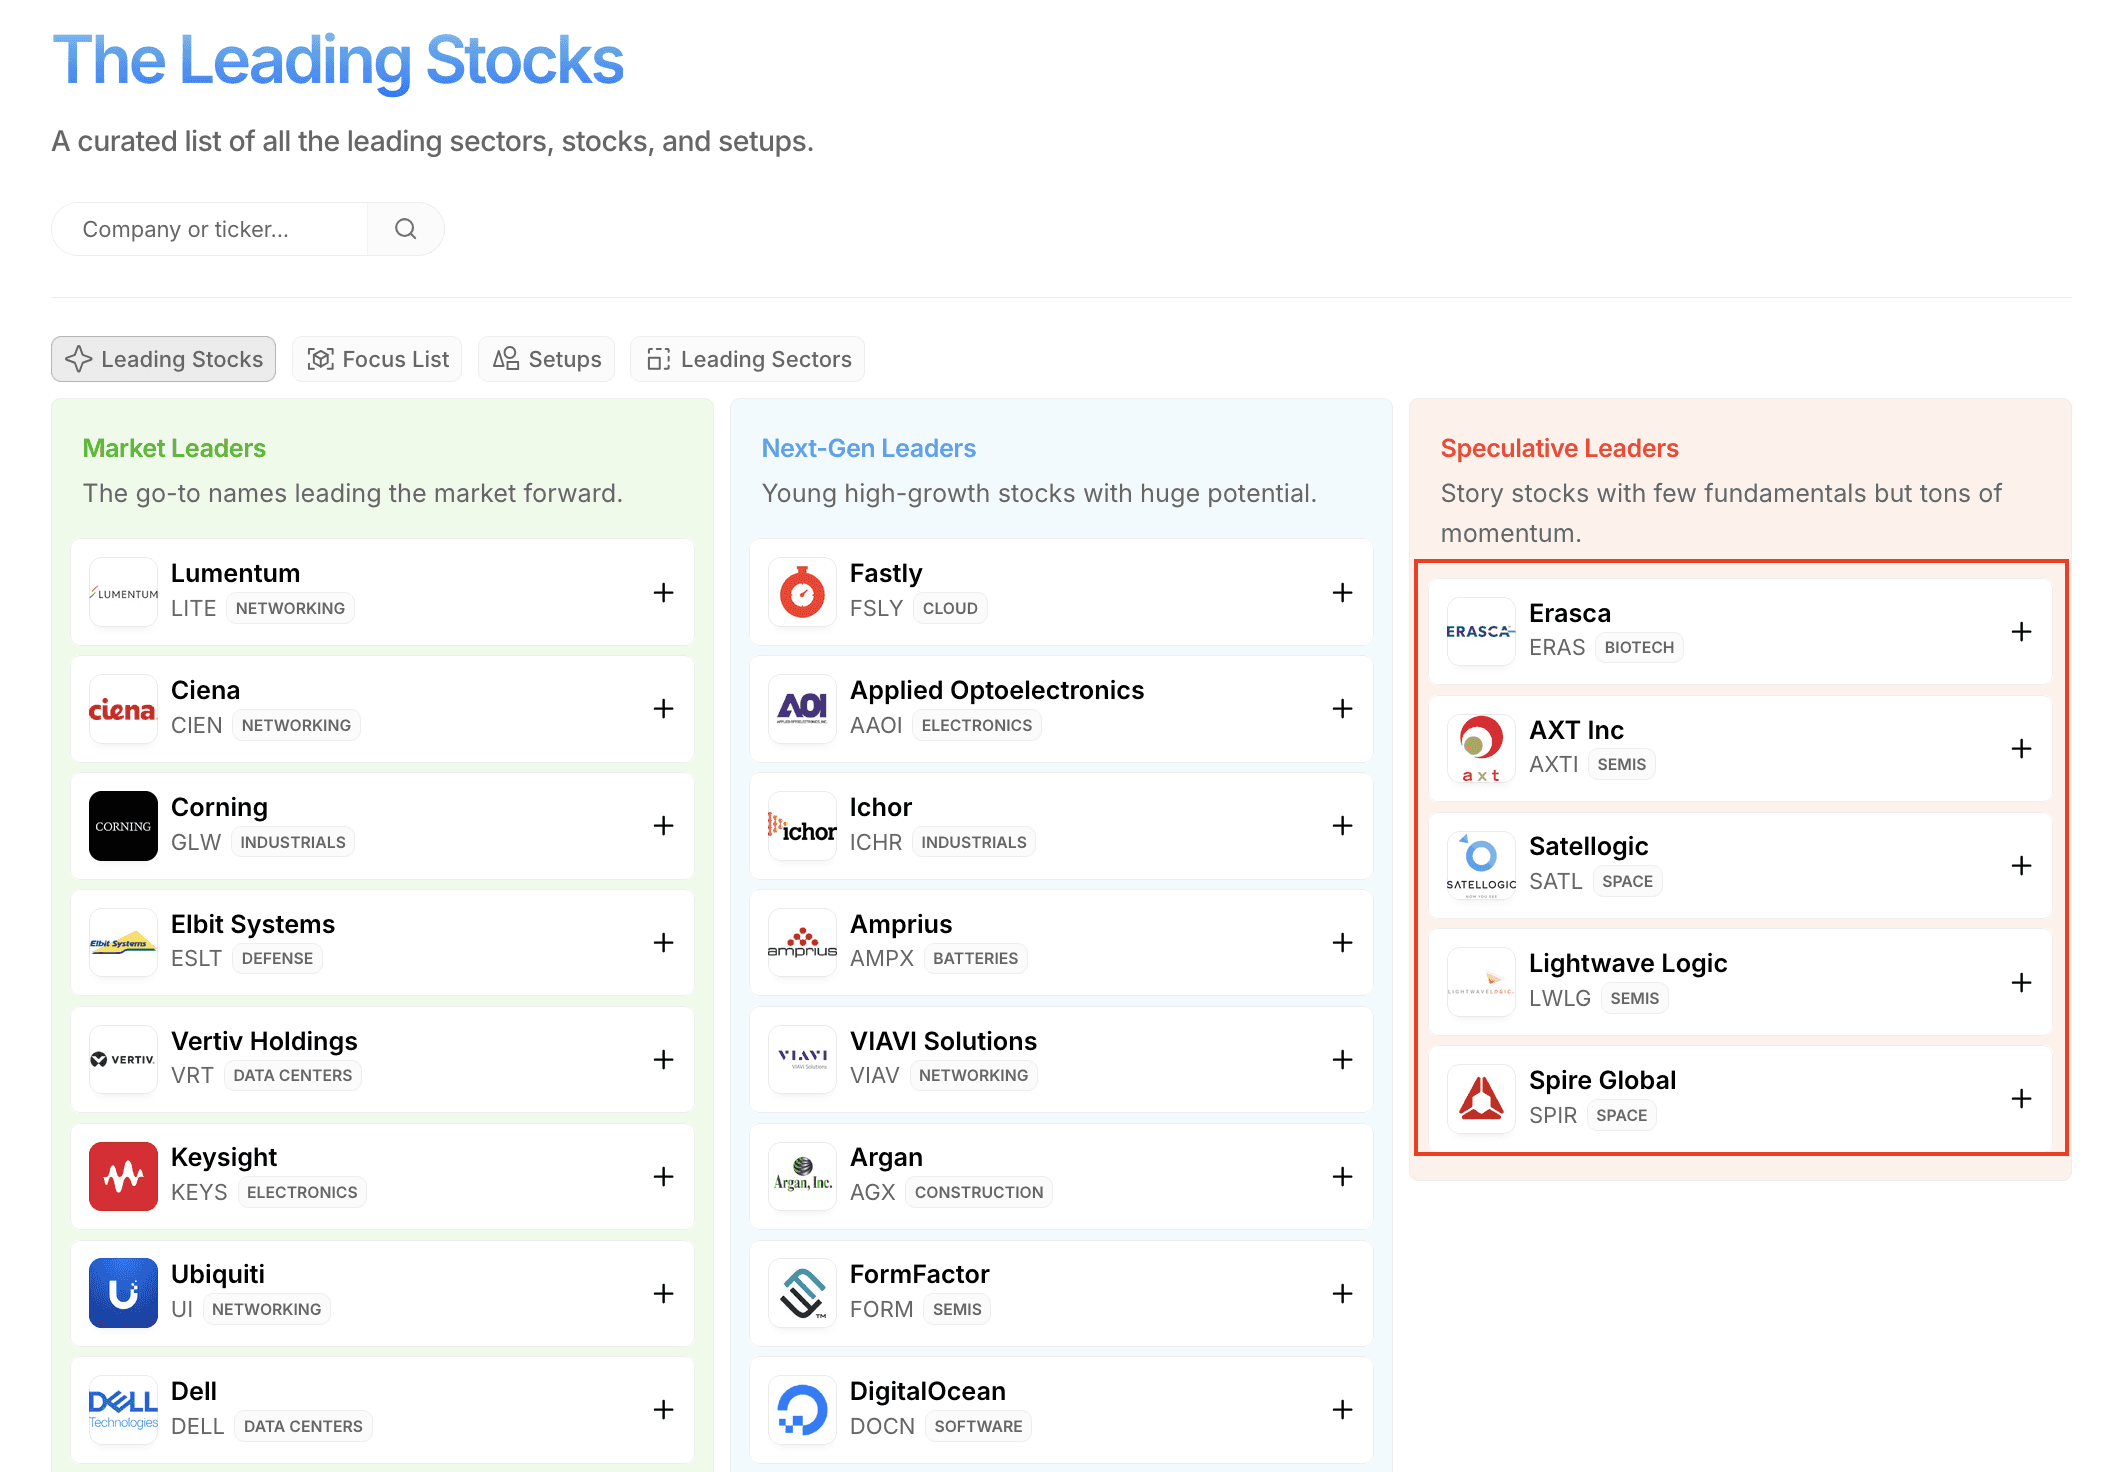
On top of that there is almost no interest in speculative names right now. There is basically zero appetite for risk. Just a few weeks ago this list was full of names. Now it is down to a handful. It has been a complete washout for momentum names.
The only positive thing is that there are still a few leaders holding up. But even that group is getting smaller and smaller. It shows how selective the market has become.
All of this basically tells you to stay patient.
There is no reason to guess what comes next. When things turn it will be clear. Once the market improves you will get a ton of opportunities. You will almost feel overwhelmed because everything starts working at the same time. But that day is not here yet. Until then it is critical to keep your risk exposure limited and have plenty of cash once it’s here. So, that continues to be main priority right now.
It is so much easier to make progress when the market is in a healthy environment. You just need to be patient enough and wait for that window to open again.
Here are a few signs to watch for:
• A clear catalyst
• A strong and steady uptrend
• Major indices trading back above key moving averages
• Several themes working at the same time
• Big gap ups on strong volume
• Gaps holding instead of fading
• Follow through days
• Little volatility
• Pullbacks on low volume
• Pullbacks getting bought quickly
• Strong closes near the highs
• Positions starting to work almost right away
• You feel like there are almost too many opportunities
• Your equity curve is moving up steadily
These periods don’t come often. When you spot one you have to lean in and be aggressive because that is when you make real progress.
This is not that kind of environment right now.
The next window of opportunity will come. It always does. And when it does you want to be ready to take advantage of it.
Lin
A Game of Probabilities II
Investing often feels like walking into a casino where the games are still being invented. The tables are there. People are placing chips. But nobody really knows the rules yet. Everyone is trying to figure out which table will become the big one. AI, space, quantum, crypto, energy, whatever the next wave is. Investors walk around looking at all these tables asking the same question. Is this the game I should play?
The hard part is that investing is never just about fundamentals, charts, the company, or the technology. It is also about what everyone else believes will happen. Markets are basically a giant psychology machine. Prices move because of expectations. A stock goes up because investors think other investors will want it tomorrow.
That creates a strange situation where the future depends a lot on what people think the future will be.
There is a famous example that explains this well. It is called the El Farol problem. Imagine there is a bar that is fun only if fewer than 60 people show up. If it gets too crowded it becomes miserable. Now imagine 100 people deciding every week if they should go. Everyone is trying to guess how many others will go.
If people expect the bar to be crowded, they stay home. But if everyone stays home, the bar ends up empty and it actually would have been great to go. On the other hand, if everyone expects the bar to be quiet, they all go and it becomes overcrowded. The prediction itself changes the outcome.
The stock market works a lot like that.
Investors buy stocks based on what they think other investors will do. Companies build factories based on what they think competitors will build. If everyone believes a sector will be huge, money floods in and valuations explode. If everyone becomes scared, money rushes out and prices collapse.
Expectations drive behavior. And behavior shapes the outcome. What people believe about the future often helps create that future. That idea is called reflexivity.
Think about optimism in markets. When investors believe the future will be good, they start acting differently. They invest more money. Companies raise capital easily. Startups get funded. Businesses hire more people. New factories get built. More money flows into research and innovation.
That activity creates real growth.
So the original optimism was not just a prediction. It actually helped cause the outcome. You can see this in almost every big economic boom.
This becomes very clear during big technology waves.
When investors believe a new technology will change the world, money starts pouring into the space. Venture capital is everywhere. Public markets reward the companies building the technology. Startups suddenly have access to cheap capital. Engineers get hired everywhere. Infrastructure gets built.
Progress starts happening faster than anyone expected.
The interesting part is that the investment itself helps make the story come true. More money means more research. More engineers. More experiments. More companies trying new ideas. The belief attracts capital. And the capital accelerates the technology.
In a strange way, the belief helps create the reality.
But reflexivity works both ways.
When optimism becomes too strong, expectations run far ahead of what is possible in the short term. Money floods into weaker companies. Projects get funded that probably should not exist. Valuations stretch far beyond fundamentals.
For a while it still works because the momentum feeds on itself. Prices go up, which attracts more money, which pushes prices even higher. But eventually reality catches up. Growth slows. Some projects fail. Capital dries up. And the feedback loop starts working in reverse.
That is why markets overshoot on both sides.
They go much higher than seems reasonable during the boom and much lower than seems justified during the bust.
This is also why the future in markets always feels uncertain. Nobody knows exactly which companies will win. Even the smartest investors are just forming probabilities in their head. They look at trends, technology, leadership, demand, and then place bets.
Think about the early days of the internet. Or smartphones. Or cloud computing. In the beginning nobody knew exactly which companies would dominate. Many looked promising. Many failed.
The investors who made the most money were not the ones who had perfect information. They were the ones willing to place smart bets early and adjust along the way.
The same thing happens in every cycle.
Right now investors are doing it with AI, robotics, energy, and other big themes. Everyone is trying to figure out who the real winners will be. But the truth is nobody knows for sure. The market is still searching for the answer.
That is why waiting for perfect clarity rarely works in investing.
By the time everything becomes obvious, the big move has already happened. The winners have already run. The opportunity was earlier, when things still looked messy and uncertain.
Good investors understand this. They know they are operating in a world of probabilities, not certainties. They do not need to be right about everything. They just need a few good bets where the upside is large and the downside is manageable.
They also stay flexible.
When new information appears, they update their view. They change their mind. They adjust their positions. Investing is less like writing a final answer and more like constantly updating a map while you are driving.
The biggest edge is not predicting the future perfectly. Nobody can do that. The real advantage is being comfortable operating in uncertainty while most people freeze or panic. Markets will always feel confusing in real time. Headlines will be scary. Narratives will change every few weeks.
For investors, understanding reflexivity is incredibly useful. It explains why the biggest trends can run much longer than people expect. And it also explains why the best opportunities often appear right when the narrative starts shifting again.
The job of an investor is simply to keep walking through the casino, look carefully at the most promising tables, and place smart bets. And the simplest way to increase your odds is by (1) waiting for an uptrend, (2) focusing on the strongest sectors, (3) buying the leading companies, (4) letting your winners run, and (5) cutting your losses quickly.
Lin
Weekly Market Update: Time of War
The war in Iran has added another shock to already fragile markets.
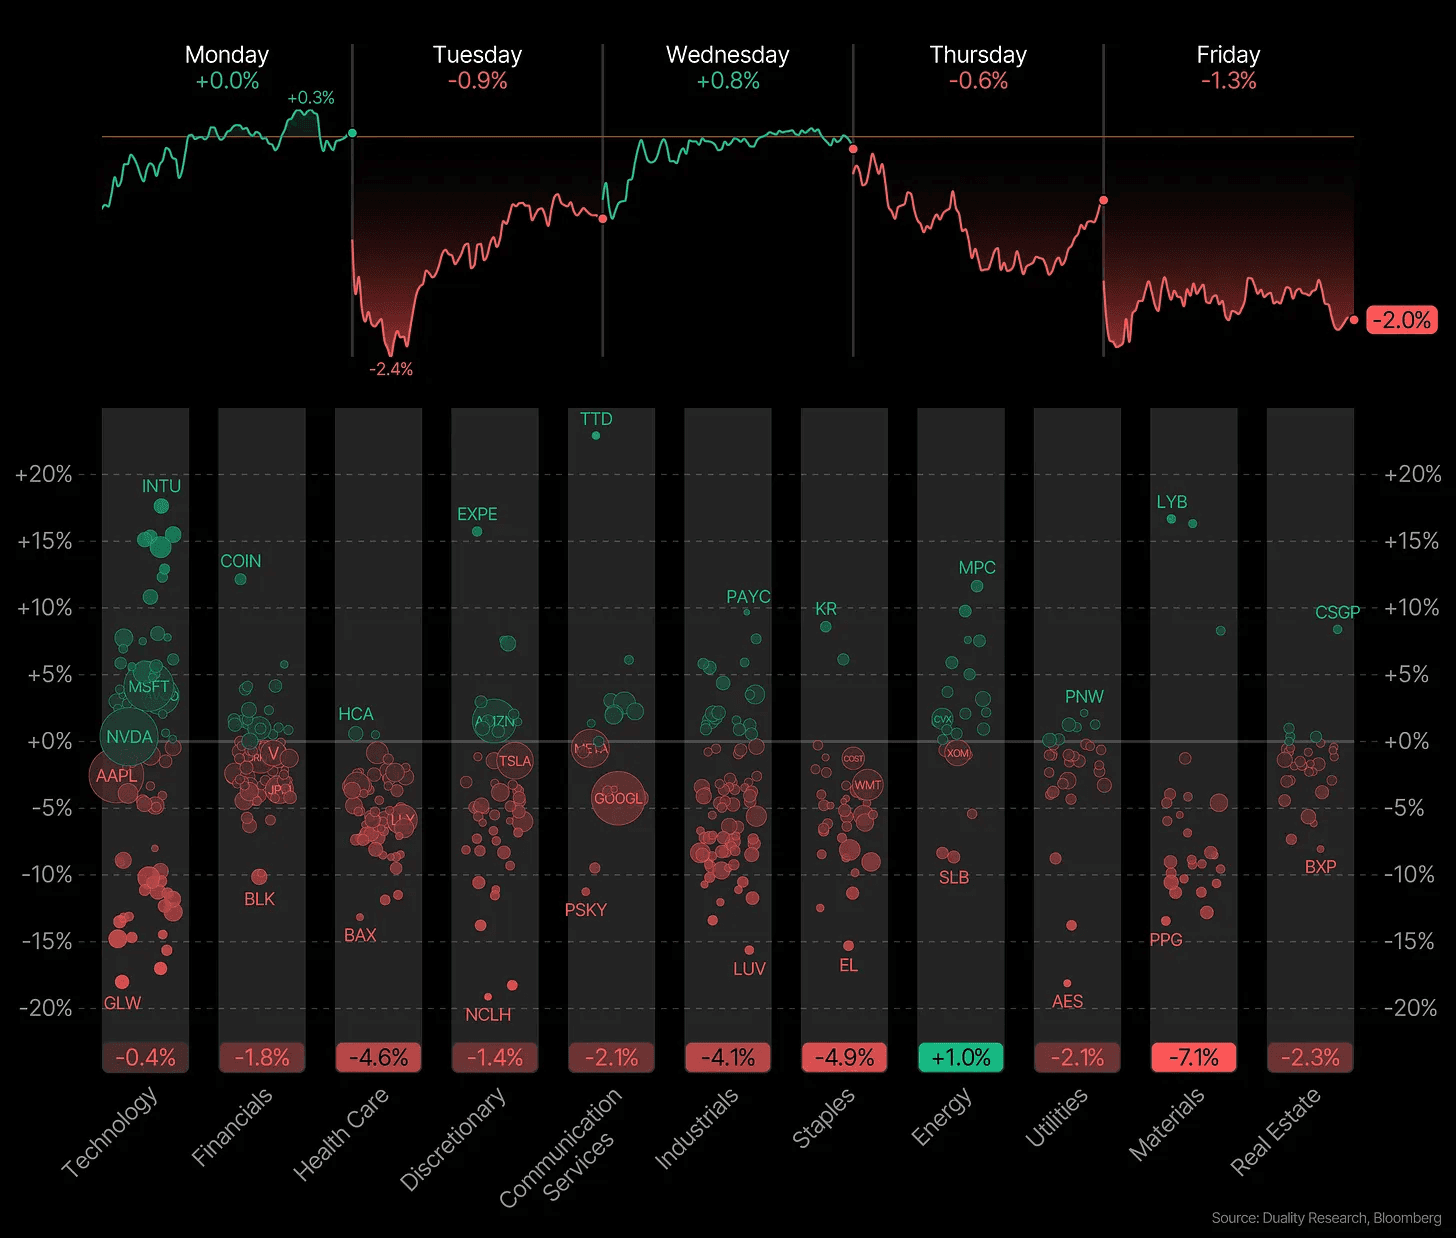
Volatility picked up across nearly every asset class. The S&P 500 fell 2.0%, marking its worst weekly performance since November. The weakness was broad. The Dow Jones dropped 3.0%, while the small cap Russell 2000 led the decline with a 4.1% loss.
In contrast, gold held up well and is up 18.6% this year despite a small pullback this week. Unsurprisingly, oil has been the biggest mover as the market prices in supply risks from the Middle East. Oil is up 36.4% this week alone.
This is the playbook that we’ve seen over and over again:
1. The initial shock
Right when conflict begins, markets usually drop. Investors hate uncertainty. Nobody knows how big the conflict will get, how long it will last, or what it will affect.
So investors reduce risk.
This often leads to short term market declines and rising volatility. Money flows out of stocks or other risk assets into safe havens like gold, government bonds, and the US dollar.
2. The commodity spike
Wars often affect energy and resources. If a conflict happens in an important region, markets worry about supply disruptions. This is why oil, energy companies, and defense related industries sometimes perform better during these periods.
3. The adjustment
After the first shock, markets usually adapt. Investors begin to understand the scale of the conflict and price in the real economic impact. And most importantly, uncertainty starts to resolve.
Historically, this happens surprisingly fast.
Because markets are forward looking. Investors do not price what is happening today. They price what they think will happen in the future. All of those expectations get priced into markets very fast.
On top of that, markets react mostly to uncertainty, not just bad news. The start of a war creates maximum uncertainty. Investors do not know how large the conflict will become, how long it will last, or what countries might get involved. But once the situation becomes clearer, even if the news is still negative, markets often start to stabilize.
We’ve seen this happen plenty of times in the past. During conflicts like the Gulf War, the Iraq War, or the invasion of Ukraine, markets panicked quickly at first. But once investors understood the scale of the conflict and its likely economic impact, markets started focusing again on growth, earnings, and interest rates.
The market always tries to price the future before it happens.
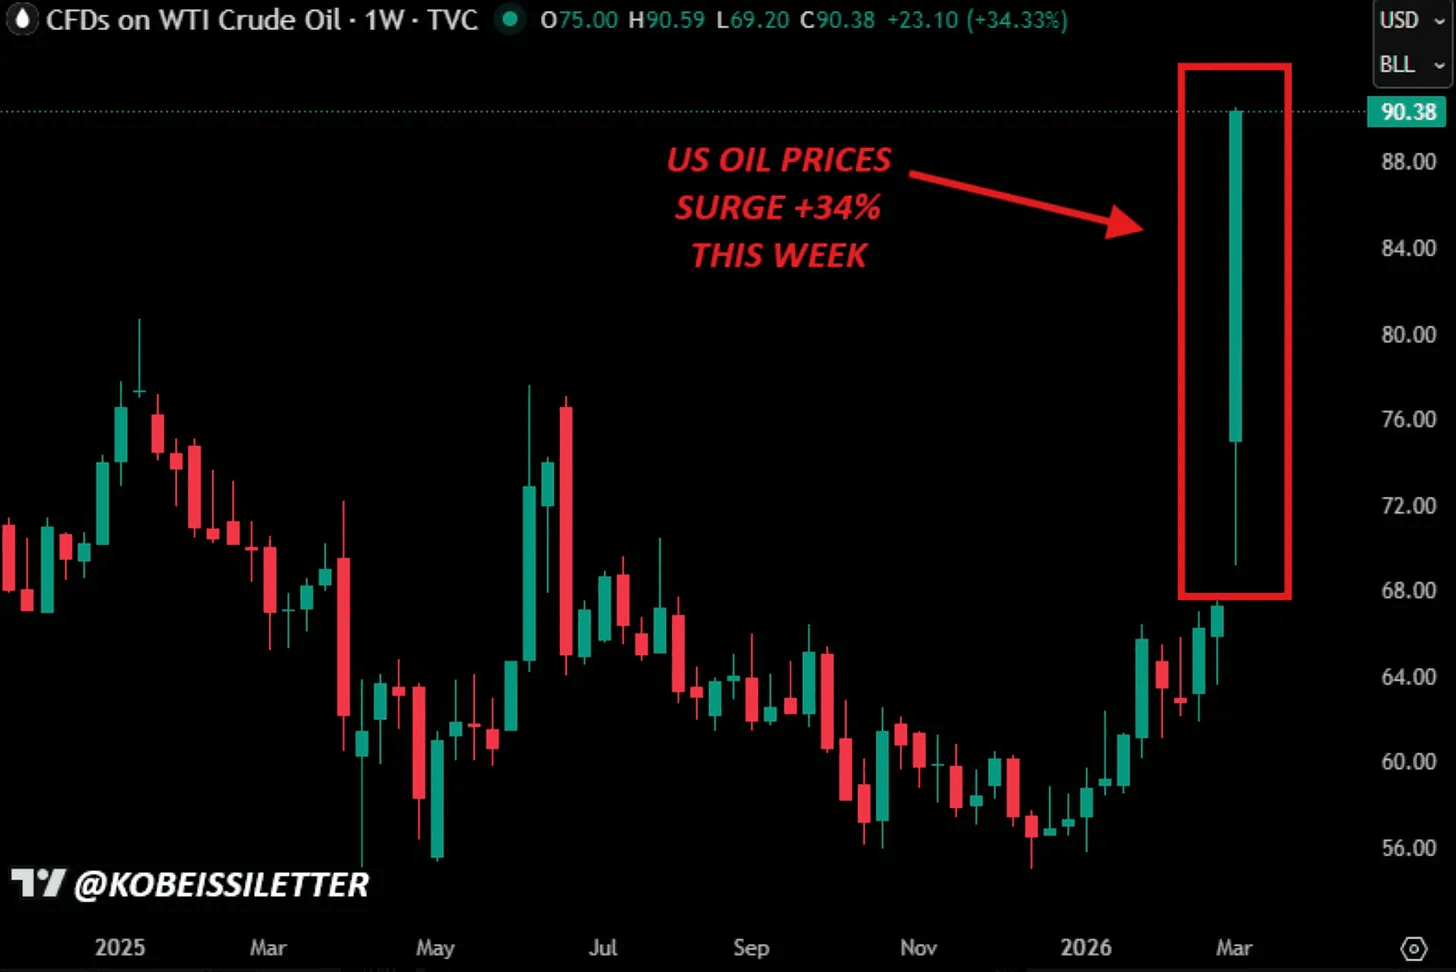
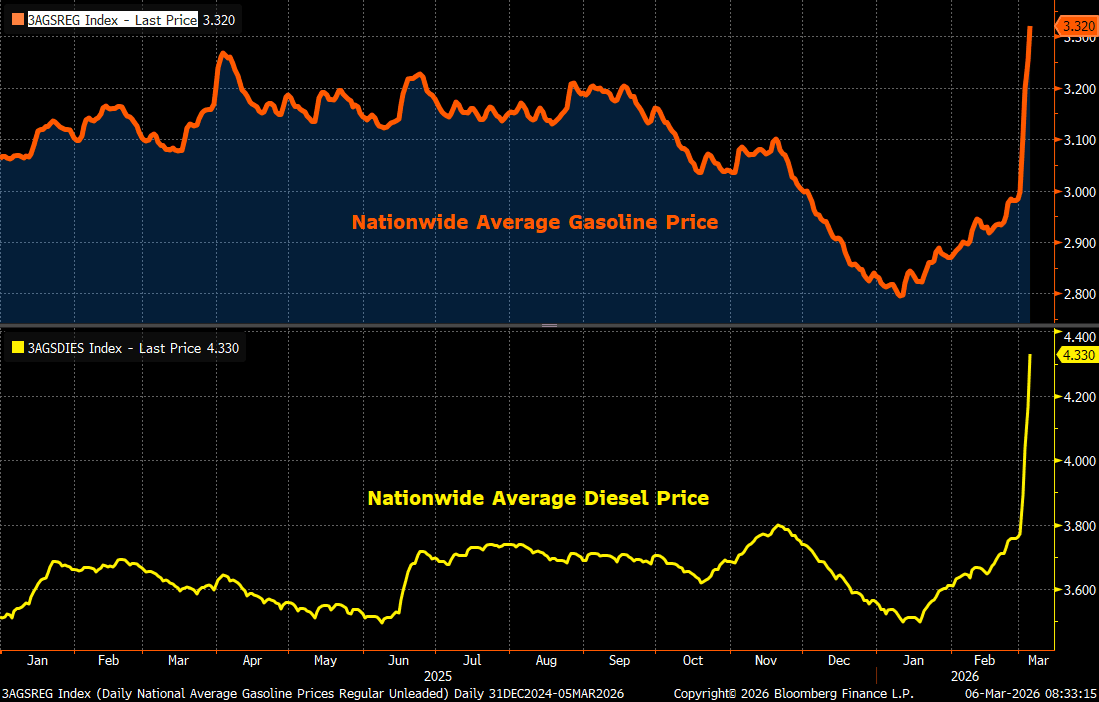
So it’s no surprise that oil is the story this week, and oil prices will ultimately determine whether this conflict becomes an economic problem or just a headline.
WTI crude started the week at $67.27 a barrel. By Friday it was trading above $90. Futures even crossed $100 overnight. That marks the largest weekly gain on record, going all the way back to 1982.
The problem is that every $10 rally in oil prices adds roughly 20 basis points of inflation pressure.
Oil has already surged from $55 to $80, implying roughly 50 basis points of inflation pressure even before this week’s additional spike. At $95 oil, inflation moves to around 3.2%. At $130, it moves closer to 3.9%.
That’s a direct threat to the rate cut timeline markets have been pricing in.
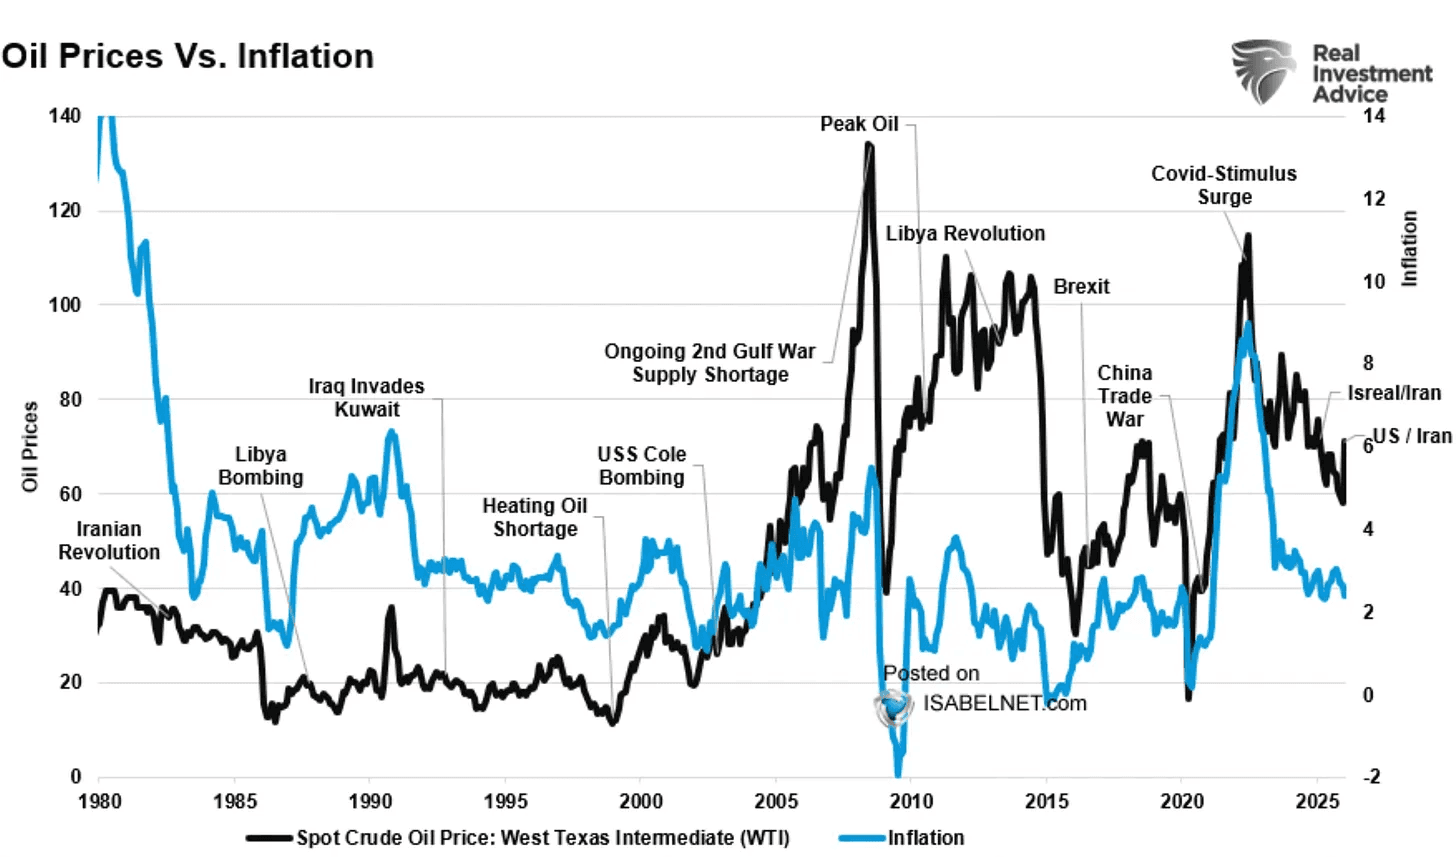
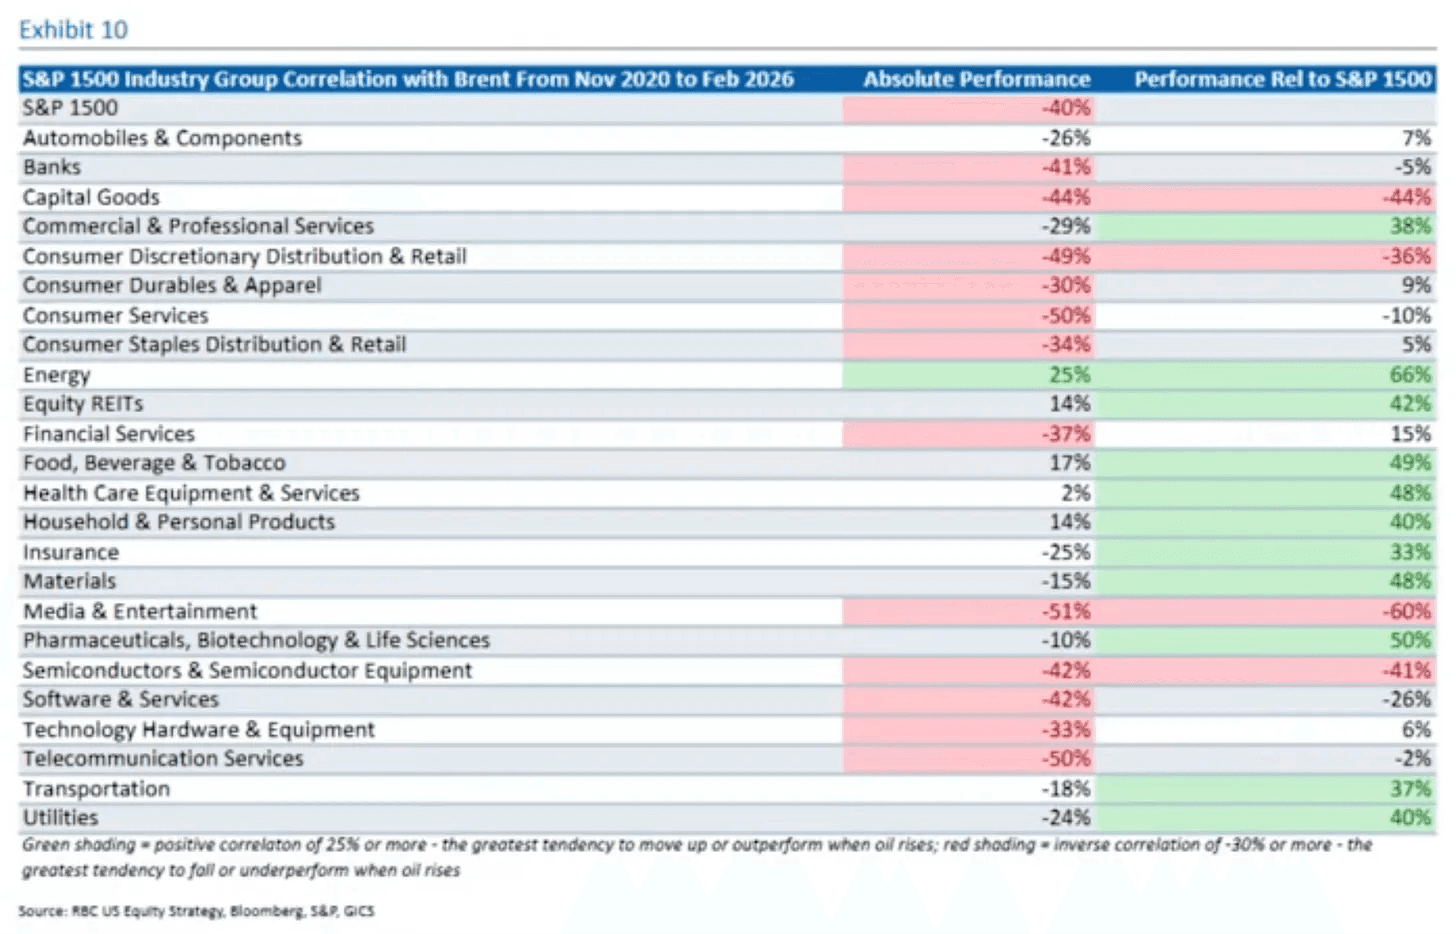
Historically, during oil supply shocks, the best performing industries have been energy, defense, steel, and healthcare. In contrast, sectors that tend to struggle during oil supply shocks are consumer discretionary, airlines and transportation, energy-intensive industrials, retail, and often growth tech stocks.
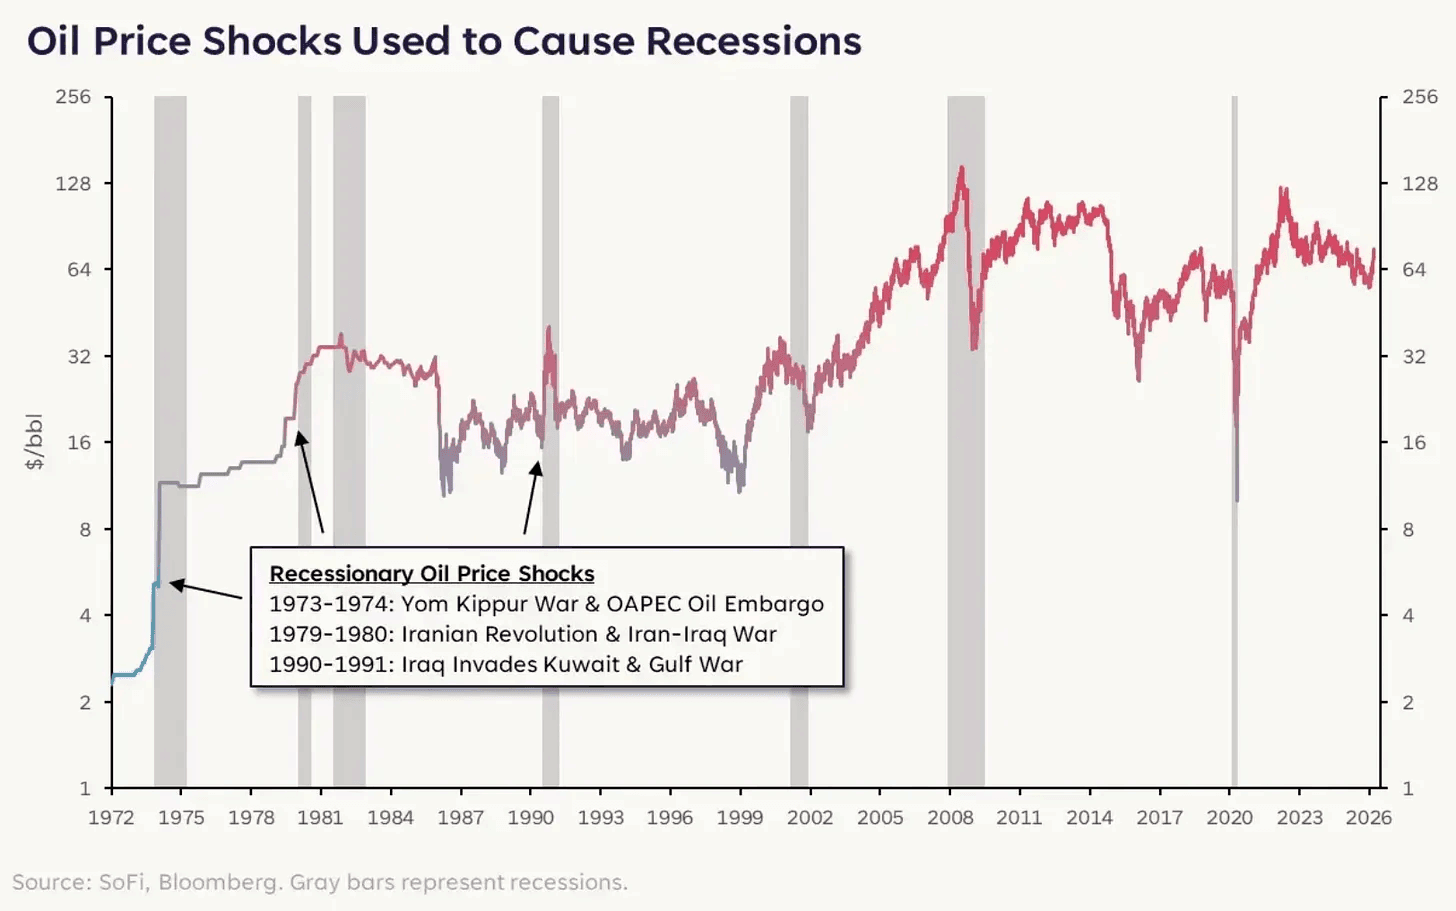
The chart of oil shocks and recessions since 1972 is interesting.
It shows that not every spike in oil leads to a recession. The key difference is how long the increase lasts. Short spikes usually create volatility, but the economy can handle them.
The oil shocks that were followed by recessions were different because prices stayed high for a long time and kept pressure on businesses and consumers. That is when higher energy costs start slowing the economy.
Right now oil has risen sharply, but it is still too early to know if it will become a sustained shock. But it is something to watch closely.
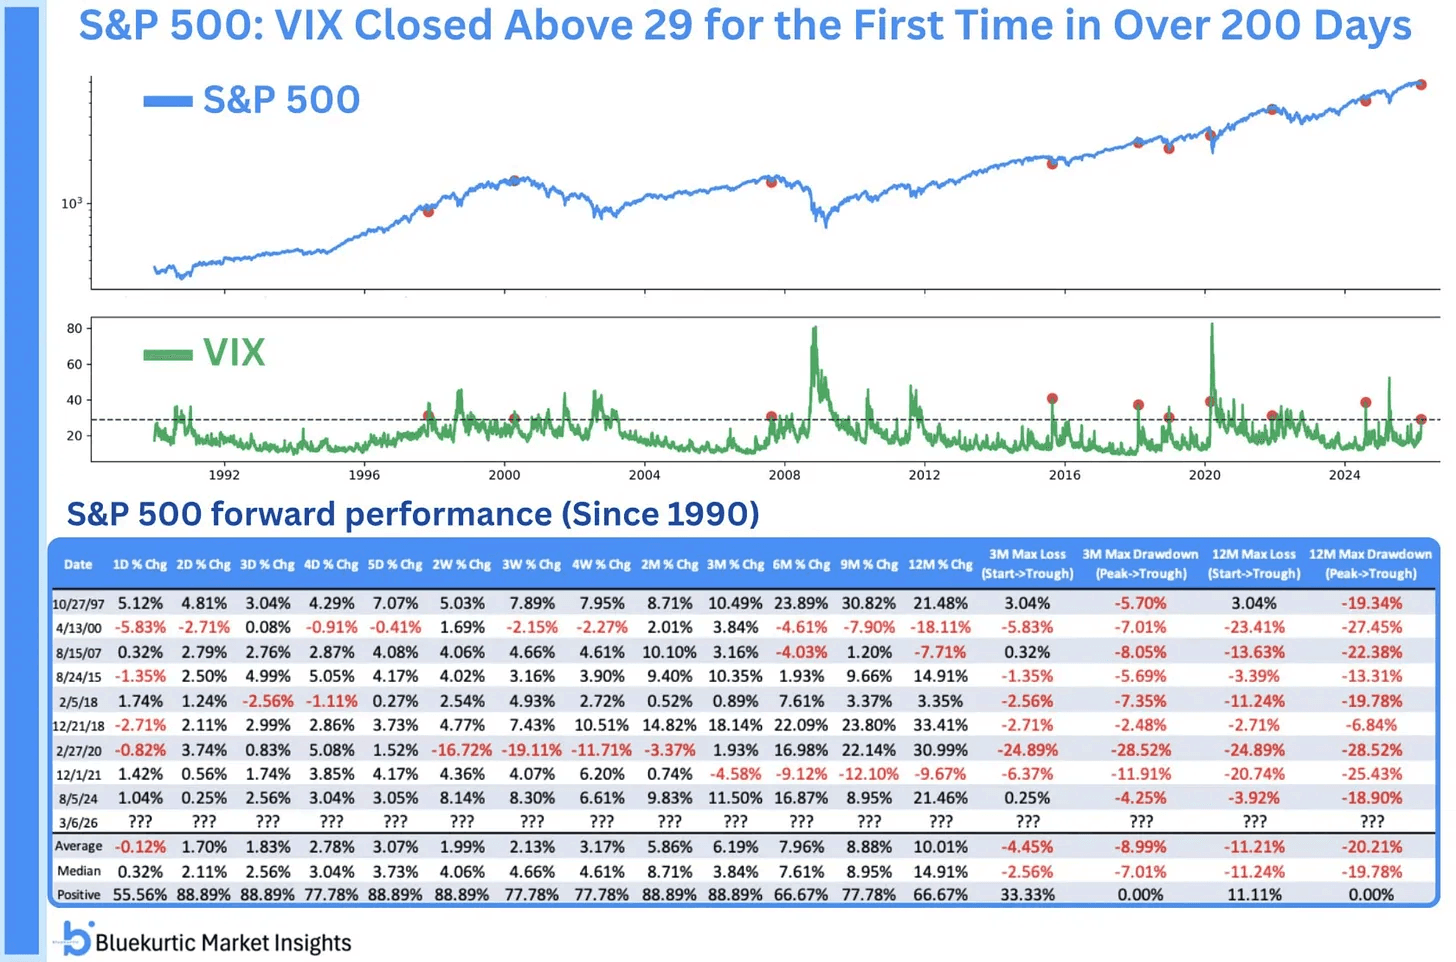
After everything that hit the market this week, it is not surprising that volatility picked up.
That is exactly what happened. The VIX closed above 29 for the first time in more than 200 days. This is the highest closing level since the tariff shock in April 2025 and one of the higher readings we have seen over the past five years.
A simple way to estimate expected market movement is the Rule of 16.
You take the current level of the VIX and divide it by 16. This gives an estimate of the expected daily move in the S&P 500. For example, if the VIX is around 30, you divide 30 by 16. That gives about 1.87. This means the market is pricing in roughly a 1.87% move up or down every day.
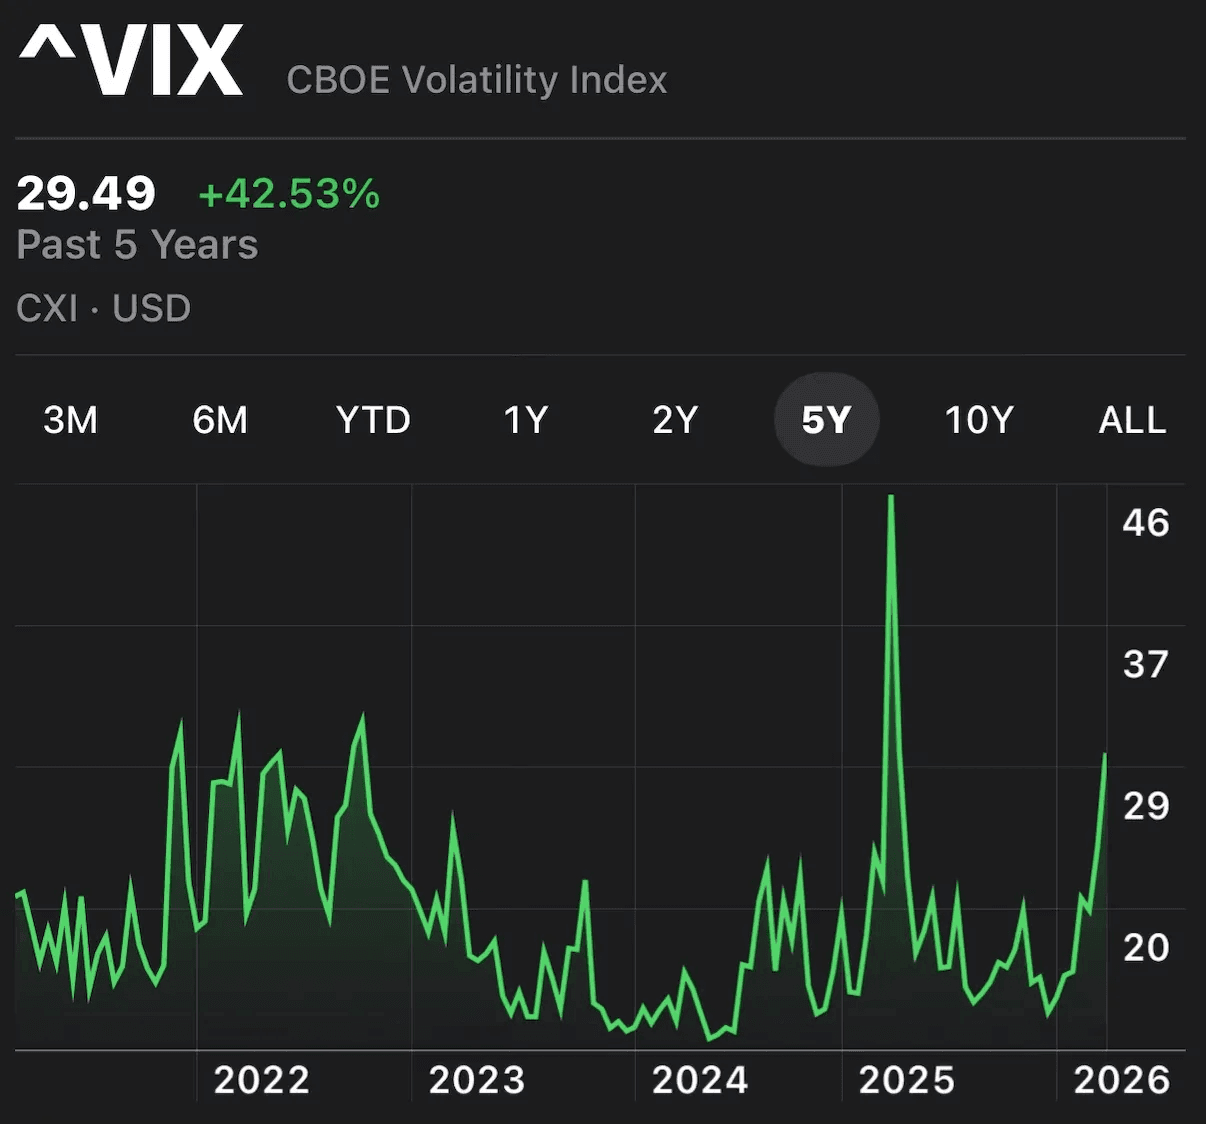
It sounds alarming at first. Past spikes where the VIX moved above 29 have often happened close to short term market lows.
Because extreme spikes in volatility often appear when fear is already very high. By that point, a lot of selling has already happened.
Of course, no signal works every time and there can definitely be more downside ahead. But it’s important to keep this in mind and to be prepared. There will eventually be great opportunities, even if it’s not today.
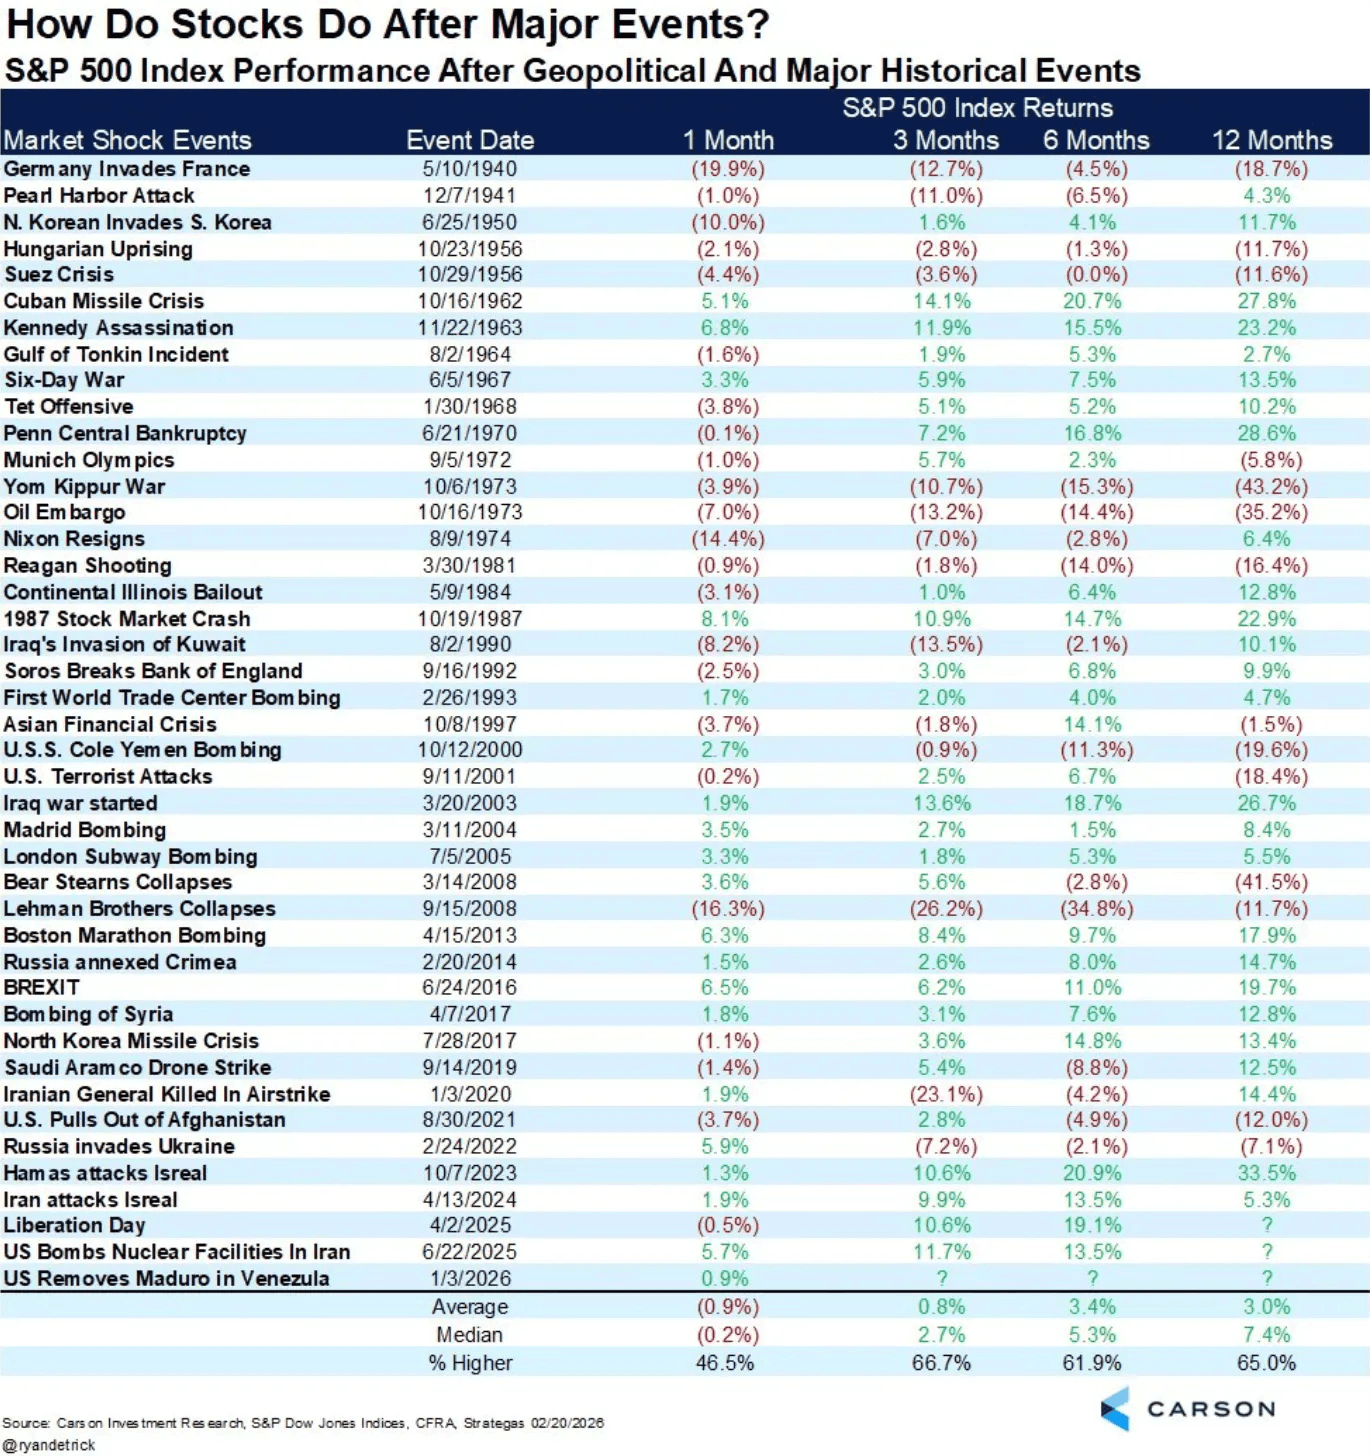
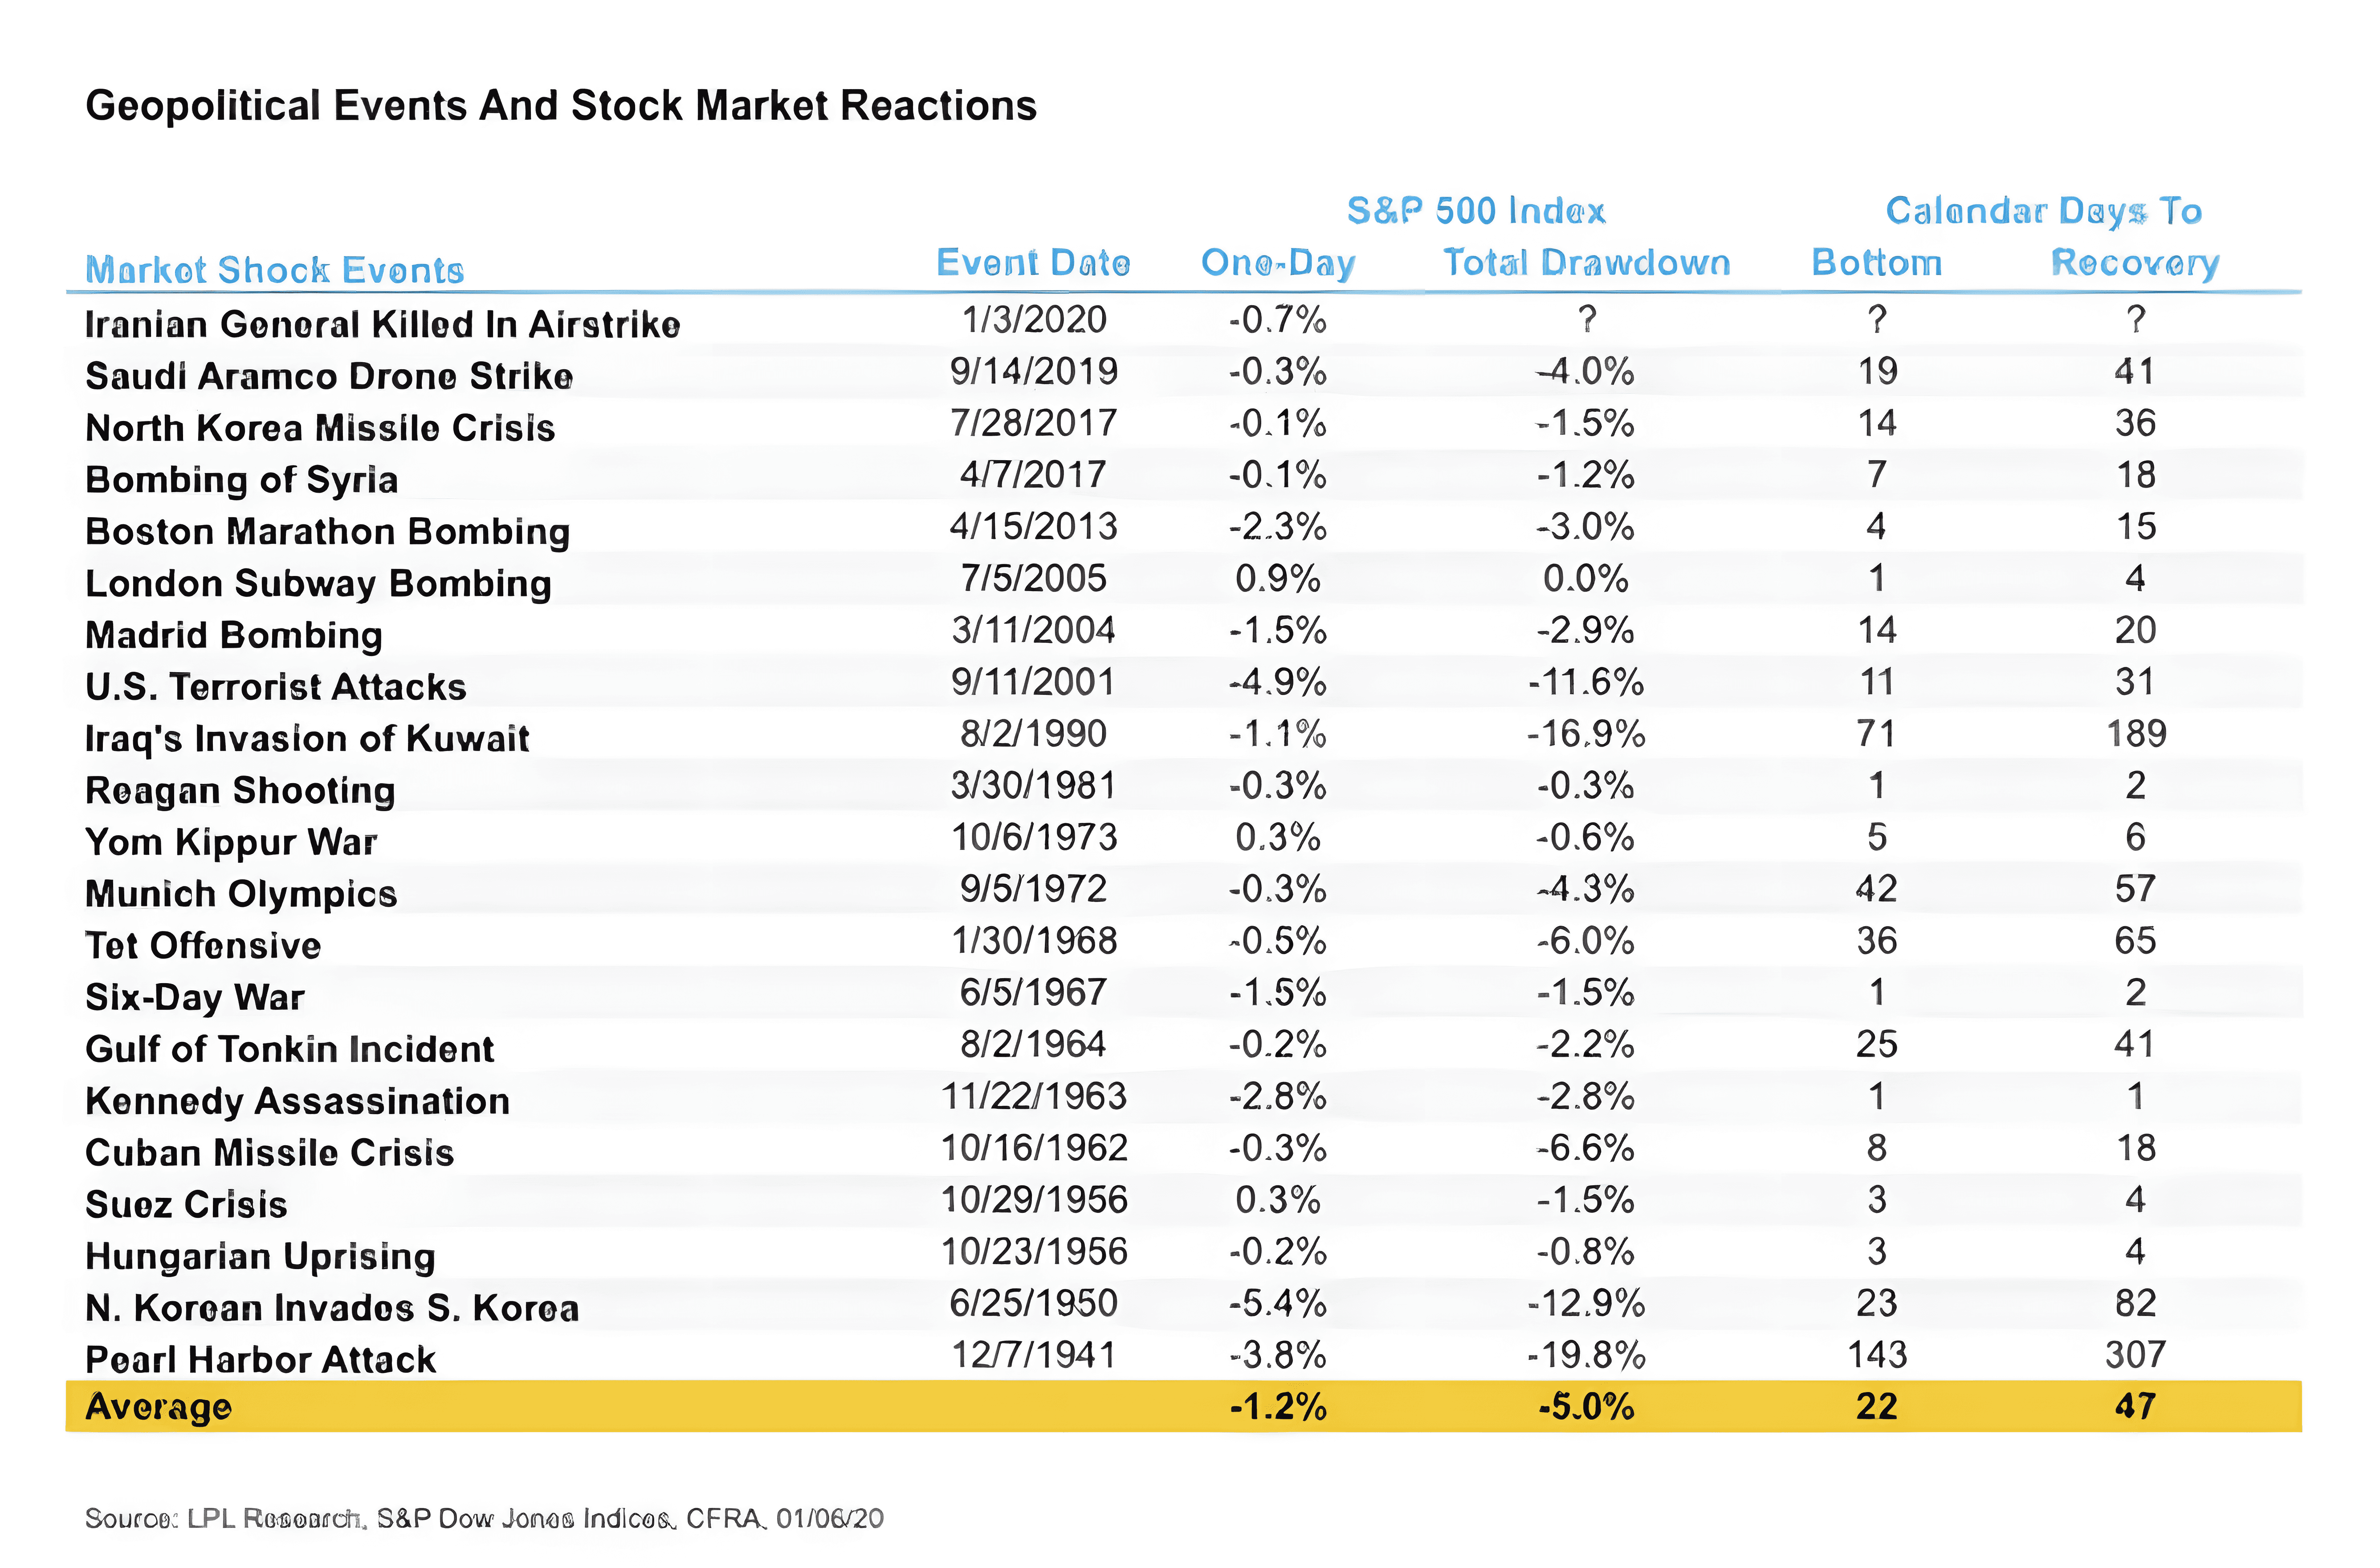
What often gets lost in moments like this is that geopolitical tension, as scary as it sounds, rarely causes a big and lasting hit to corporate earnings. And at the end of the day, that is what markets really care about. Not headlines. Earnings.
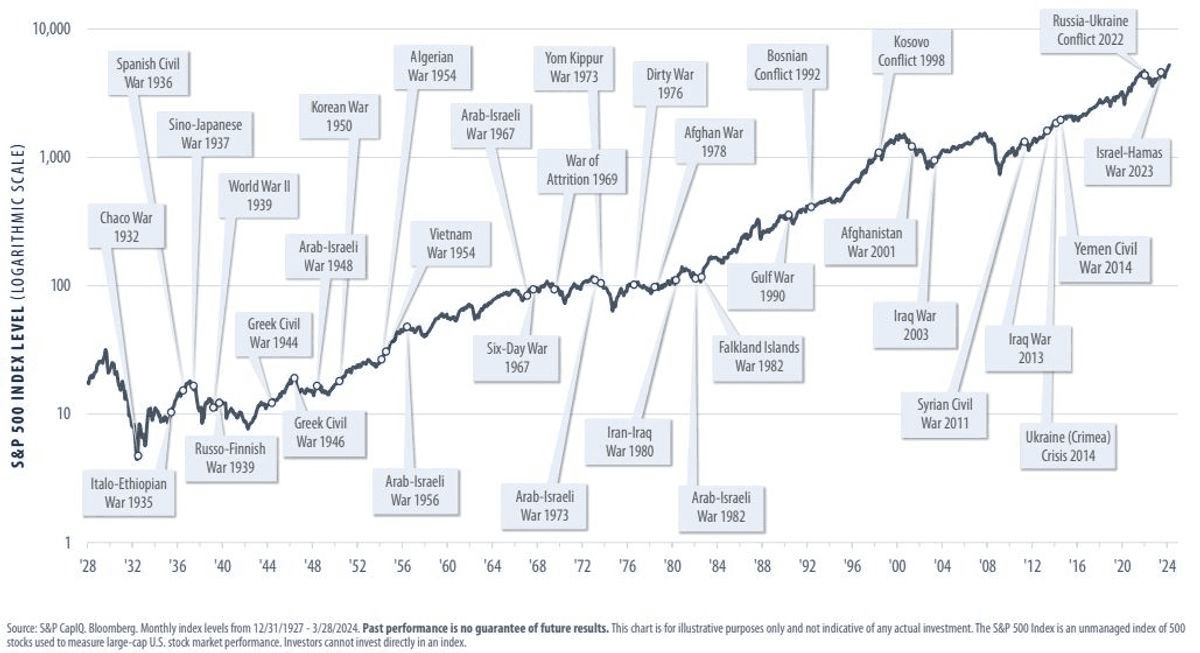
Below is how the S&P 500 performed after major geopolitical events going all the way back to 1940. The short term reaction is often a bit weak. On average, the market is slightly negative one month later.
But if you zoom out, that changes. Over 3, 6, and 12 months the market tends to recover. In fact, one year later the S&P 500 has been higher about 65% of the time, with a median 12 month return of around 7.4%.
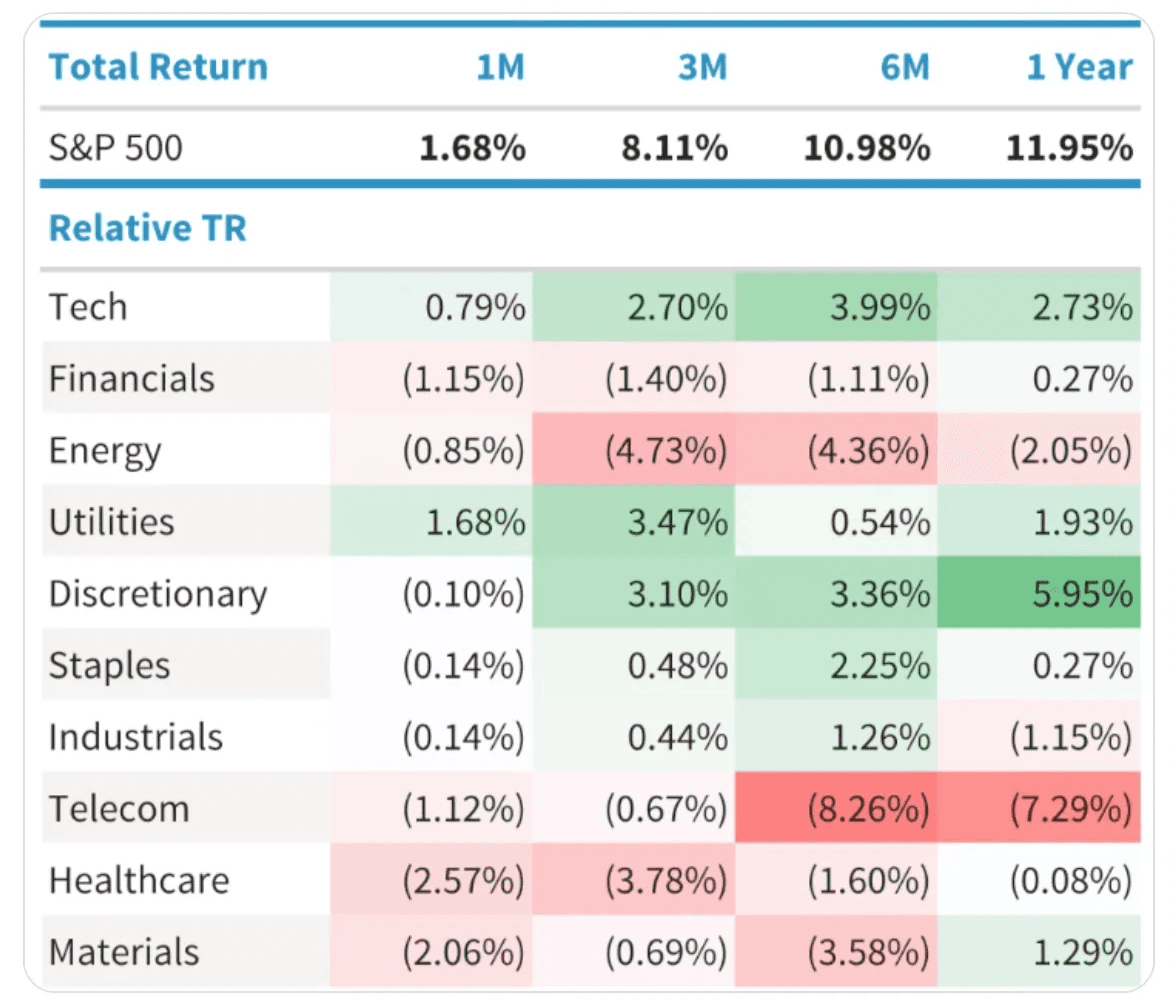
And historically, that instinct has often been right. Looking back to 1990, the sectors that performed best a year after peaks in geopolitical risk were consumer discretionary, tech, and utilities.
That might sound surprising at first. If the world was truly falling apart, you would expect more defensive sectors to lead. But the data often shows the opposite.
Once the initial fear fades, markets tend to refocus on growth, spending, and normal economic activity. That is why sectors tied to consumer demand and technology have often bounced back the strongest after periods of geopolitical stress.
Inflation pressures are also starting to pick up again. The January Core Personal Consumption Expenditures Price Index, one of the Federal Reserve’s key inflation gauges, is already expected to come in hot based on the data released so far. Estimates suggest the year over year pace could reach around 3.2%, which would be the fastest since November 2023. And that number does not yet reflect the recent developments in the Middle East.
Of course, higher inflation and higher interest rates also create challenges for households. This becomes even more important when the labor market looks a bit uncertain and finding a new job is not easy if someone loses their current one. That kind of environment can weigh on consumer sentiment and make people feel less confident about the economy.
Even without the recent tensions in the Middle East, the macro picture for 2026 was already somewhat complicated. Inflation is still running above 3%, which is higher than the Federal Reserve would prefer. At the same time, the rapid buildout of AI infrastructure is creating supply bottlenecks in areas like memory chips. Shortages could add pressure to prices for everything from computers and electronics to cars.
Taken together, those factors alone would already make it harder for the Fed to justify cutting interest rates aggressively this year. The labor market remains an important variable. It weakened during the middle of 2025 but has stabilized more recently. That said, stabilization does not necessarily mean strength. It is also worth remembering that the Fed already cut rates by 0.75 percentage points in the fourth quarter of last year to support employment.
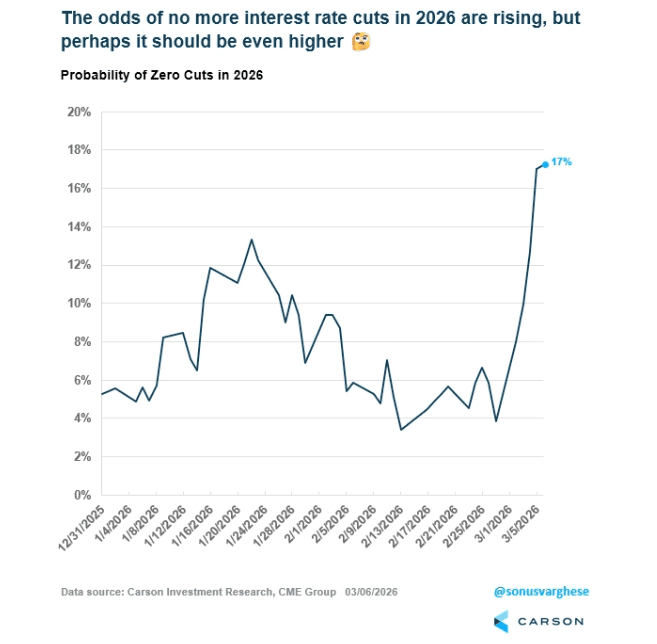
The chance that the Fed makes no additional cuts at all this year has risen from below 5% last week to more than 17% now. And the odds could be even higher depending on how inflation and energy prices evolve.
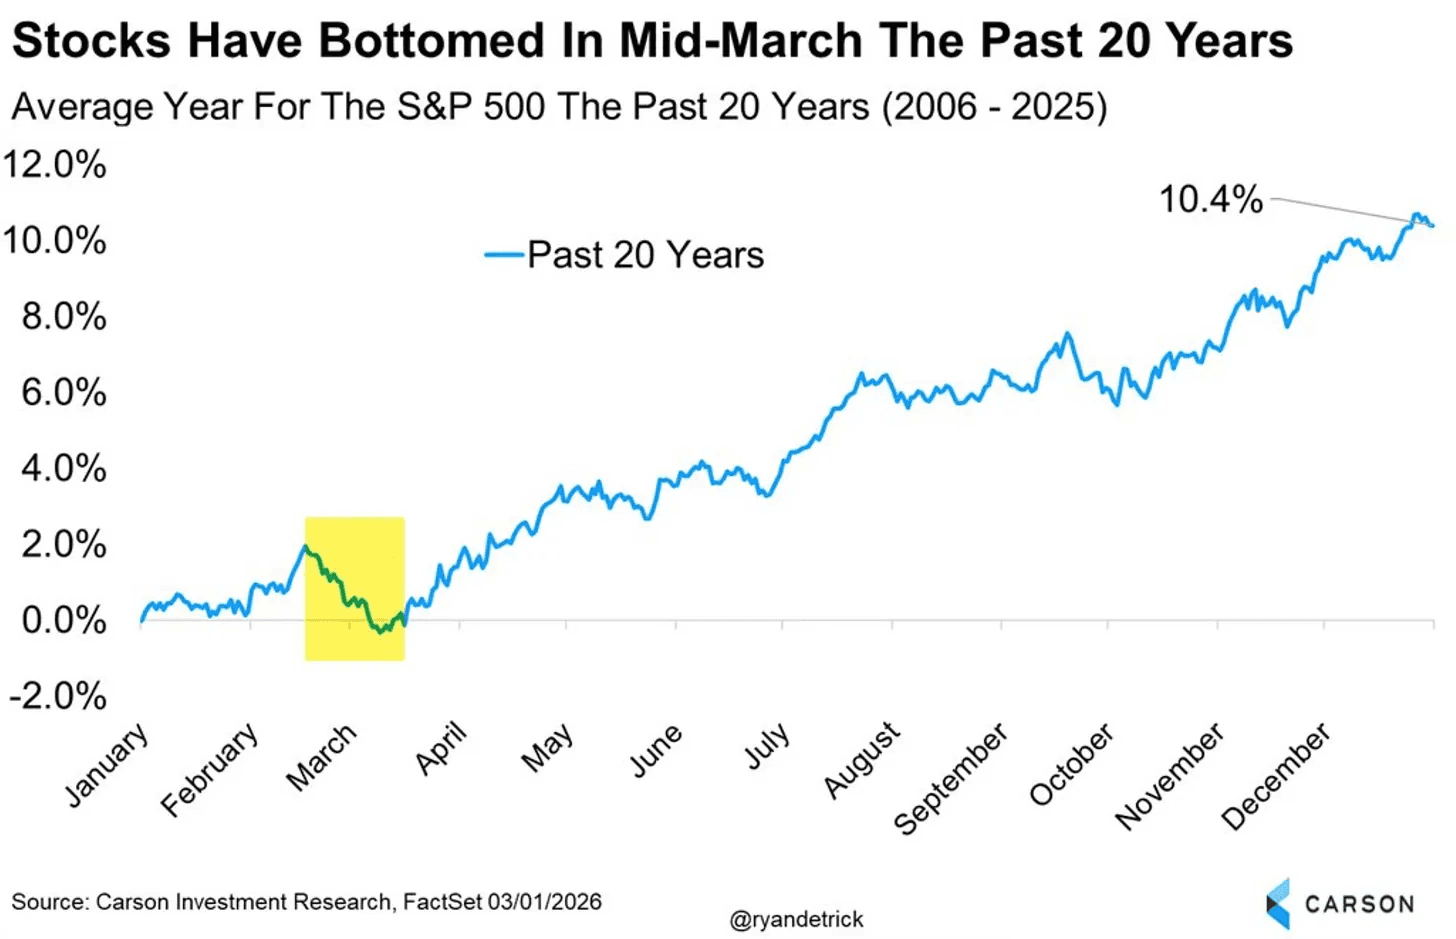
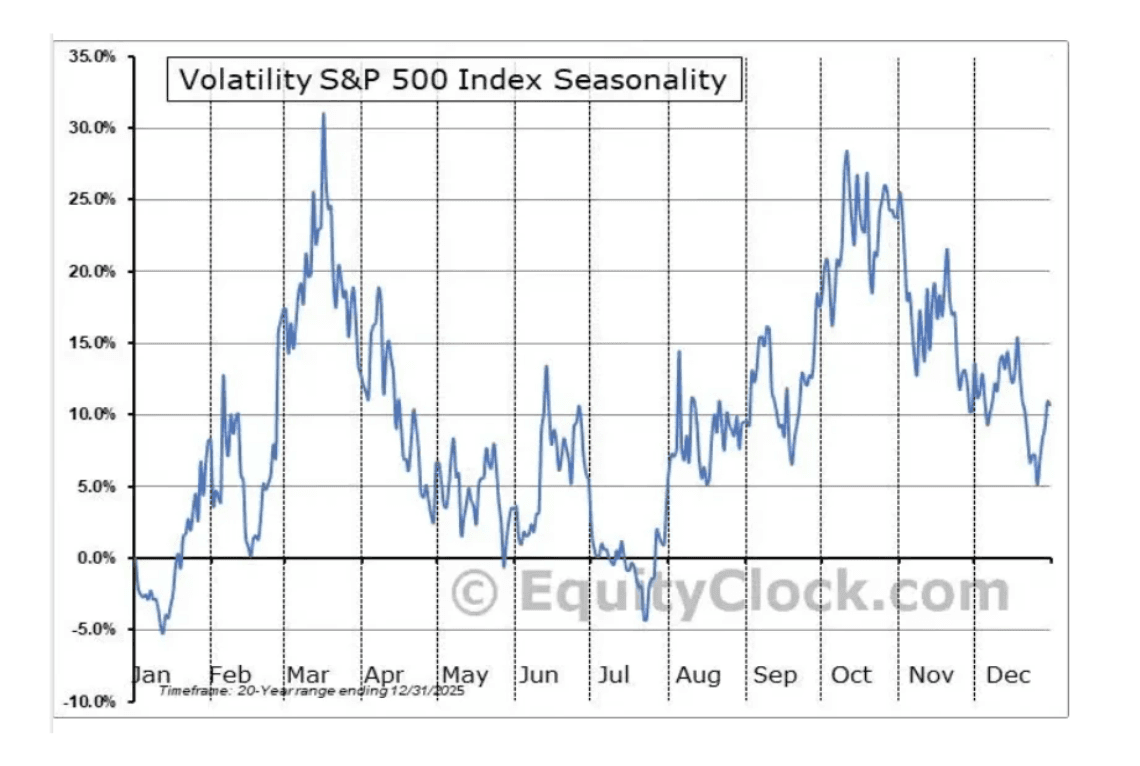
And to top things off, over the past 20 years, late February into late March has not been favorable. In many years the market tends to form a short term low around that time before stabilizing again.
Mid March has frequently marked the bottom of the average year going back to 2006. While years like 2009 and 2020 are included in that data, the pattern shows up often enough to at least keep in mind.
Right now the market is dealing with a lot at once. War. Inflation. AI fears. Volatility. There is a reason why being defensive has been the main priority over the last few weeks and months.
You do not need to predict the exact bottom. Nobody can do that consistently. What you can do is manage your risk and adjust your exposure according to the market condition.
There is no doubt in my mind that there will be tremendous opportunities coming out of this. But nobody knows how far it will go or how long it will last.
The key is to be prepared and keep drawdowns and risk exposure contained.
That means staying calm and not doing anything stupid when markets get messy. In times like these, it is easy to panic, fall for FOMO, or make emotional decisions. Most mistakes happen exactly in those moments.
Markets always go through phases like this. TBut those periods are also when the next big opportunities start to evolve.
Lin
Market Update: Earnings Roulette
Nvidia delivered incredible earnings once again.
Here’s a quick recap from the earnings report of the largest company on earth:
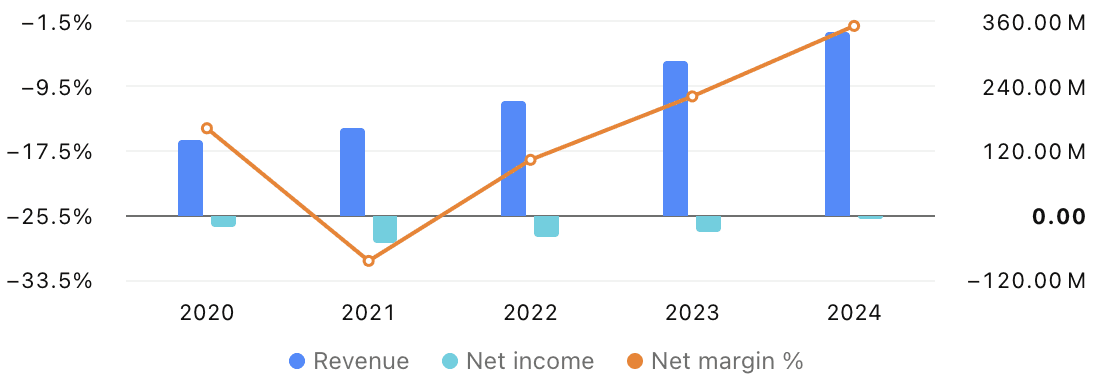
Nvidia posted adjusted earnings per share of $1.62, beating Wall Street’s consensus estimate of $1.53.
Revenue came in at $68.1 billion, ahead of expectations of $66.1 billion.
Gross margin also beat, at 75.2% versus the 75.0% estimate.
Data center revenue rose 75% year over year to $62.3 billion, above the $60.7 billion estimate. Nvidia said hyperscalers accounted for slightly more than half of data center revenue this quarter.
The outlook was even stronger than the January quarter. For the current quarter, Nvidia guided to a revenue midpoint of $78 billion, well above the $72.7 billion consensus.
The guidance is even more impressive when you consider it includes no contribution from China. China is a roughly $50 billion market per year.
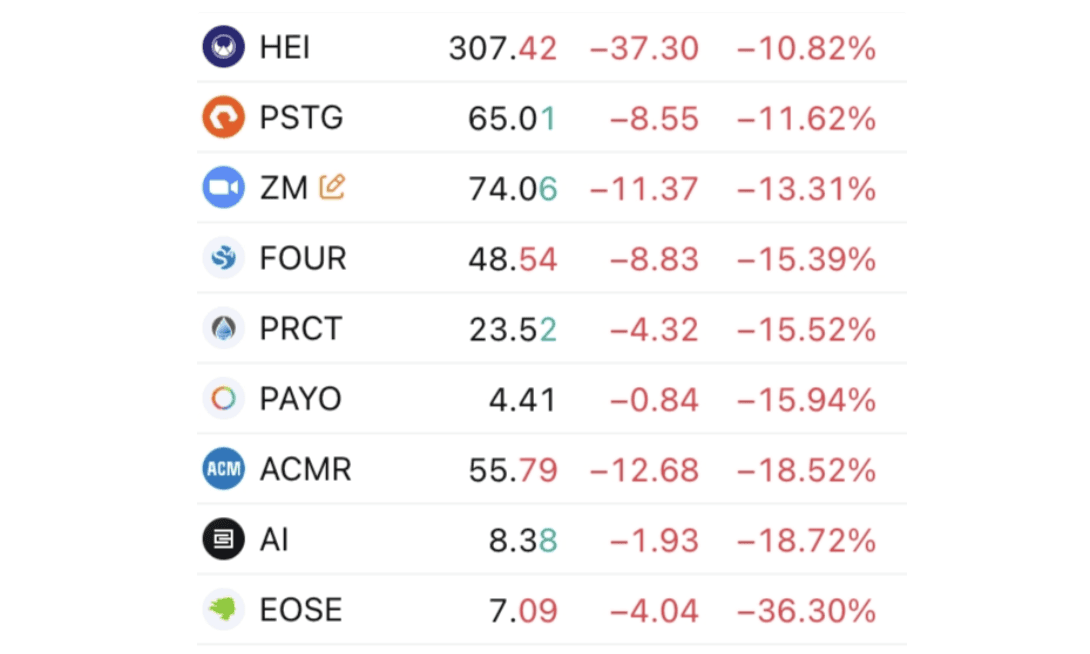
In short, it was a superb quarter with incredible guidance. But even that was not enough to convince Wall Street. The stock is down more than 5% today. This is the kind of market where great results are simply not good enough. And Nvidia is not alone here. Dozens of stocks are getting brutally punished today after they missed earnings or did not meet investors expectations.
One thing people often forget is how emotional markets are in the short term. Large price swings can swing can happen even for no good reasons. Fear, excitement, headlines, and investors sentiment sometimes matter more than the actual numbers, at least for a while. That’s why it’s important to zoom out and not react to every move.
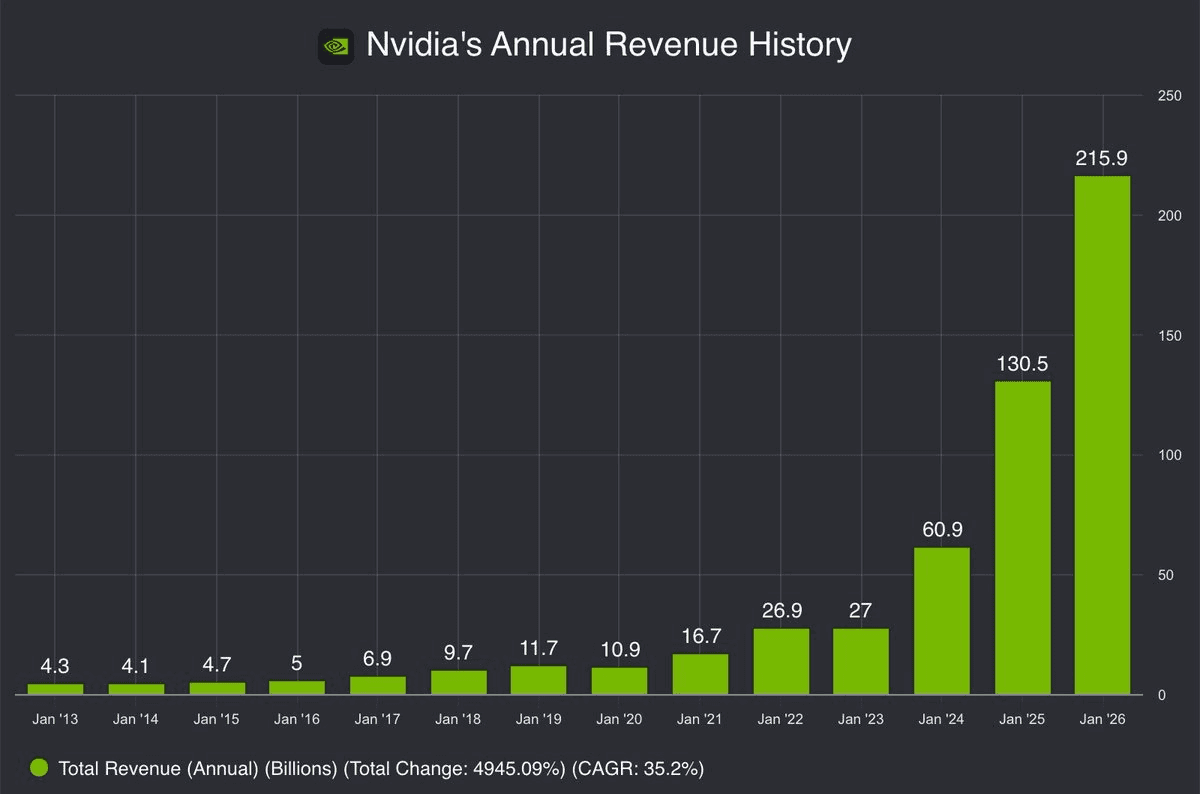
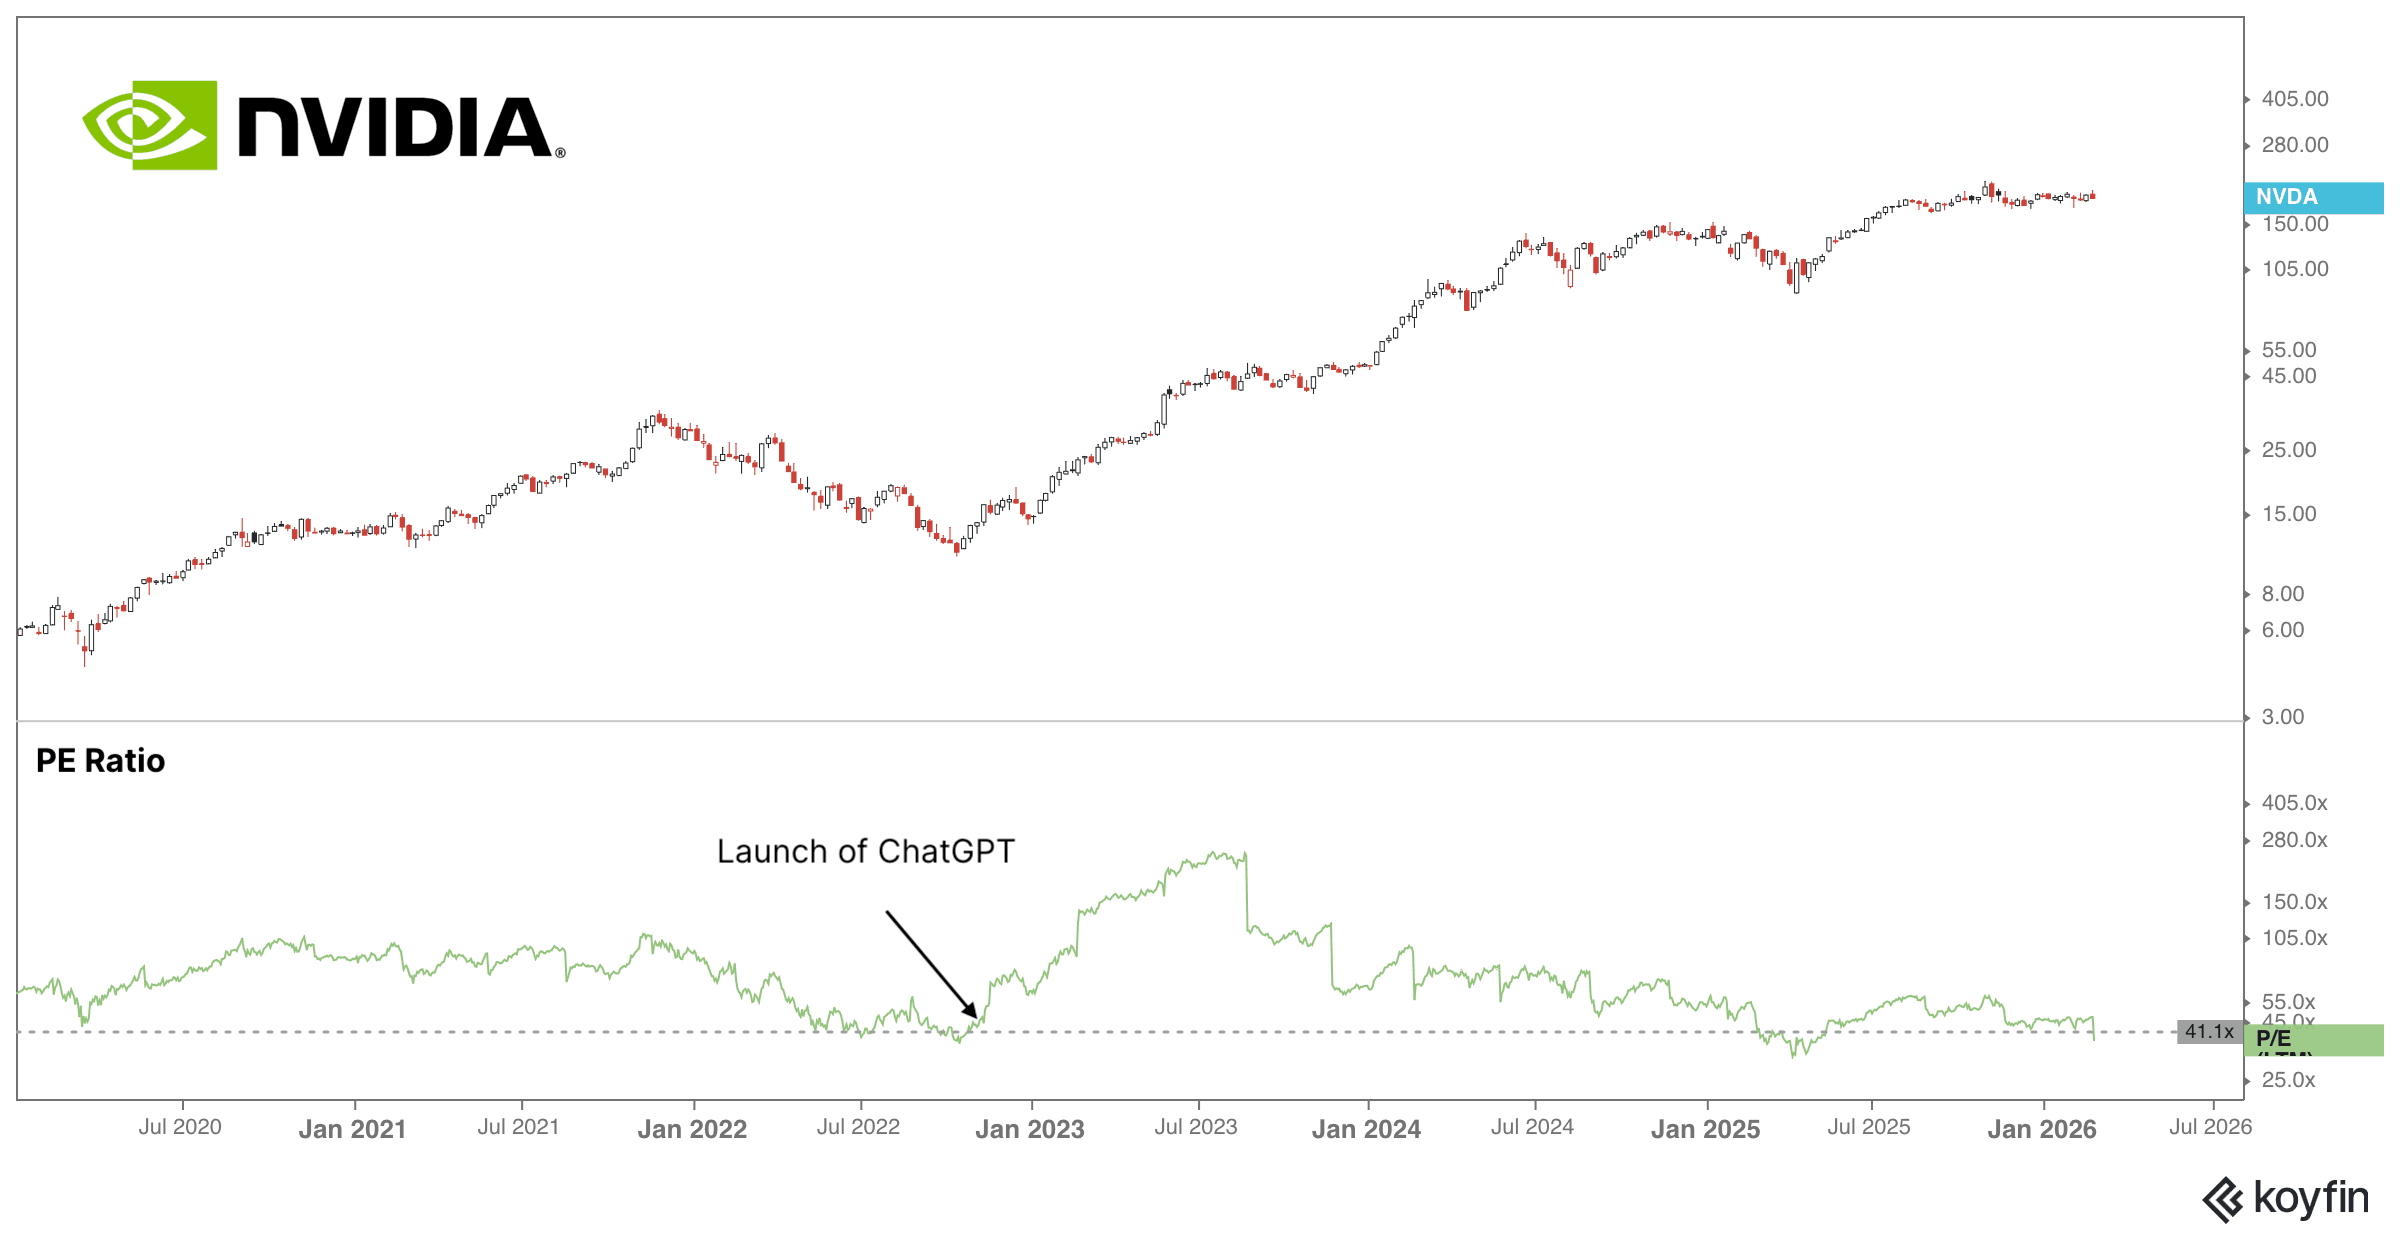
To put this into perspective, Nvidia is trading at roughly the same price to earnings ratio it had when ChatGPT launched. Since then it grew its revenues by 8x and continues to accelerate. Nvidia has become the backbone of AI infrastructure. Yet the valuation multiple has not expanded. It has actually compressed.
That means this is the cheapest Nvidia has been on a PE basis since the start of the AI boom, even after all this growth.
We have to deal with the fact that Ssort-term price action can be unpredictable and volatile.
But one thing is clear.
Demand for compute is not slowing down. It is speeding up. It is going exponential. We are at an inflection point for agentic AI.
Nvidia’s networking products are often purchased 4 to 6 months in advance of data center buildouts. Its networking business grew 162% year over year in Q3, which was an important sign of demand going into 2026. In this recent quarter, networking revenue grew even more and accelerated to 263% year-over-year growth. That is an insane number. It suggests the current NVL72 AI server cycle is strong and likely has several more quarters left to run.
In late December, Nvidia acquired the assets of AI inference chip startup Groq by hiring key employees and licensing the technology. It was expected that it would take years before there was clarity on how Nvidia would use Groq’s high-performance, low-cost AI inference technology. That assumption turned out to be wrong. Jensen said on the earnings call that he will share his ideas on how to incorporate Groq technology at the annual GTC conference next month already. He even said that Groq could be similar to its prior acquisition of Mellanox. Mellanox is one of the most successful acquisitions in the history of the technology industry.
Nvidia increased its supply-related agreements from $50.3 billion to $95.2 billion this quarter. That likely means Nvidia has secured key supplies like memory chips and wafers. Locking up component allocations ahead of major shortages gives Nvidia a meaningful advantage over the rest of its competition.
For whatever reason, Nvidia shares over the past few quarters have become unpredictable the day after earnings, even when the numbers are great. It’s always sold off the after. There are a few speculations as to why but the honest answer is nobody really knows.
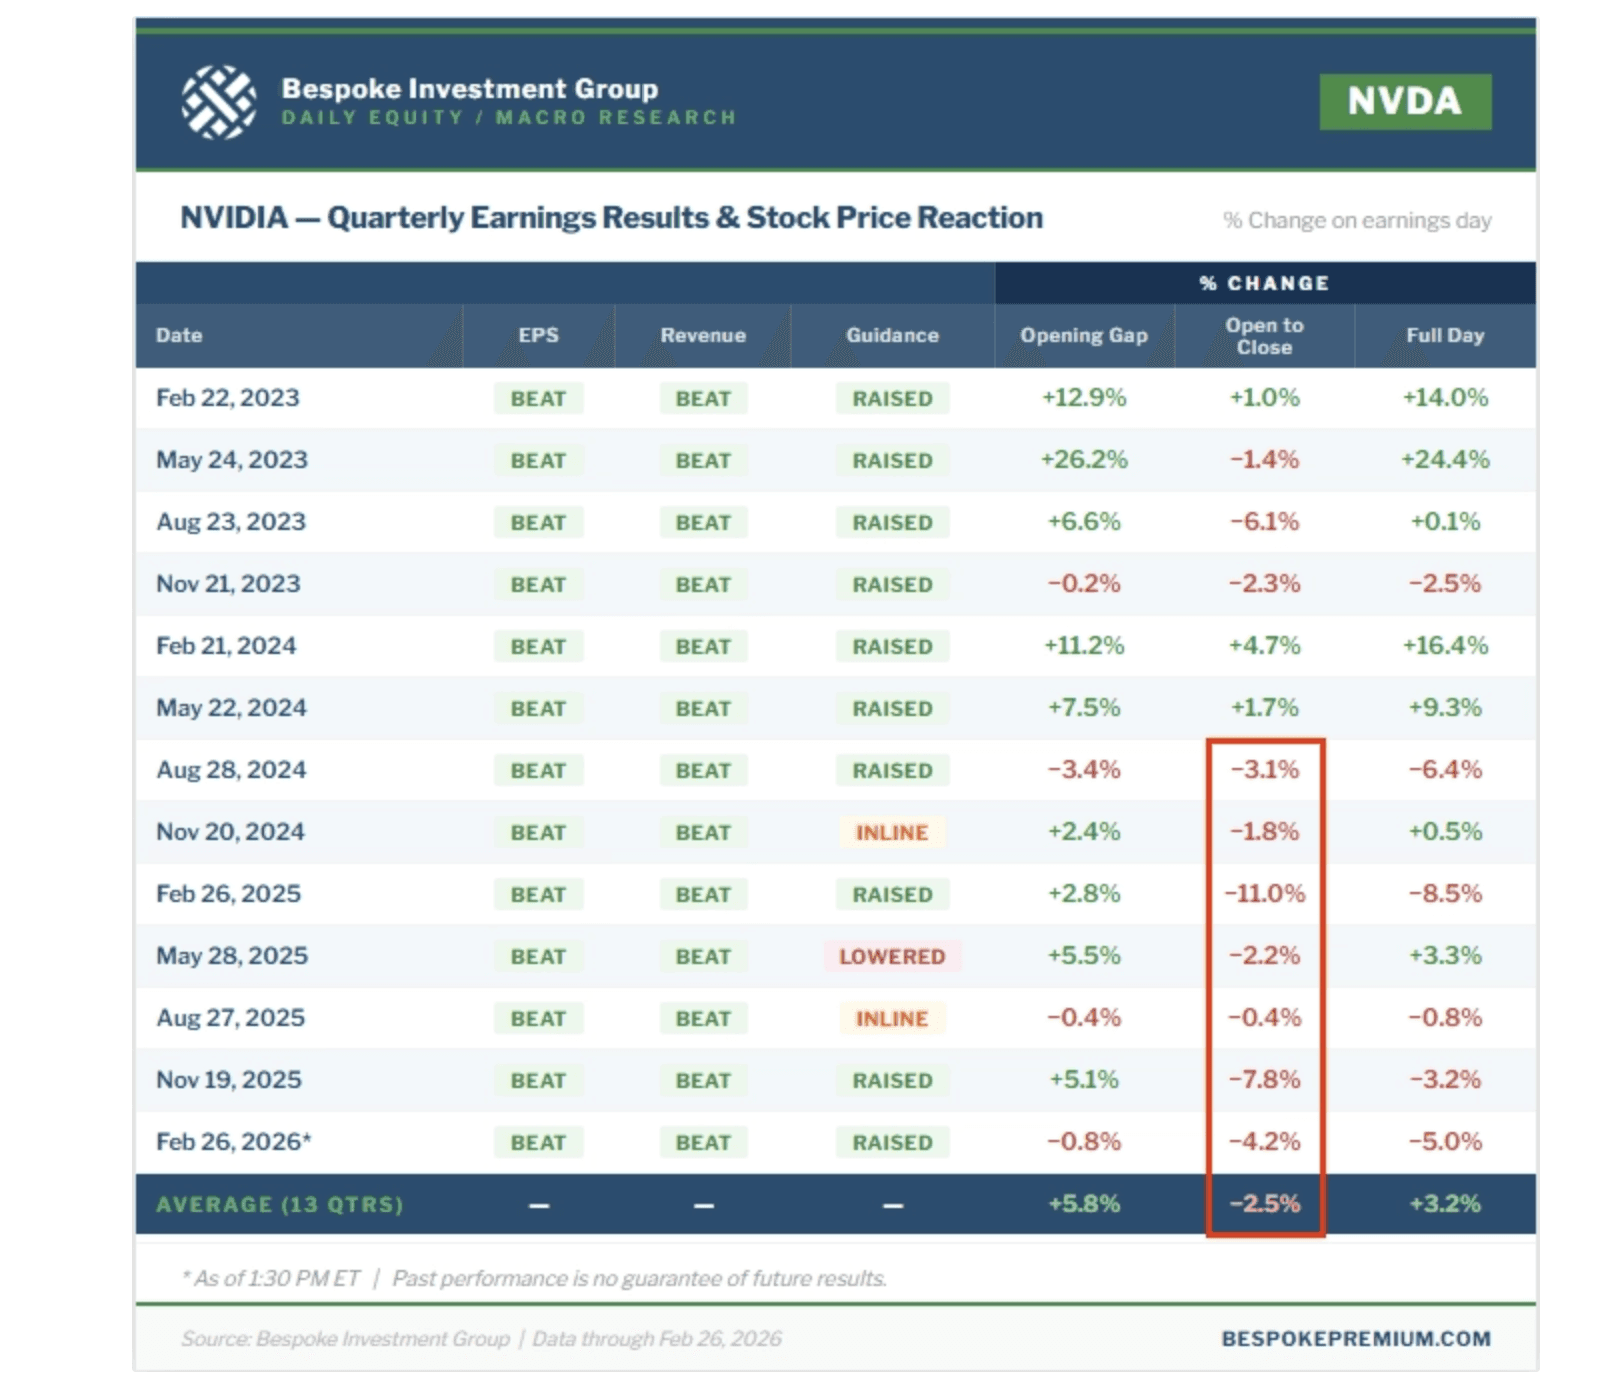
What is clear is that Nvidia stock has tripled over the past 2 years despite these strange post-earnings reactions. Nvidia is now growing at a 70%+ rate and trades at a forward P/E of about 22, which is roughly a market multiple while growing several times faster than almost any other large company.
If Nvidia keeps this up, the stock will take care of itself, just like it has over the past few years.
Still that doesn’t mean you just ignore risk management and hope for the best. Staying calm doesn’t mean being careless. Because irrational behavior can last way longer than you expect. Way longer than you can stay comfortable. And there will be a time where even companies like Nvidia go through 80%+ drawdowns. I know because I’ve lived through several of them.
Markets are often not rationale in the short term. Prices can stay unjust, overpriced, or underpriced for months or even years. You can be right on the facts and still lose money if the timing is off. That’s the part people underestimate. And risk management is what keeps you alive during those periods.
There are a few ways to manage risk.
The first is position sizing. This means never letting a single position get so large that it can seriously hurt the portfolio if it goes wrong. Even great ideas fail. Keeping positions at a reasonable size makes sure one mistake does not take you out of the game. That’s why I’m a big proponent of adjusting (adding and trimming) positions accordingly.
The second is knowing when you are wrong. Every investment should start with a clear thesis and clear reasons for when to sell. If the facts change or the scenario didn’t play out, the position should be reduced or exited. The goal is not to be right every time. That’s impossible anyway. You should always plan for the worst case. leaning into positions that are working and when they are working. At the same time, it means cutting back exposure when something is not working, rather than hoping it turns around.
And the third is separating long-term and short-term positions. Long-term positions are based on multi-year trends, big-picture ideas, and secular growth trends. They are meant to ride through volatility and short-term noise. Short-term positions are different. They are driven by timing, sentiment, or specific catalysts and need to be managed more actively. Most people get into trouble when they mix these two up. Long-term positions get panic sold because of short-term price moves, or short-term trades are held too long and turn into long-term mistakes.
Lin
Weekly Market Update: The Grand Finale
It was a short trading week, but it certainly wasn’t a boring one. The S&P 500 was up 1.1%, and the Nasdaq gained 1.5%. That made it the best week for both since January 9. The Nasdaq also finally snapped a 5 week losing streak.
The big moment came on Friday. The Supreme Court struck down one of President Trump’s tariff plans, and that was enough to get buyers back into the market. Trump later announced a new 10% global tariff, which the markets largely ignored.

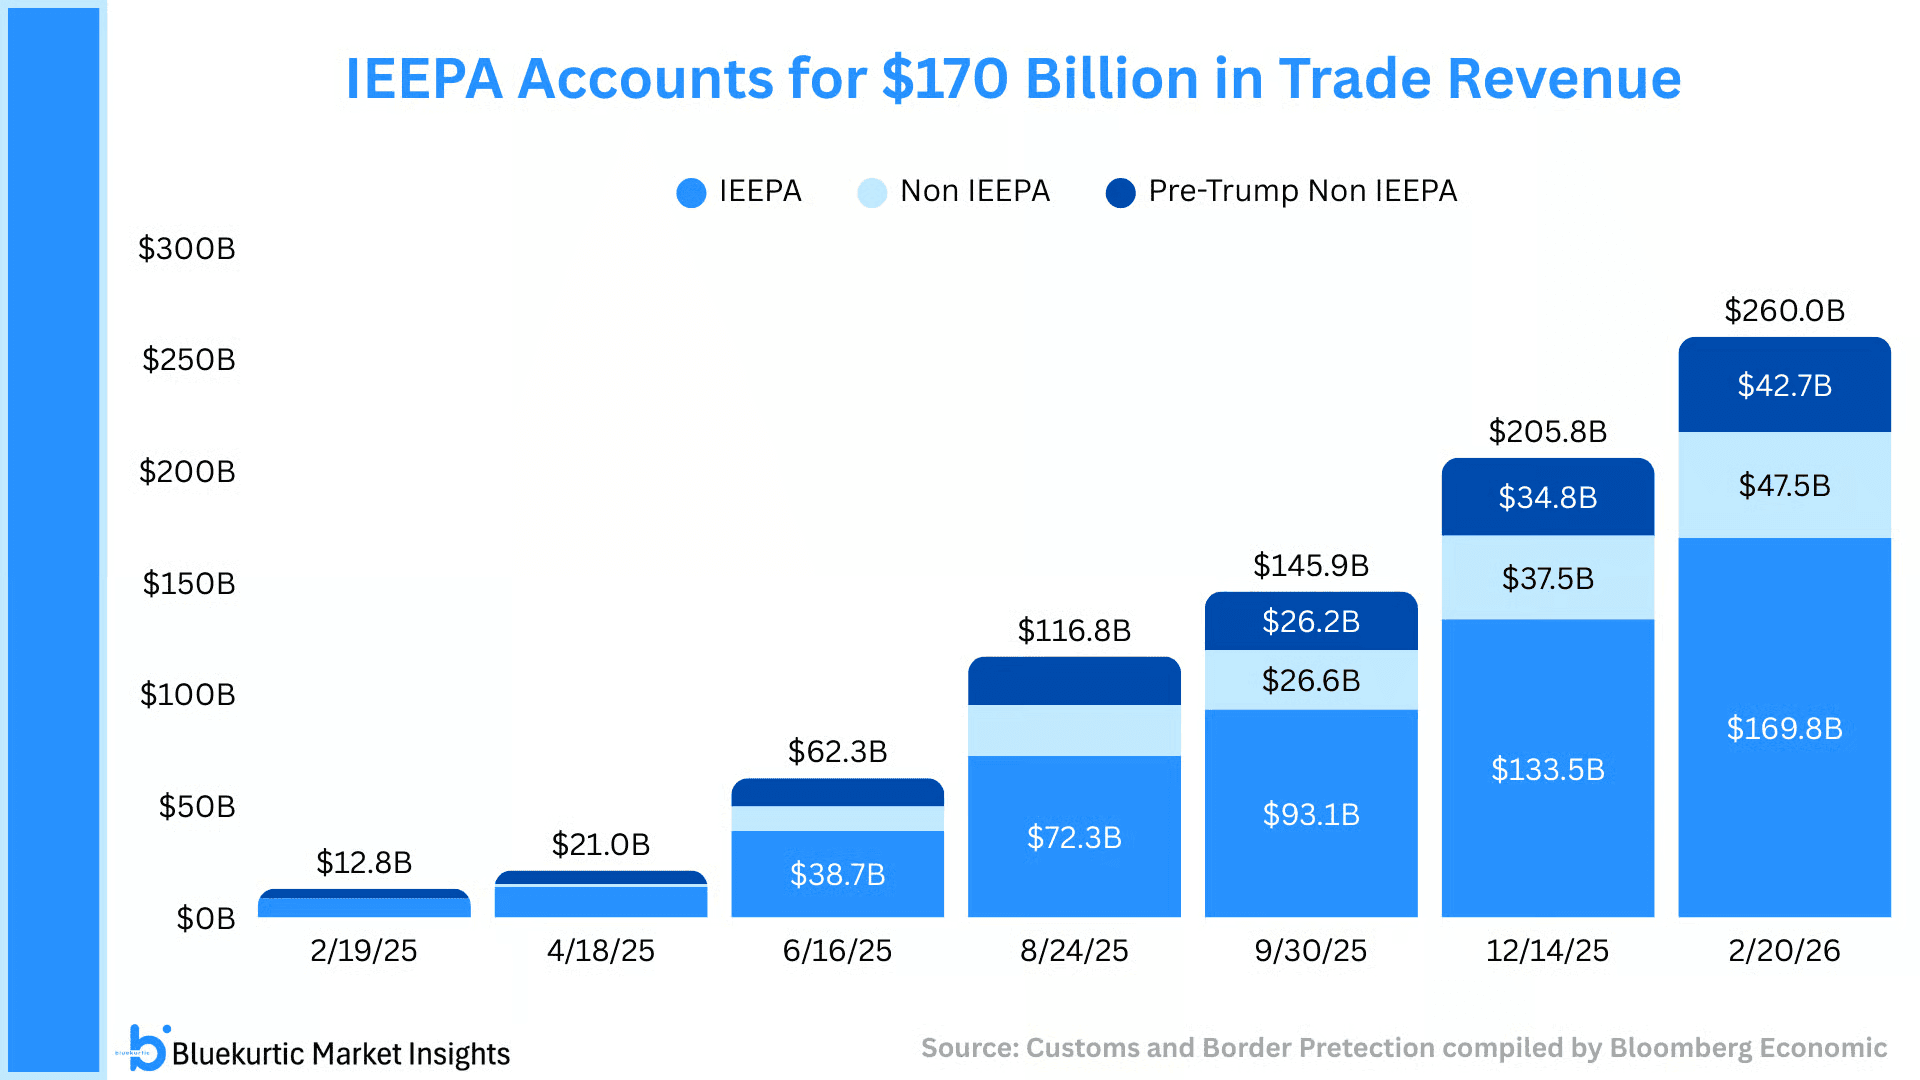
With the Supreme Court ruling the IEEPA tariffs imposed by President Trump illegal, the administration now faces up to $170B in potential tariff refunds. Over 1,500 companies have already filed trade court claims to secure their place in line.
On the upside, there is an immediate reprieve from current tariffs, which could act like a temporary tax cut for businesses. On the downside, any tariffs imposed under these other statutes are more likely to stick. But the administration has several other tools it can use to re-impose similar tariffs, but those will take time.
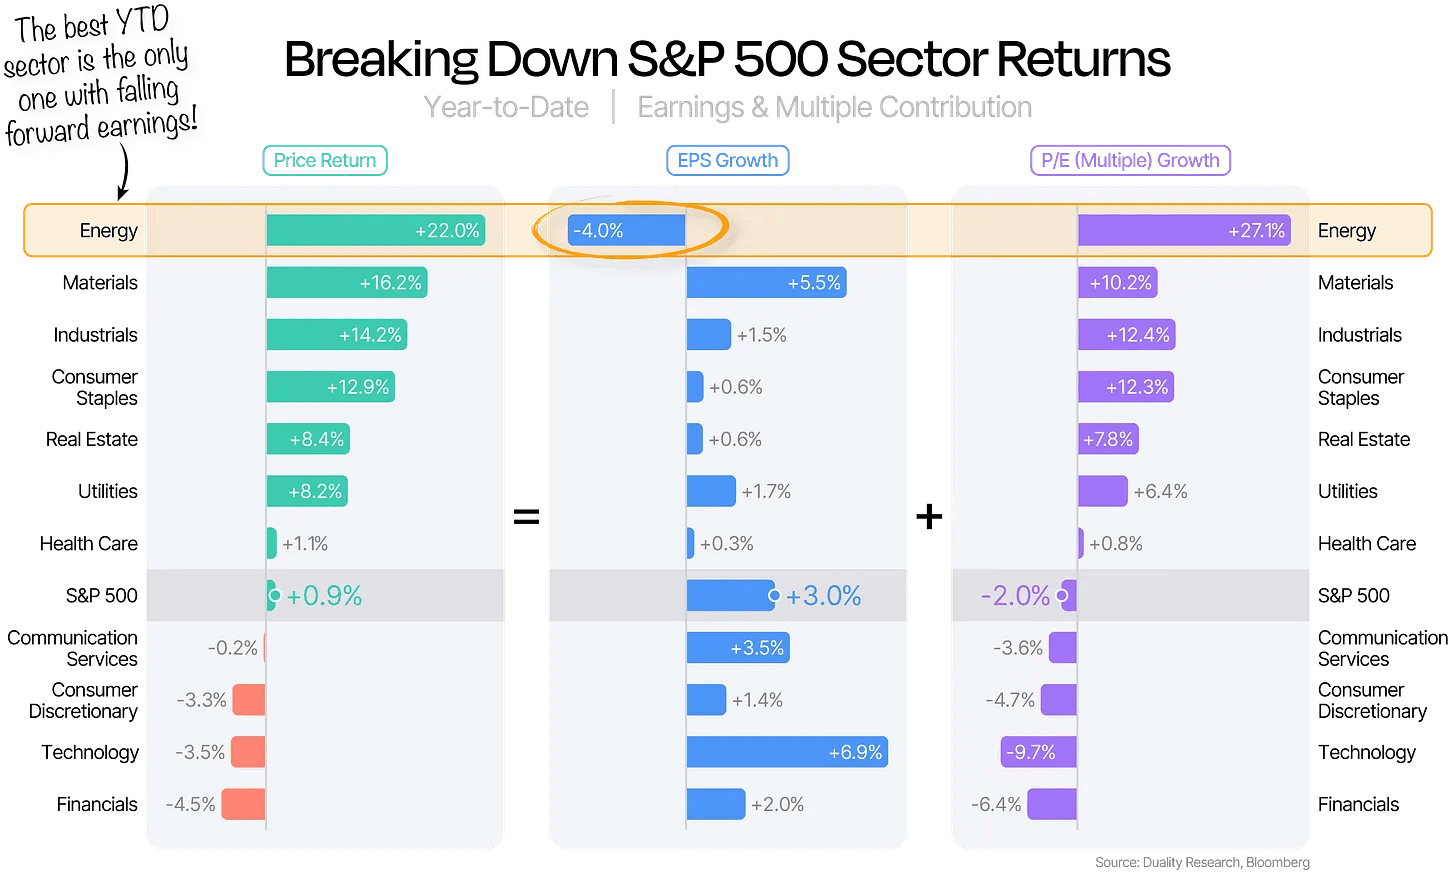
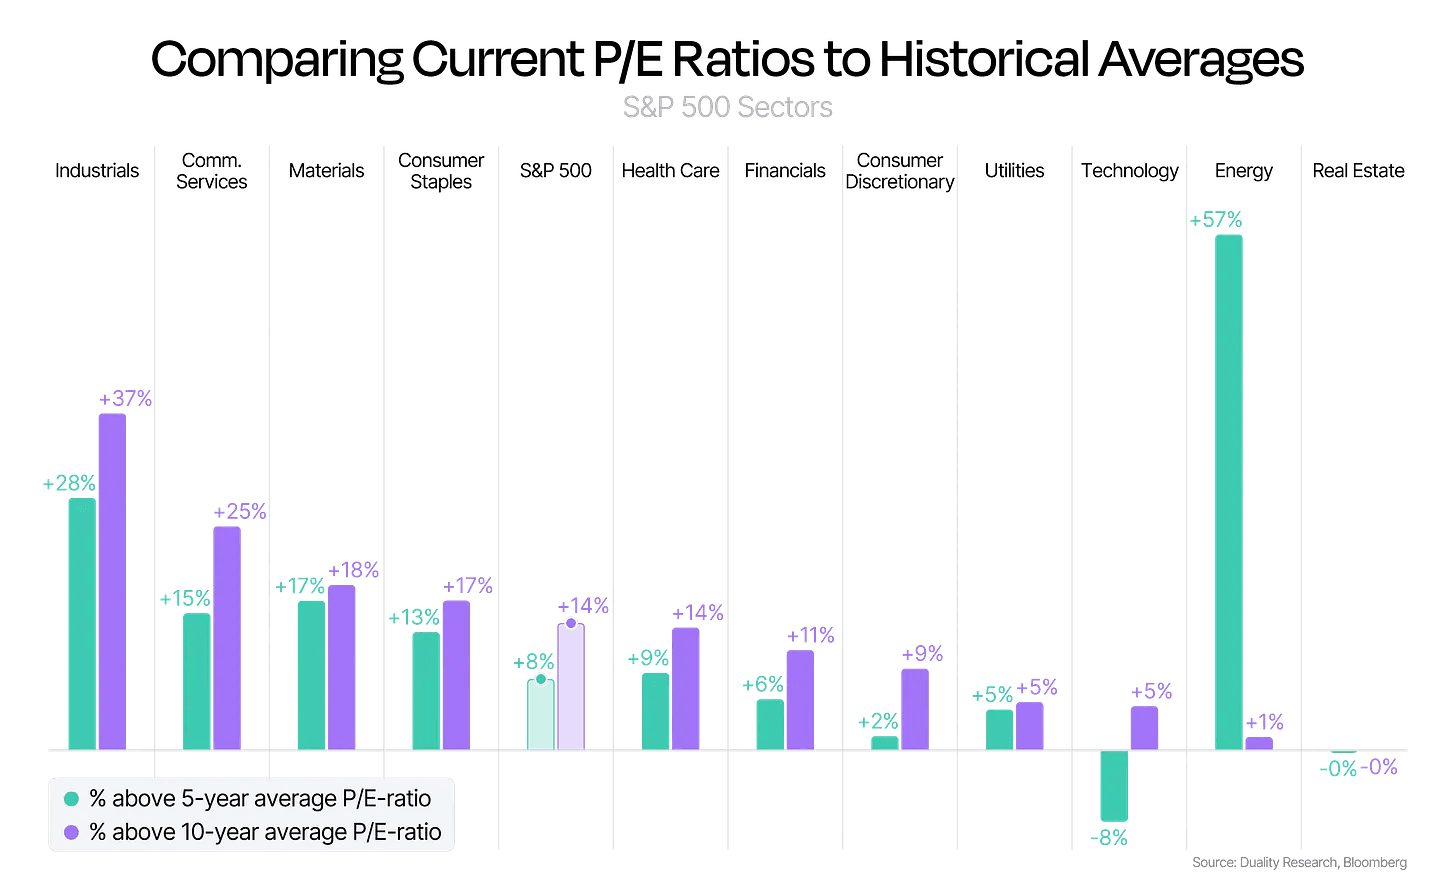
Energy is the best performing sector this year.
This the best start to a year over the past 25 years for the energy sector. However, the irony is that it’s the only sector with negative earnings growth.
Meanwhile, The worst performing sector are financials.
I don’t like to see energy leading bull markets. Financials lead new bull markets. They don’t lag. The financial sector is traditionally the first sector to lead a new market move. Energy is traditionally the last.
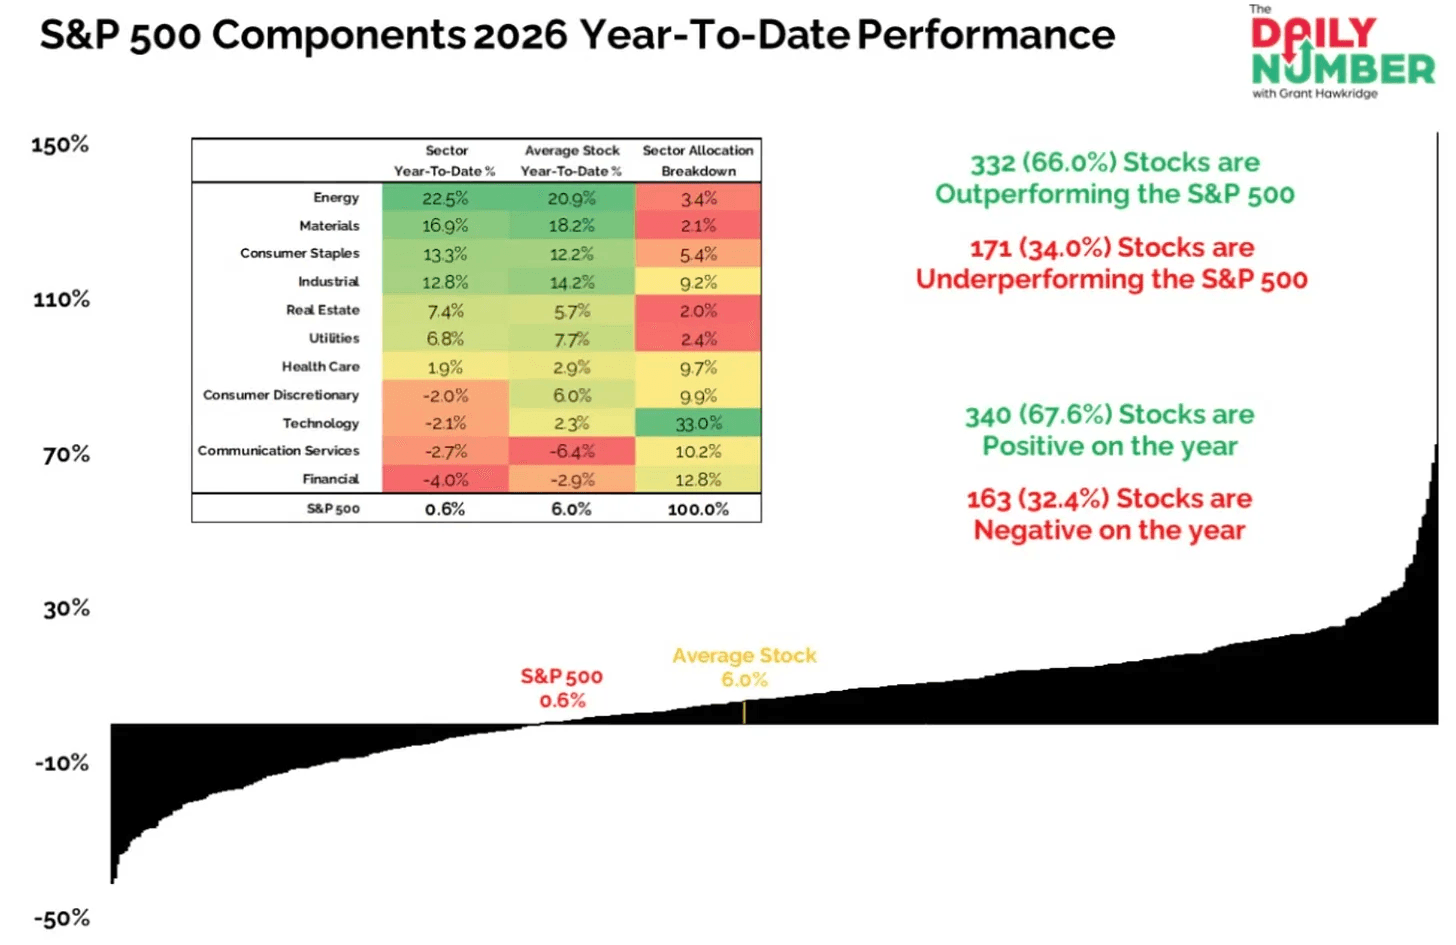
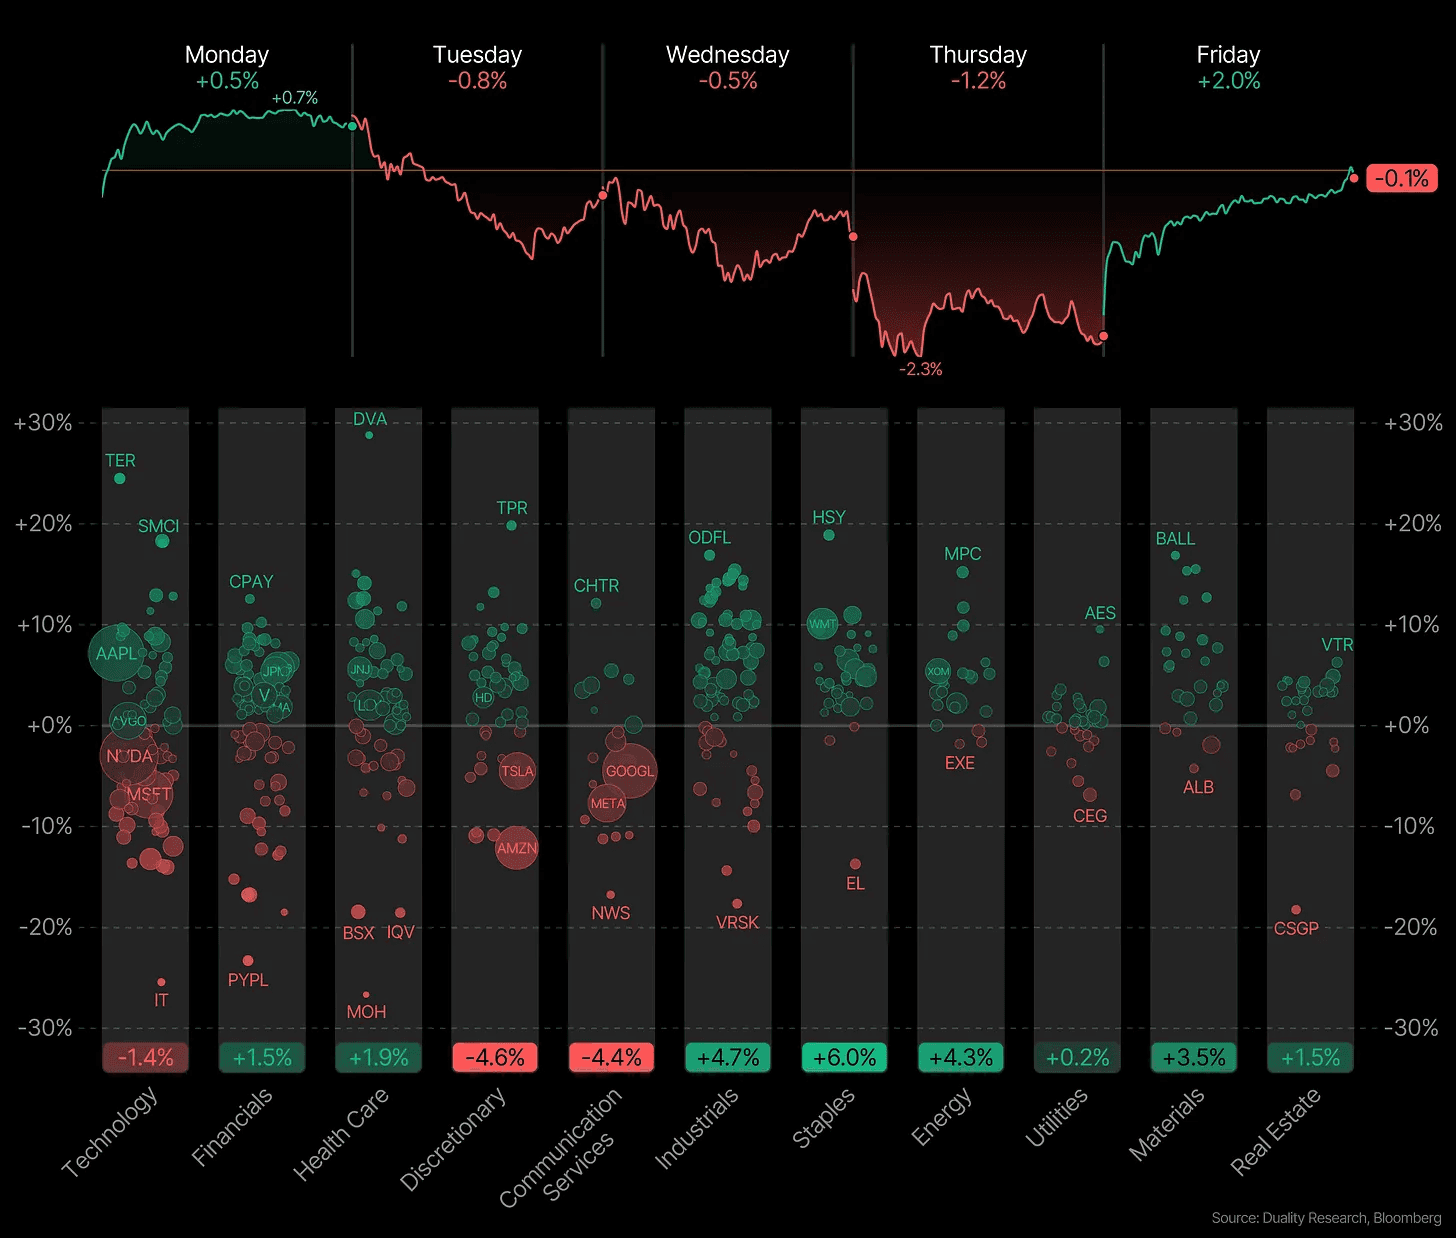
The S&P 500 is basically flat on the year.
But if you are only watching the index, you are missing most of the action.
In fact, The average stock in the index is up 6.0% in 2026. About two-thirds of S&P 500 stocks are positive on the year, and two-thirds are actually outperforming the index itself.
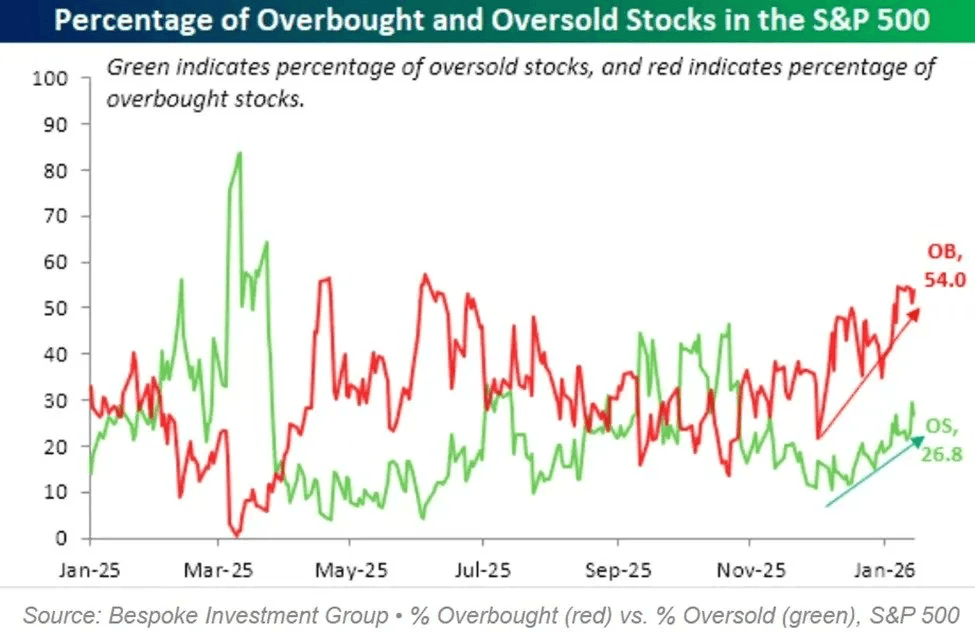
54% of S&P 500 stocks are currently overbought, which is the highest percentage since June 2025. At the same time, 27% of names are oversold, the highest level since October.
Normally, when a lot of stocks are overbought, very few are oversold. And when many are oversold, very few are overbought. They usually move in opposite directions. Right now, both are high at the same time. That means many stocks are being aggressively bought while many others are being aggressively sold.
It shows the market is very bifurcated, emotional, and volatile.
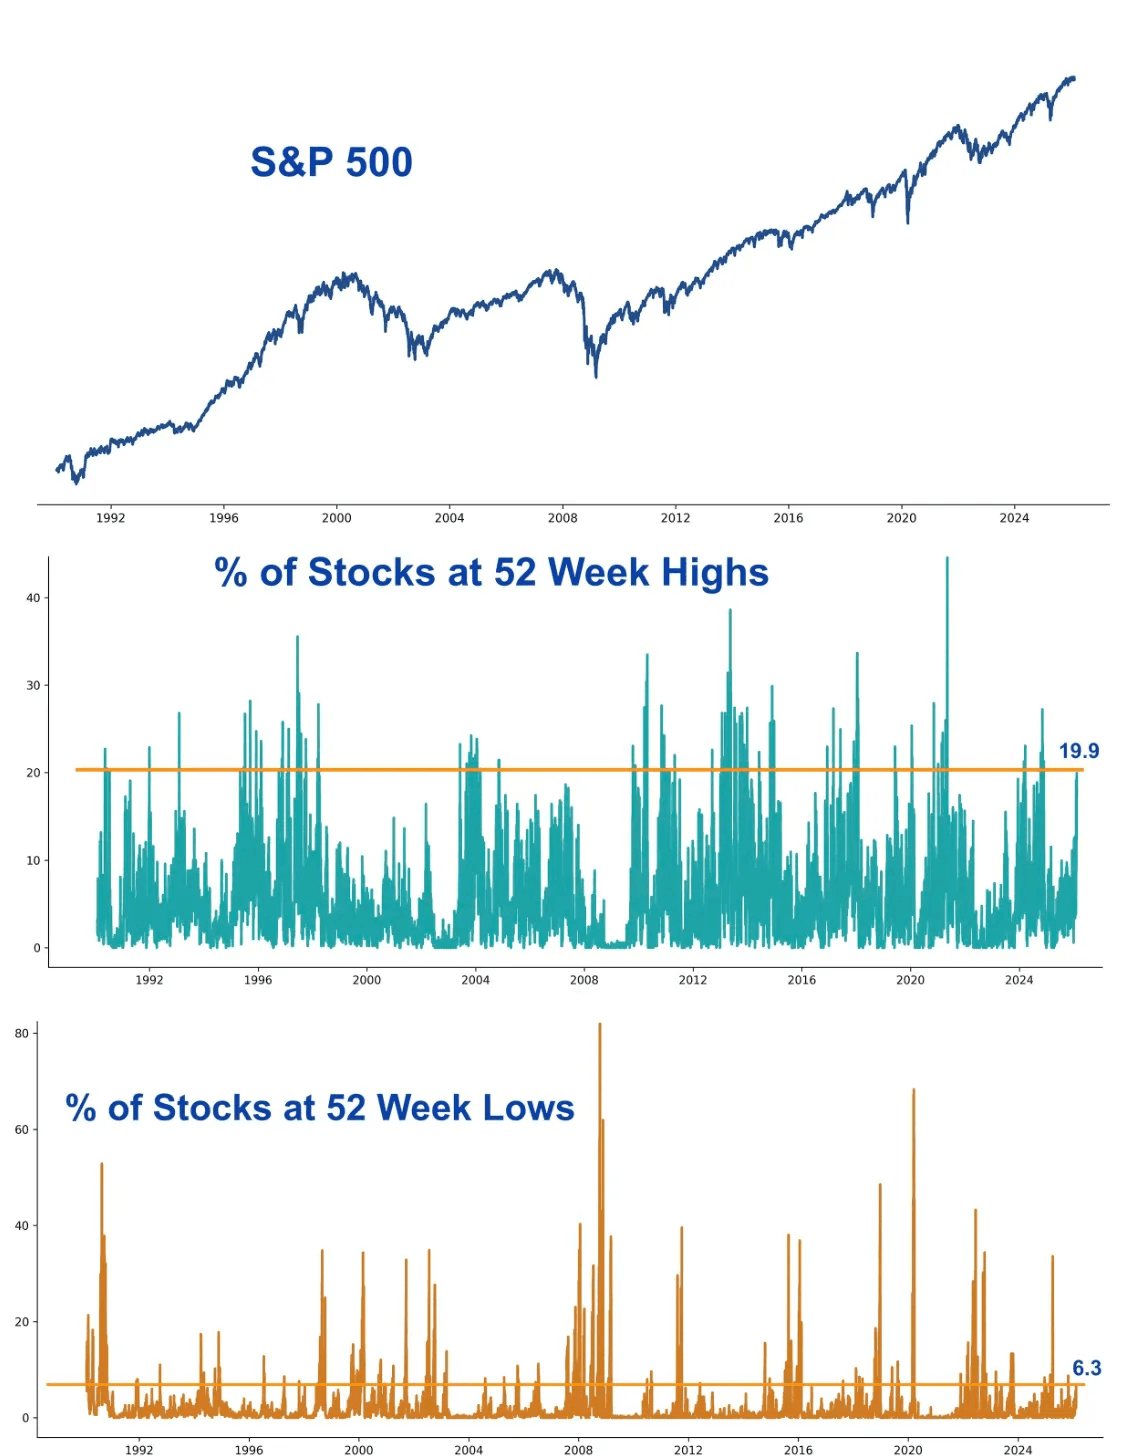
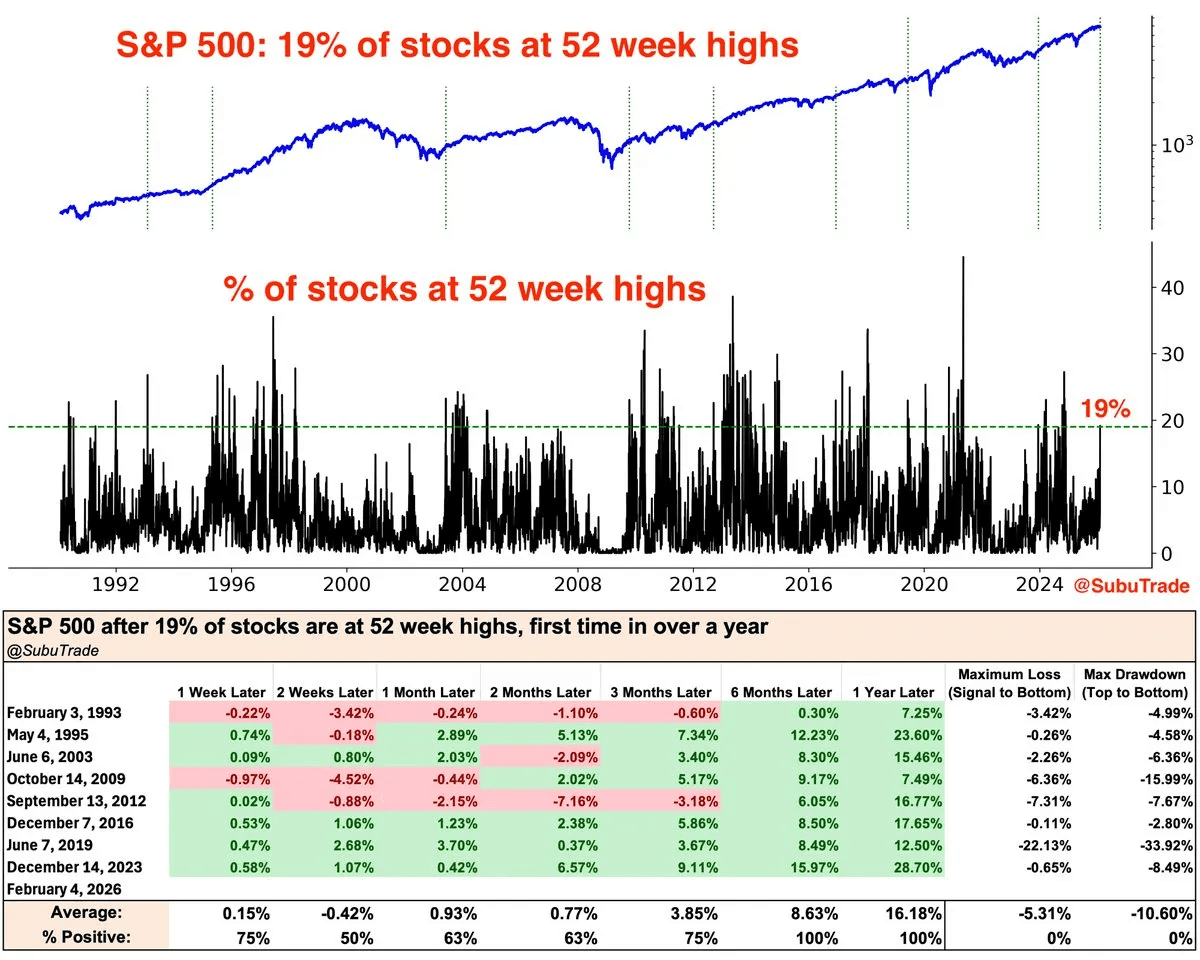
Perhaps the most unusual data point is this. Nearly 20% of S&P 500 stocks are at 52-week highs, while 6.3% are at 52-week lows at the same time. It’s incredibly rare to see such an extreme divide.
The big question is how long this can last. Broad participation is a good thing, but the index still depends on its biggest names. Right now, the megacaps are mostly on the sidelines. But tech stocks make up more than 40% of the S&P 500, and most of them down on the year. That is a lot of weight for the rest of the market to carry.
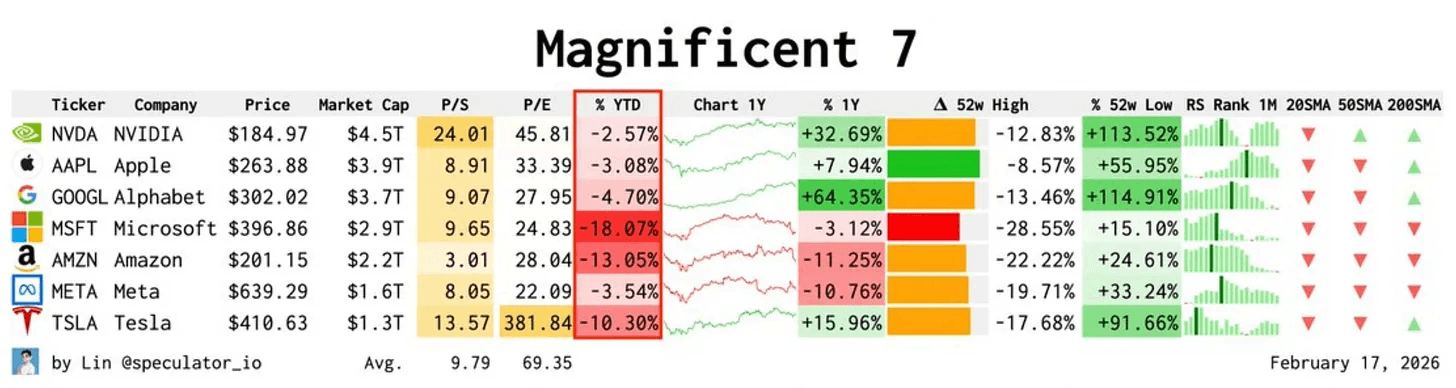
Here’s a number that really puts things in perspective. All 7 members of the Magnificent 7 are negative on the year right now. That does not happen often.
The last time this happened was March 2025, after the tariff announcement. Before that, you have to go back to 2022, when the group sold off hard during the Fed’s aggressive rate hikes.
The S&P 500 will continue to struggle, if the Mag 7 don’t start to turn around.
The $MAGS ETF holds only the Mag 7 stocks and T-Bills. Because of that, it is a clean way to see how the Mag 7 are doing compared to the rest of the market. Right now, it is sitting at a key inflection point right at the 200-day moving average. This is the make or break moment.

Valuations have also come down a lot. The Mag 7’s forward P/E has dropped from nearly 32 a year ago to 25.8 today. Still not cheap, but a much more reasonable entry point than where this group was trading at its peak.

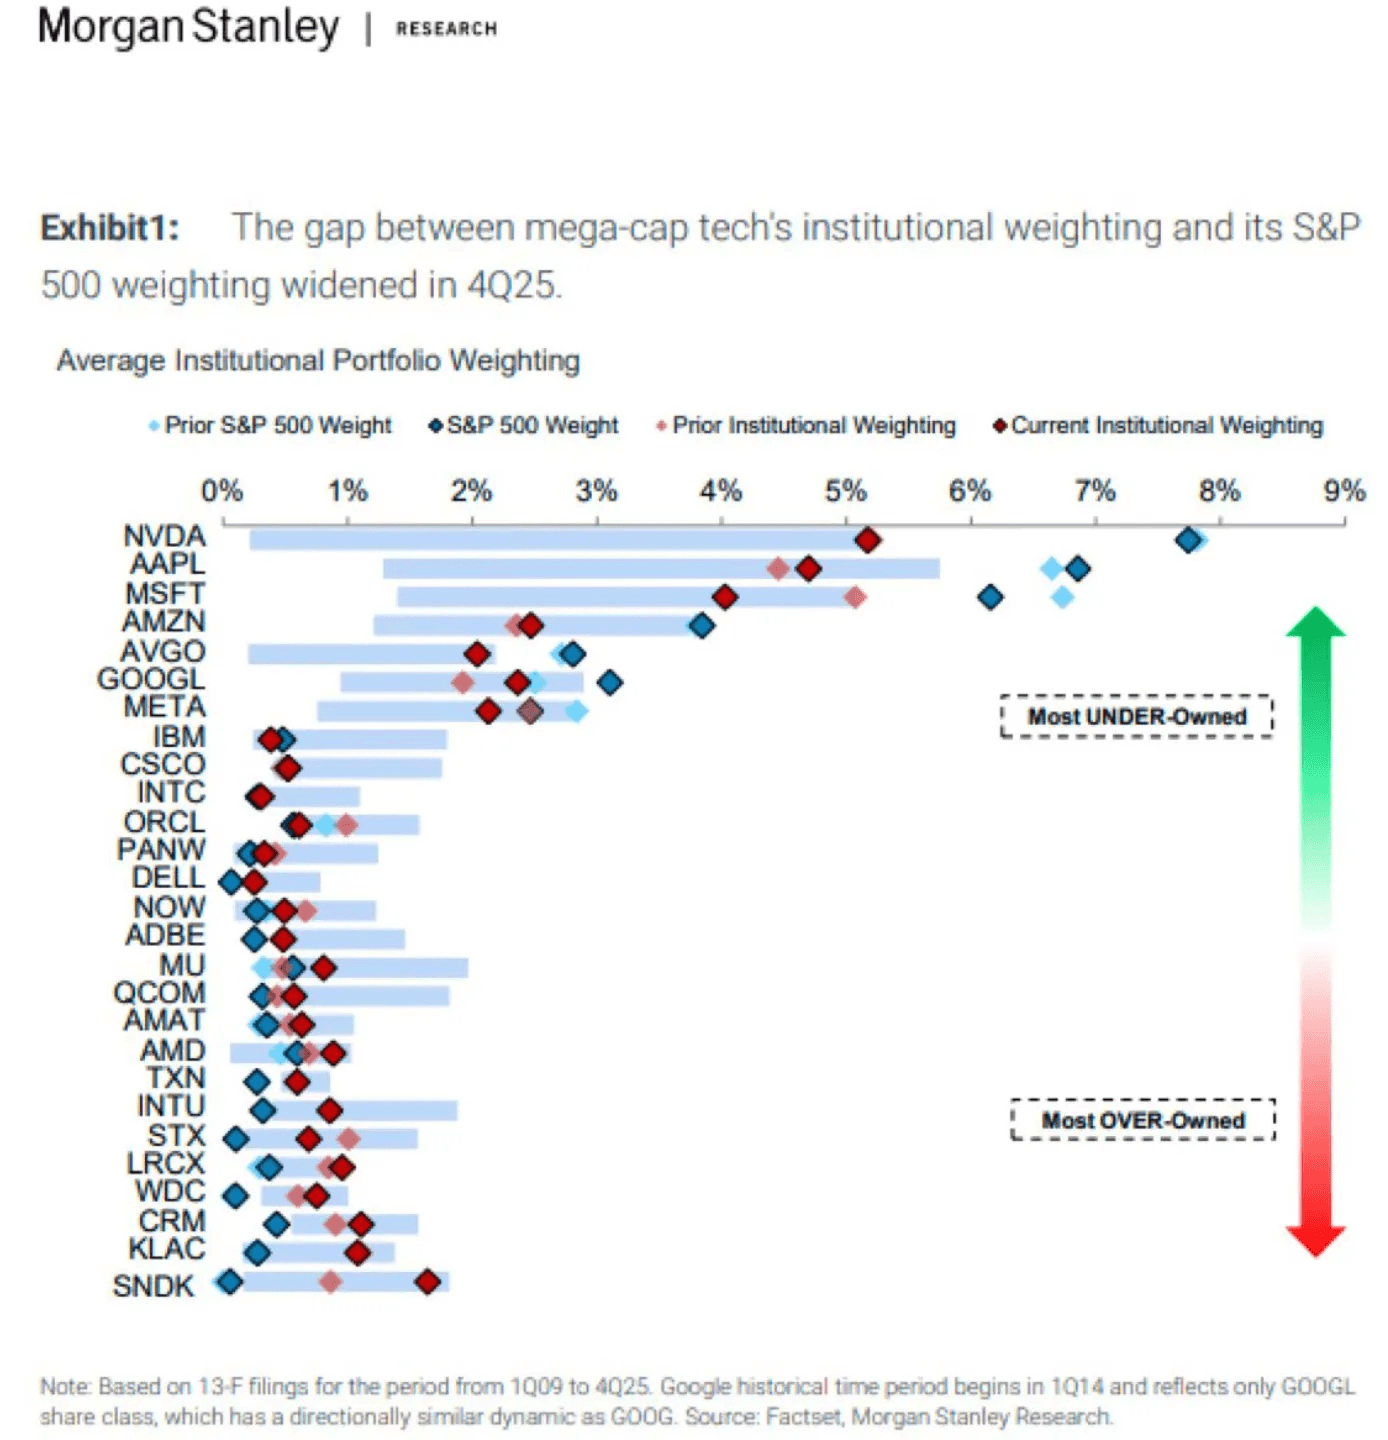
And perhaps most telling. According to Morgan Stanley, mega-cap tech is now the most underowned it has been in 17 years. At the top of the list is Nvidia. This will be very interesting going into next week.
This is the grand finale of earnings.
To start, we have Nvidia, the most important stock in the market. I expect a strong beat and raise quarter with very bullish commentary. The capex numbers we have heard from almost every company have blown away expectations, and most of that money is flowing straight to Nvidia.
The reaction will be critical. If a big beat and raise is bought, that could be a major signal that there is still strong appetite for AI names. If not, it would be a major red flag in my view.

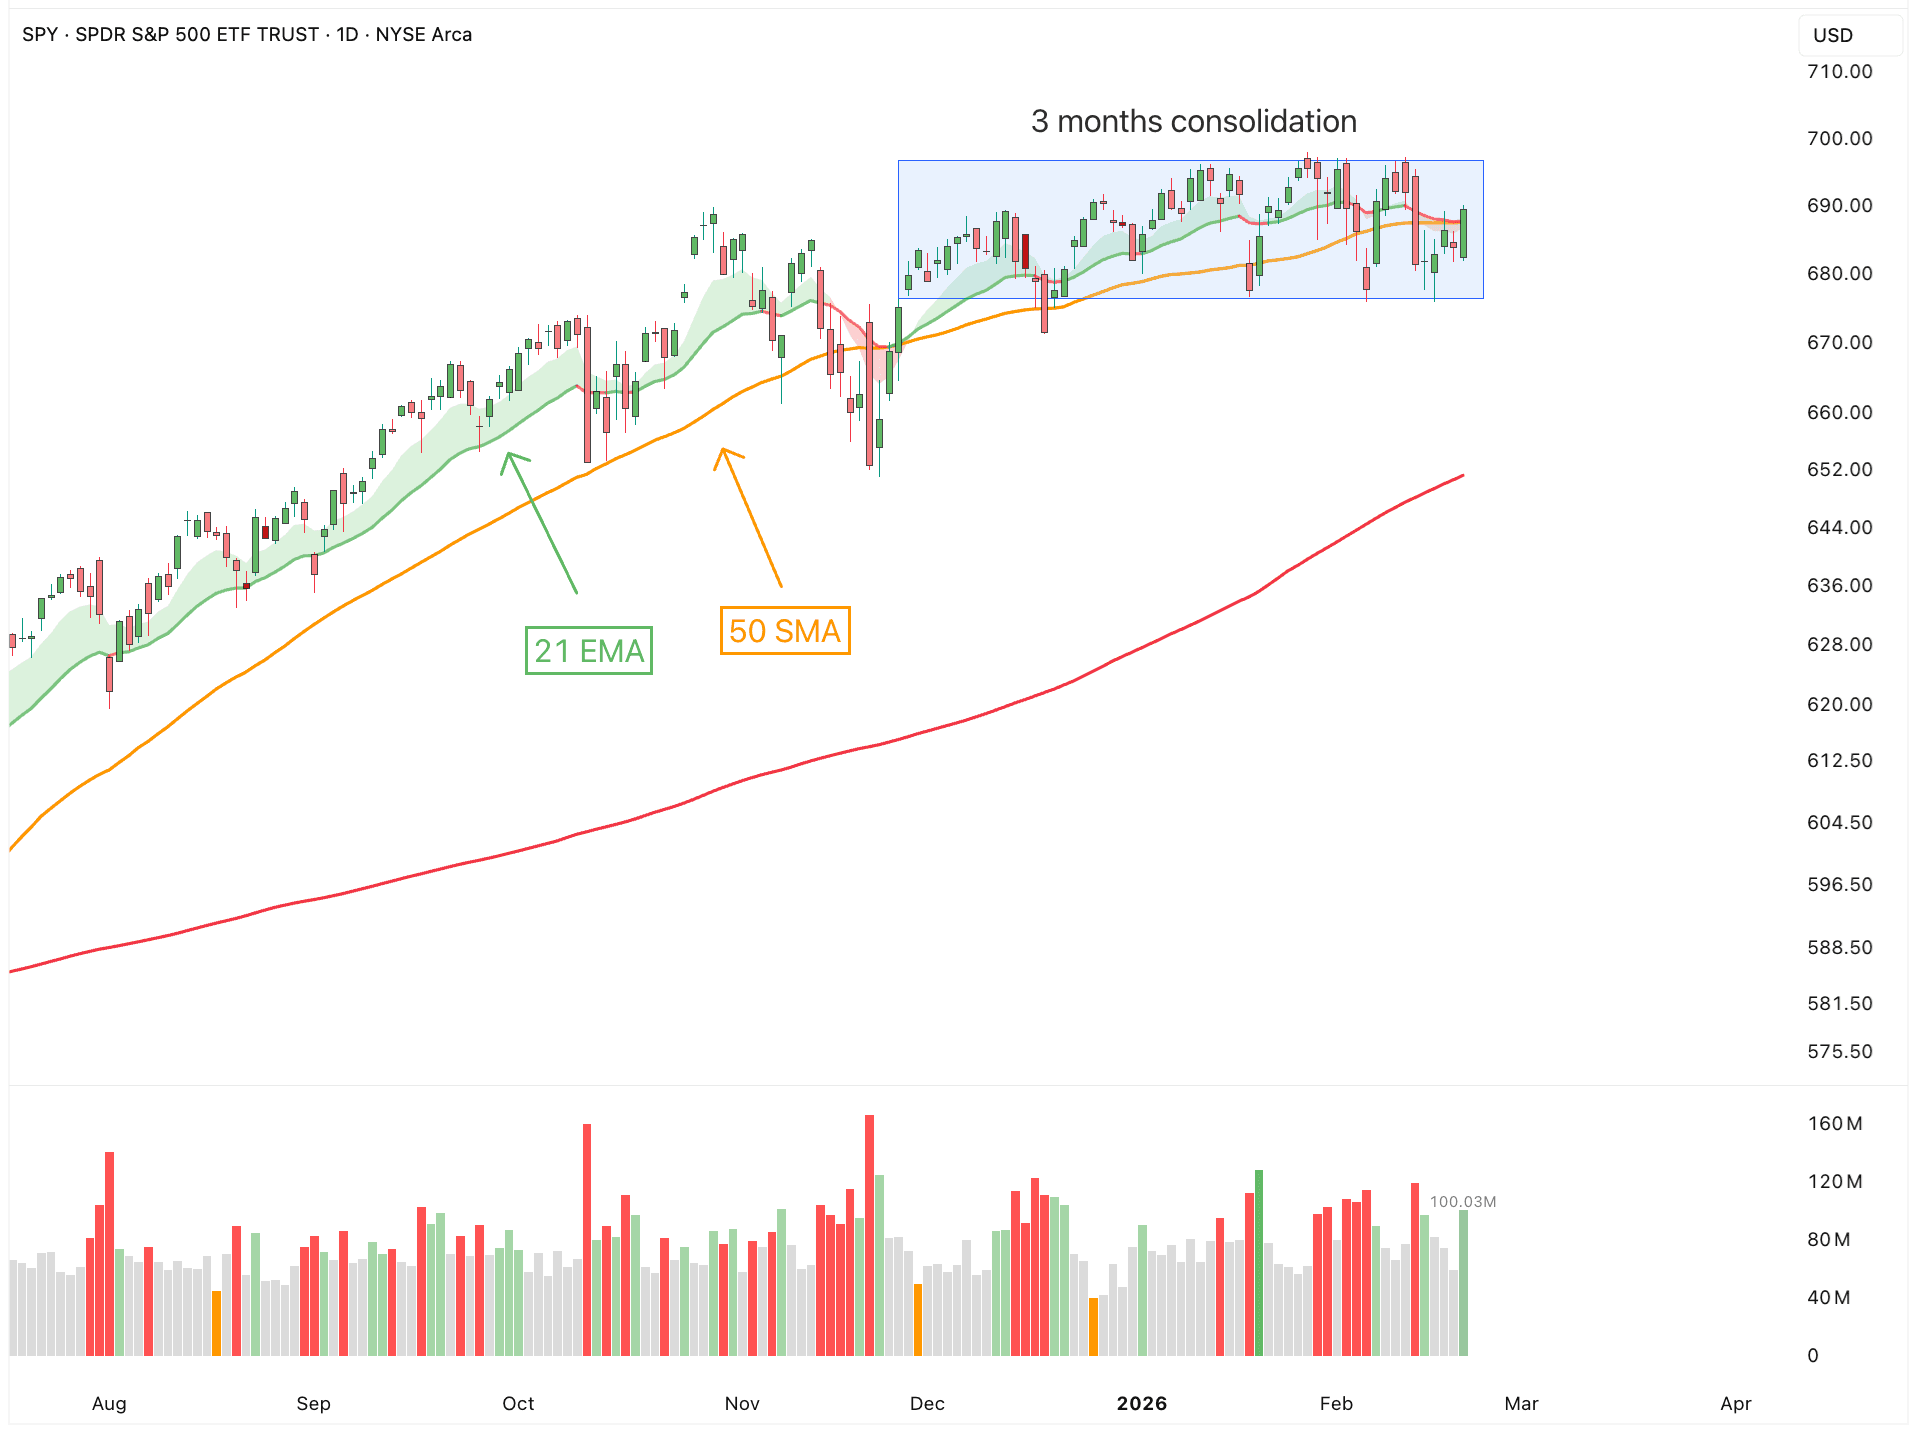
Nvidia’s earnings could very well be the next big catalyst for the market. For months, we have not made much progress. Since November, we have only seen a volatile, directionless market. This is not a supportive environment for most growth and momentum names. And there is really not much to do unless we get a clear direction, either way.
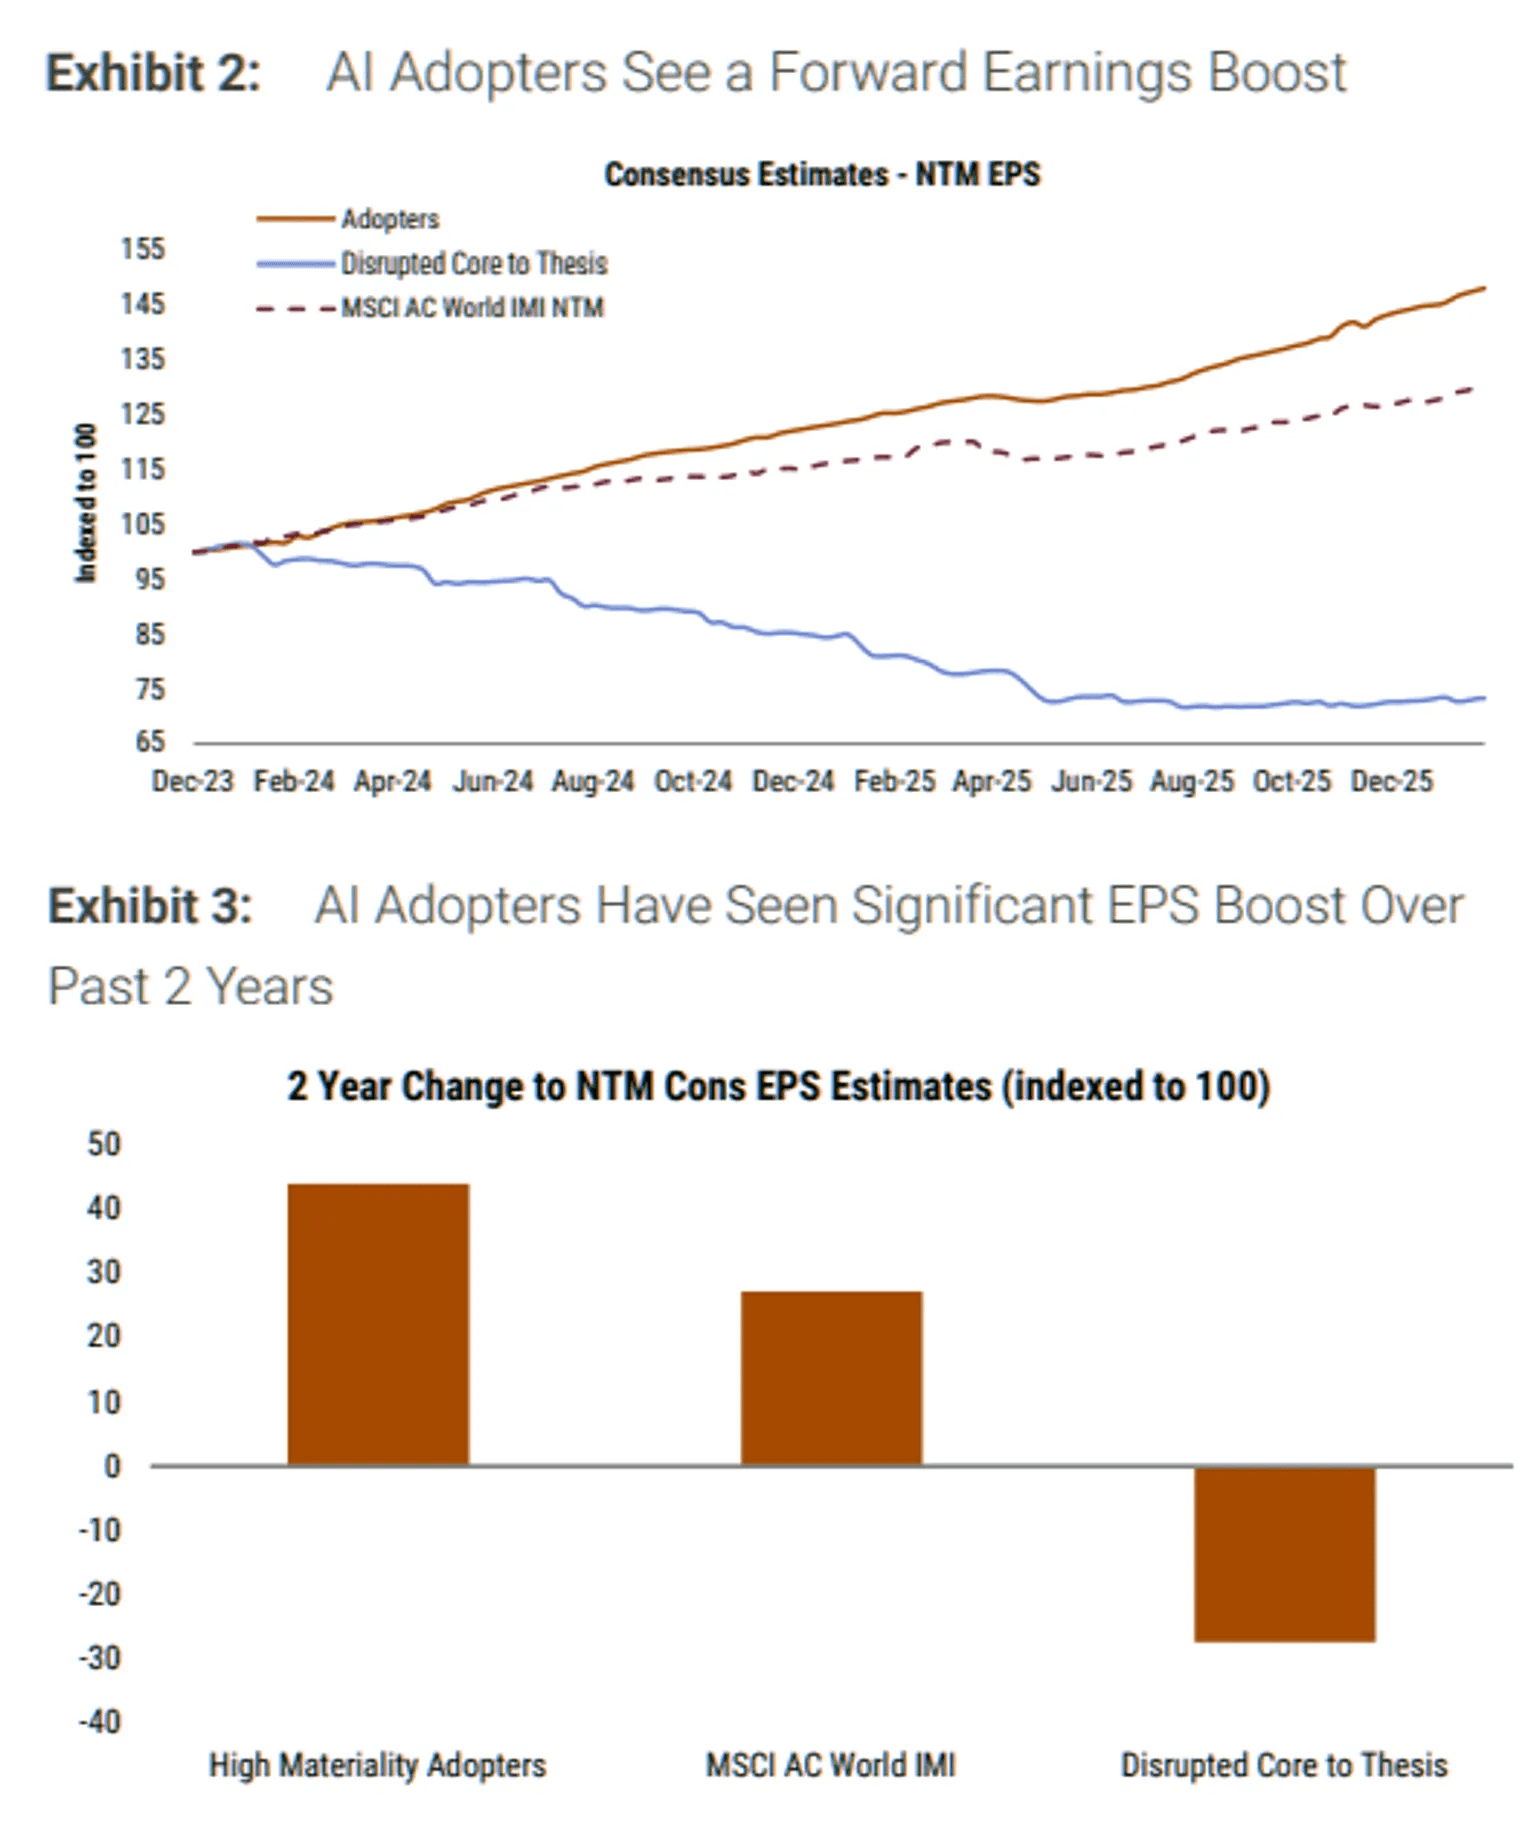
But whichever way it goes, it will continue to be critical to avoid sectors that are likely to be disrupted by AI and focus on the ones that will benefit. That divide is only getting wider. AI is not lifting the whole market. It is rewarding a small group of companies and pressuring others at the same time.
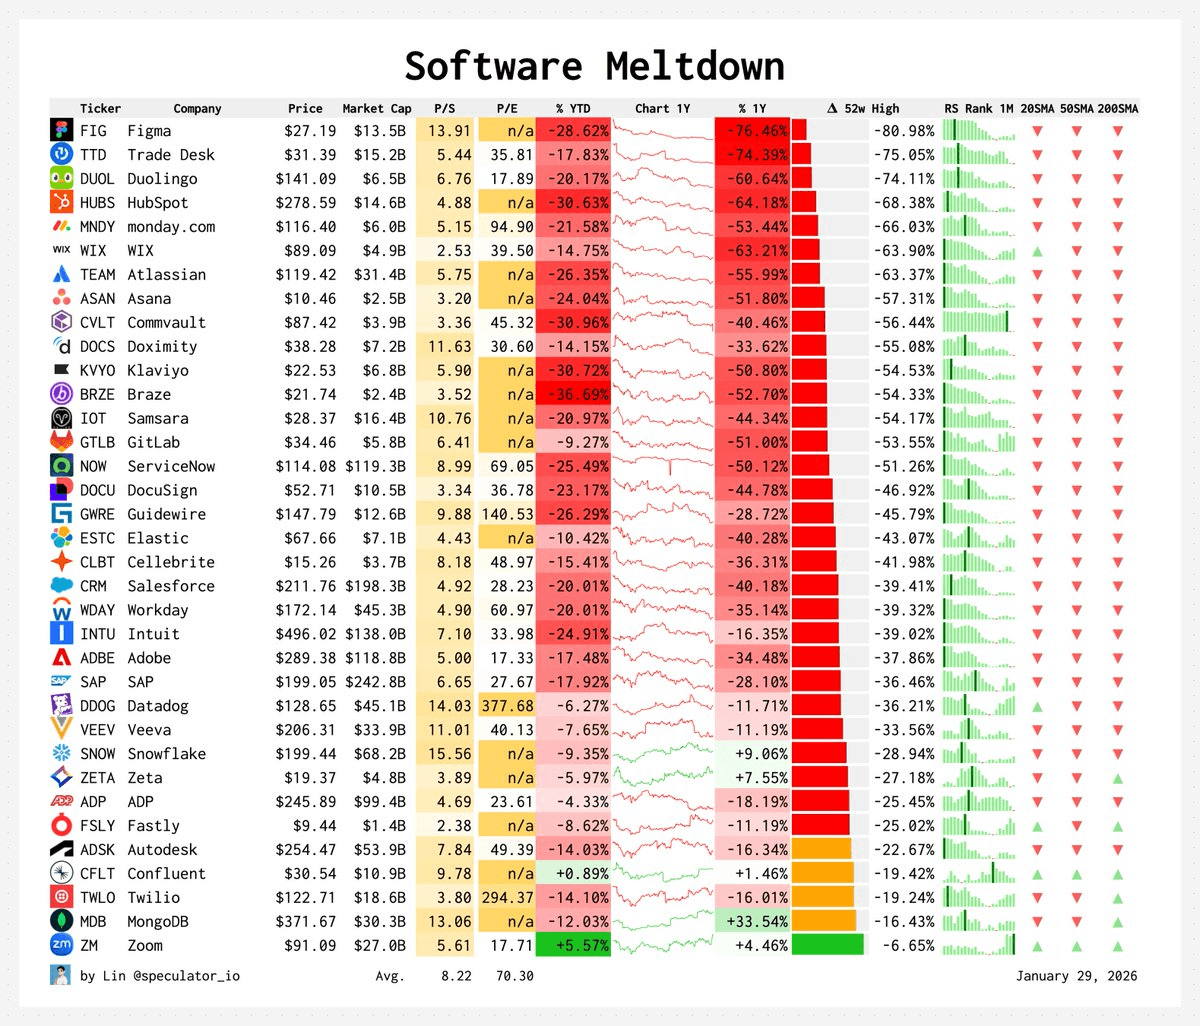
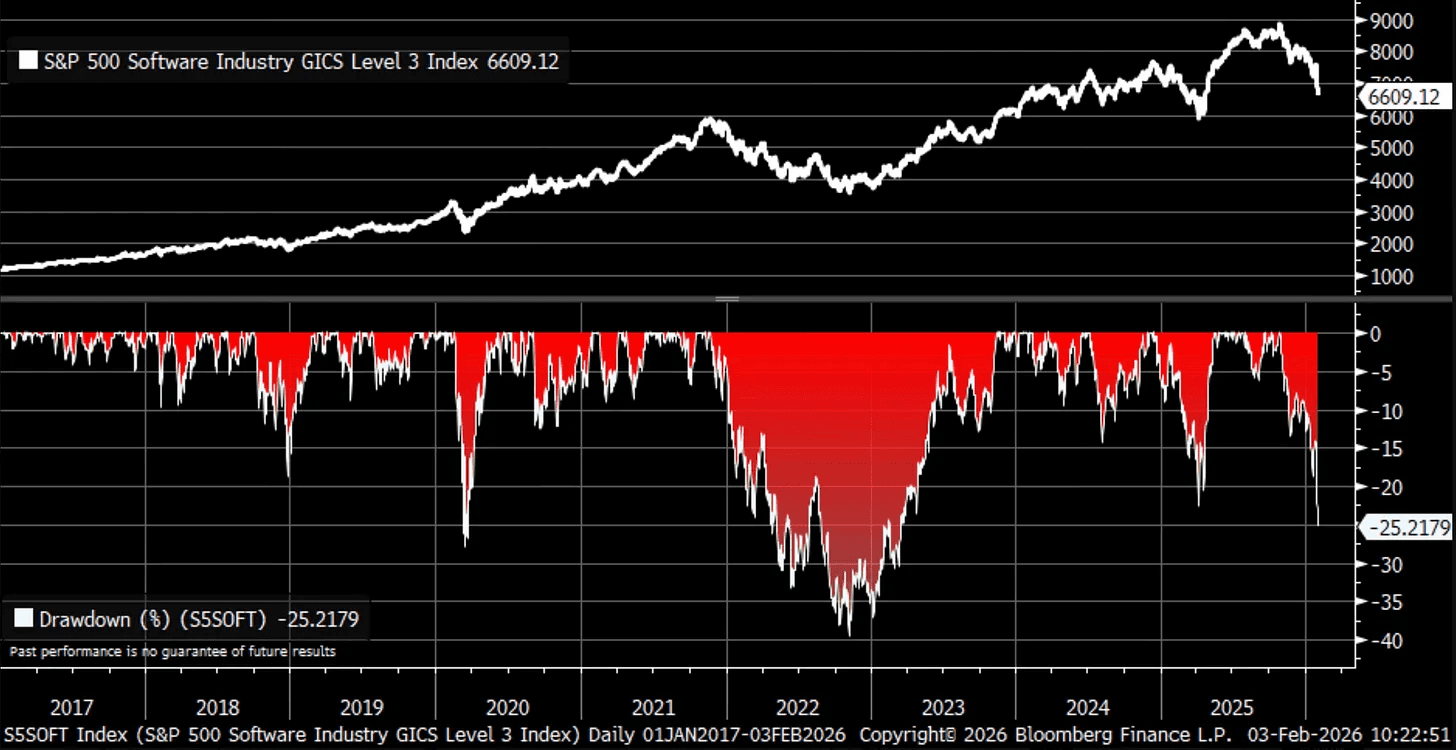
The software selloff has now reached a new low. Relative to the S&P 500, software stocks have been crushed all the way back to where they were trading at the peak of the dot-com bubble. That is not a typo.
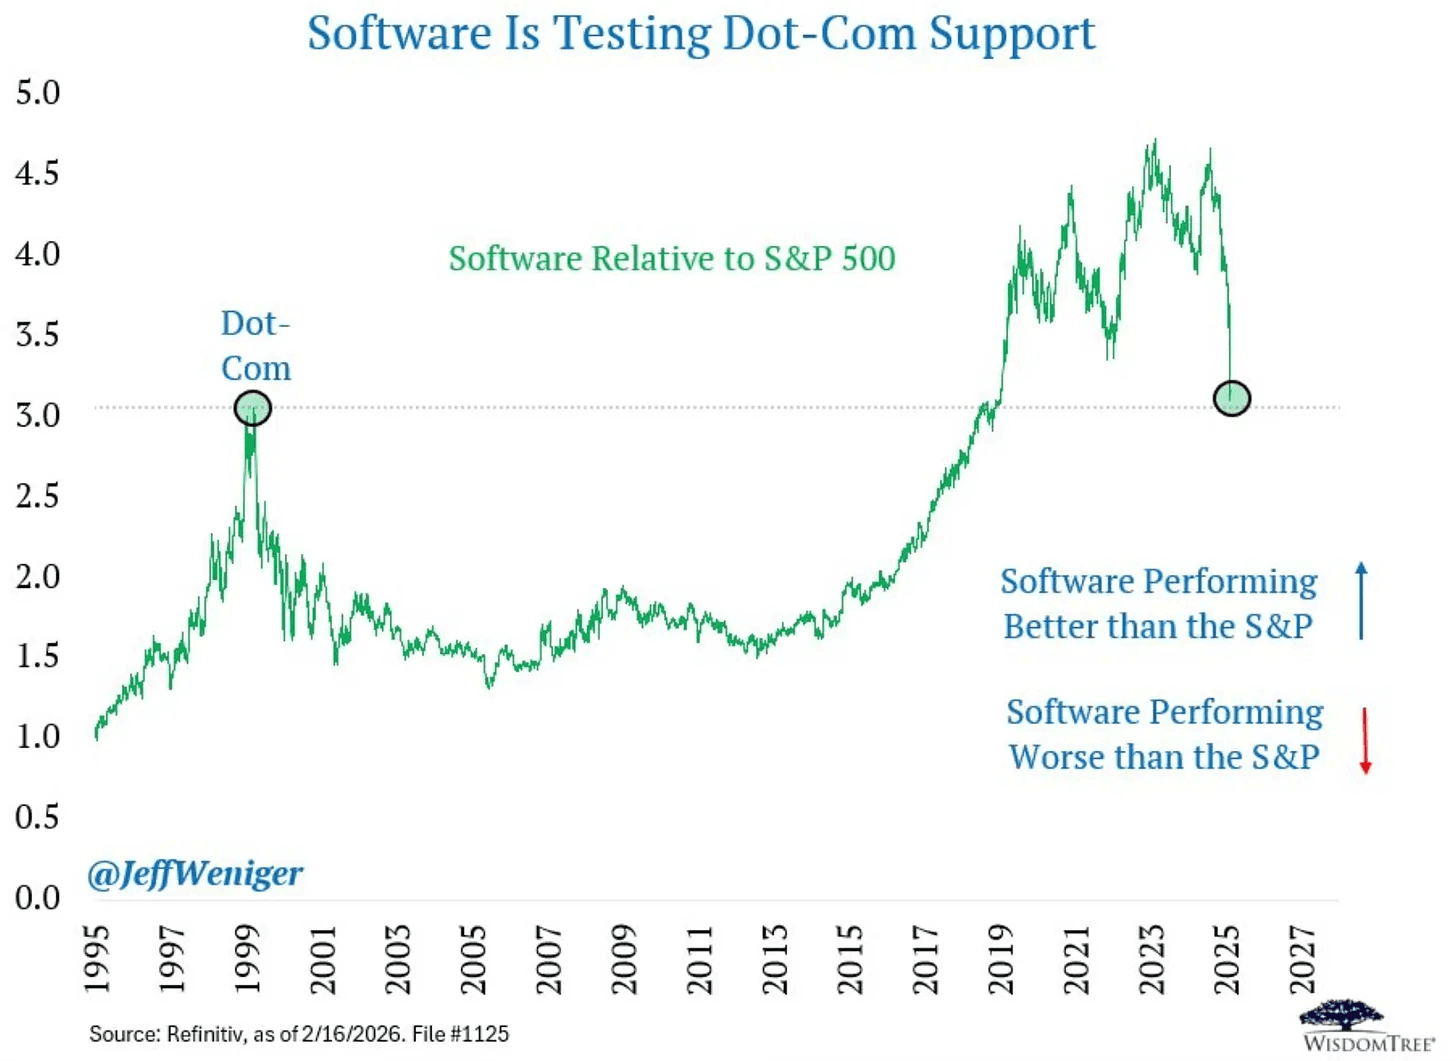
The selling in software is relentless, and it’s starting to spread.
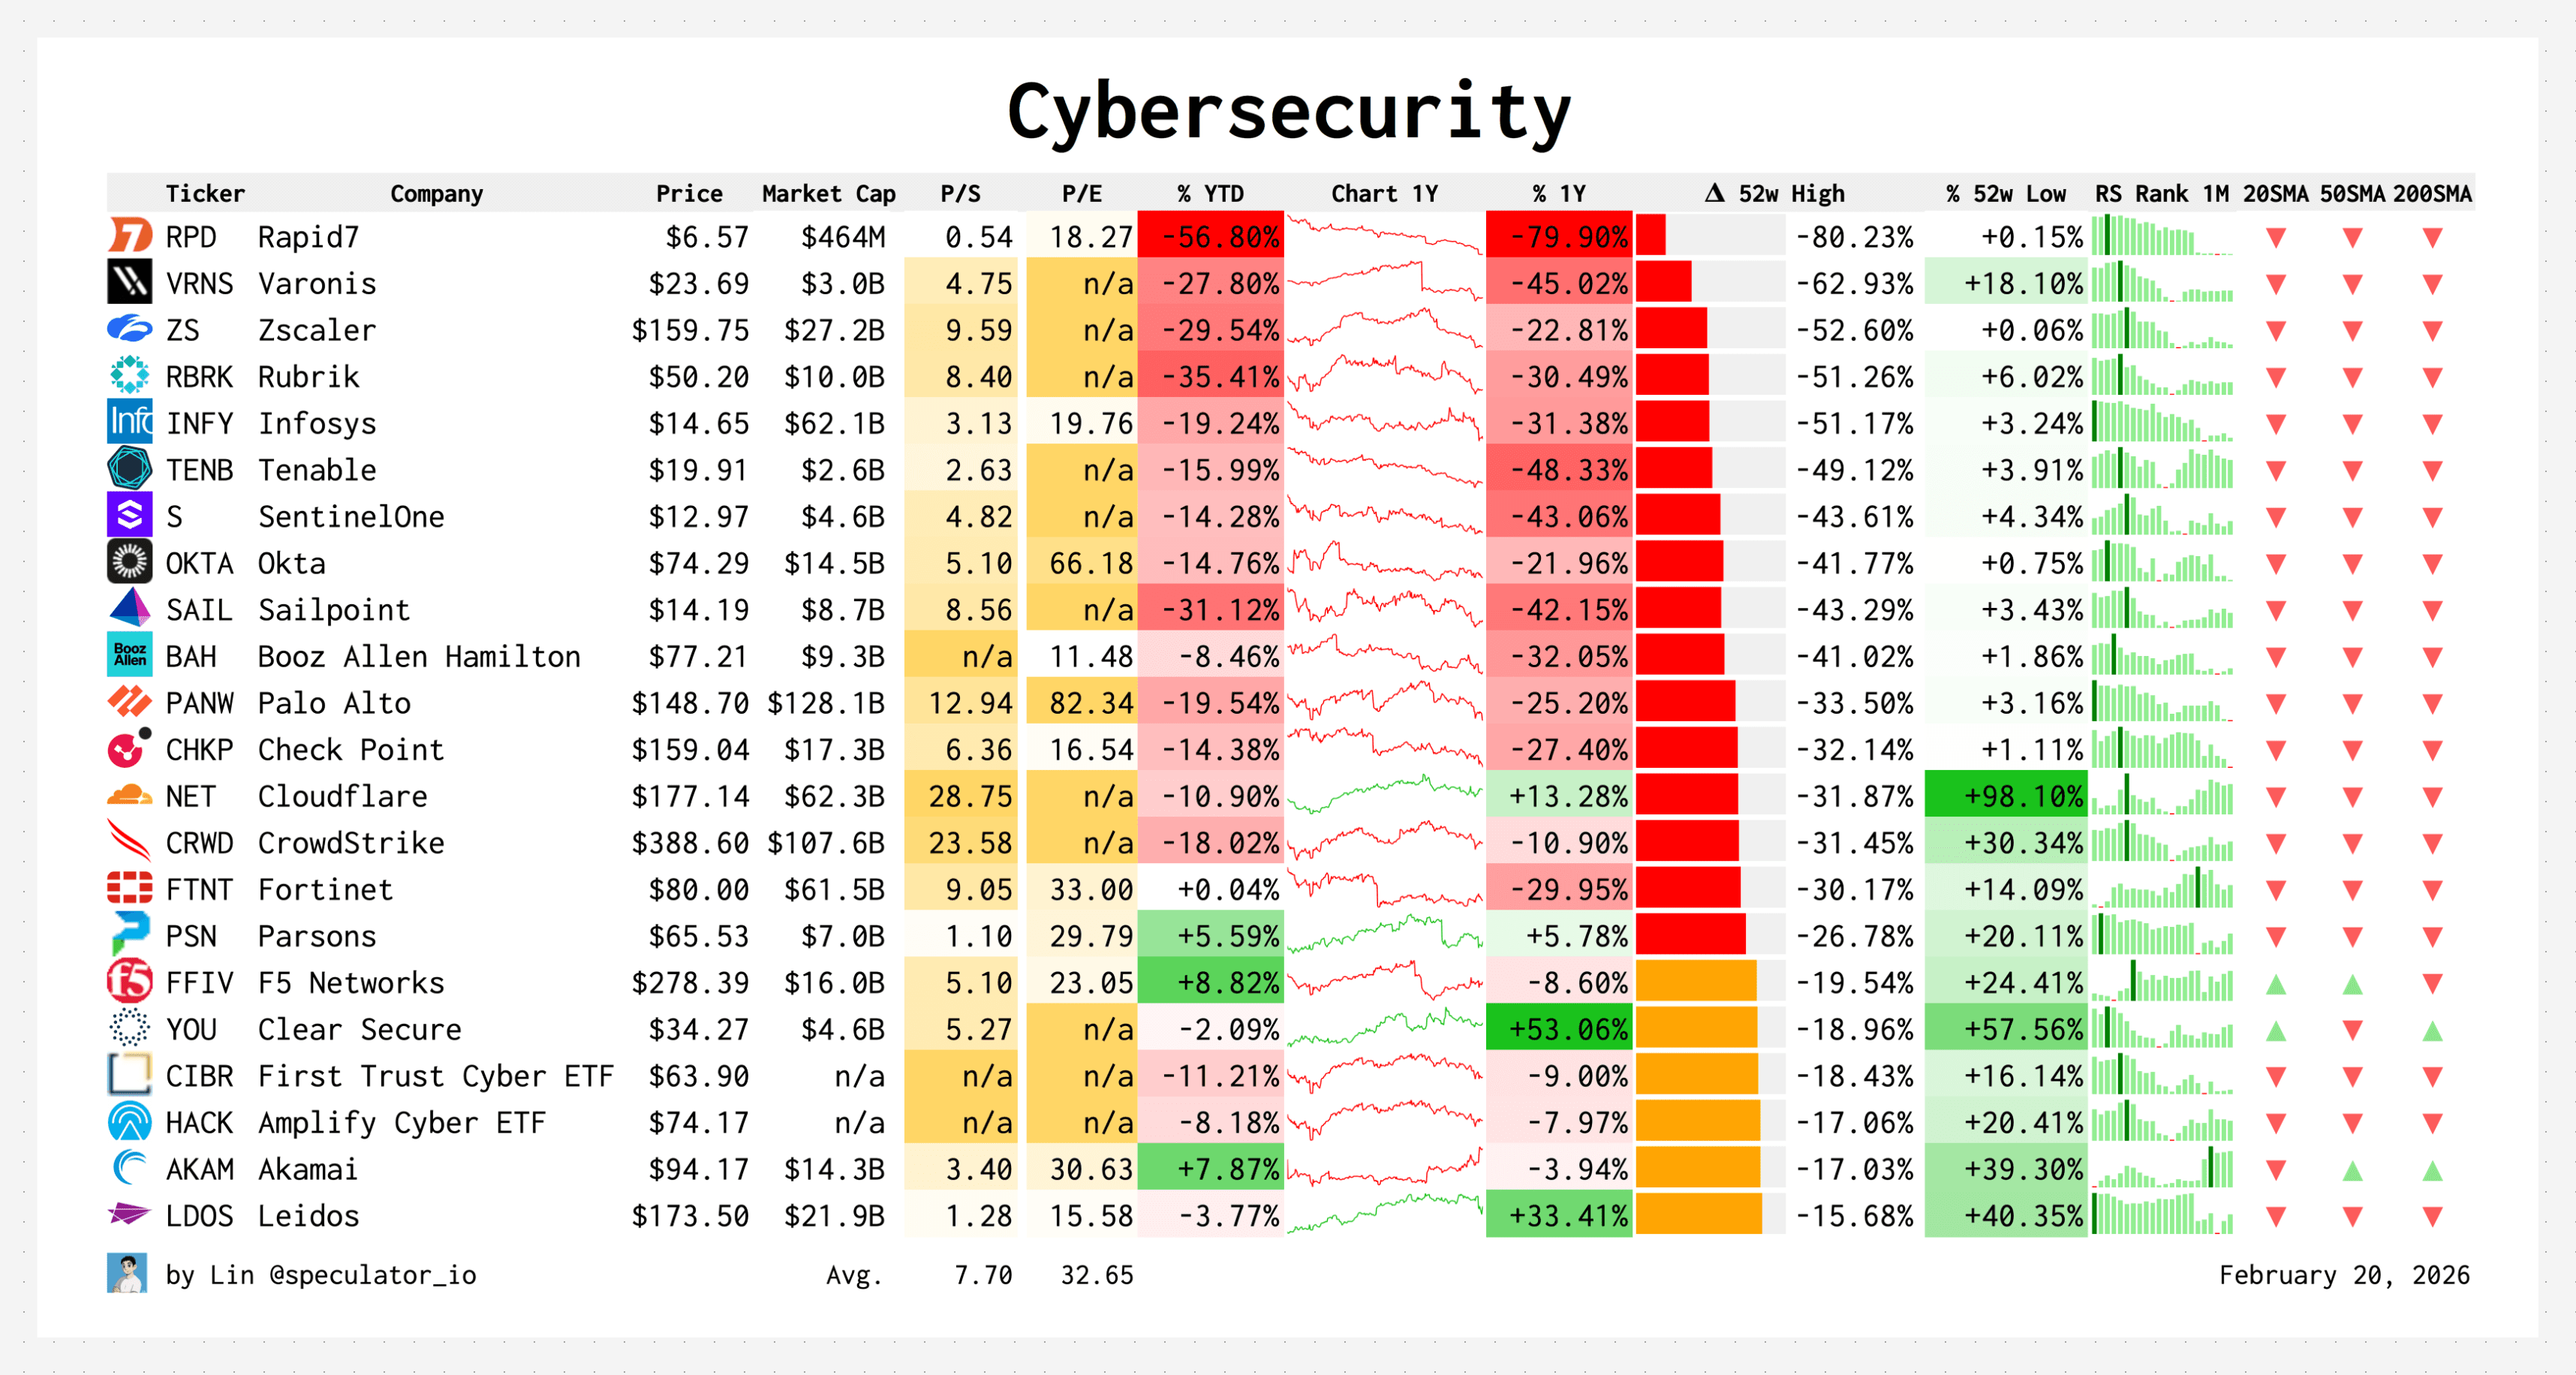
This past week, Anthropic announced their newest offering called Claude Code Security.
This led to a major selloff across cybersecurity names, whether that’s Cloudflare, Crowdstrike, or Zscaler. All of them got hit. At this point, owning software or anything even remotely close to software is taking on major risk because we’re just a headline or breakthrough away from a group wide selloff.
In my view the sell-off is mostly overblown and unjustified. The mass adoption of AI will actually increase the demand for security tools. Scams, ransomware, etc. will only get more sophisticated with AI, not less.
But this is the kind of market where anything with a non-zero chance of being disrupted will be punished. It is best to stay clear of those areas for the time being. Markets can be irrational in both directions for a long time.
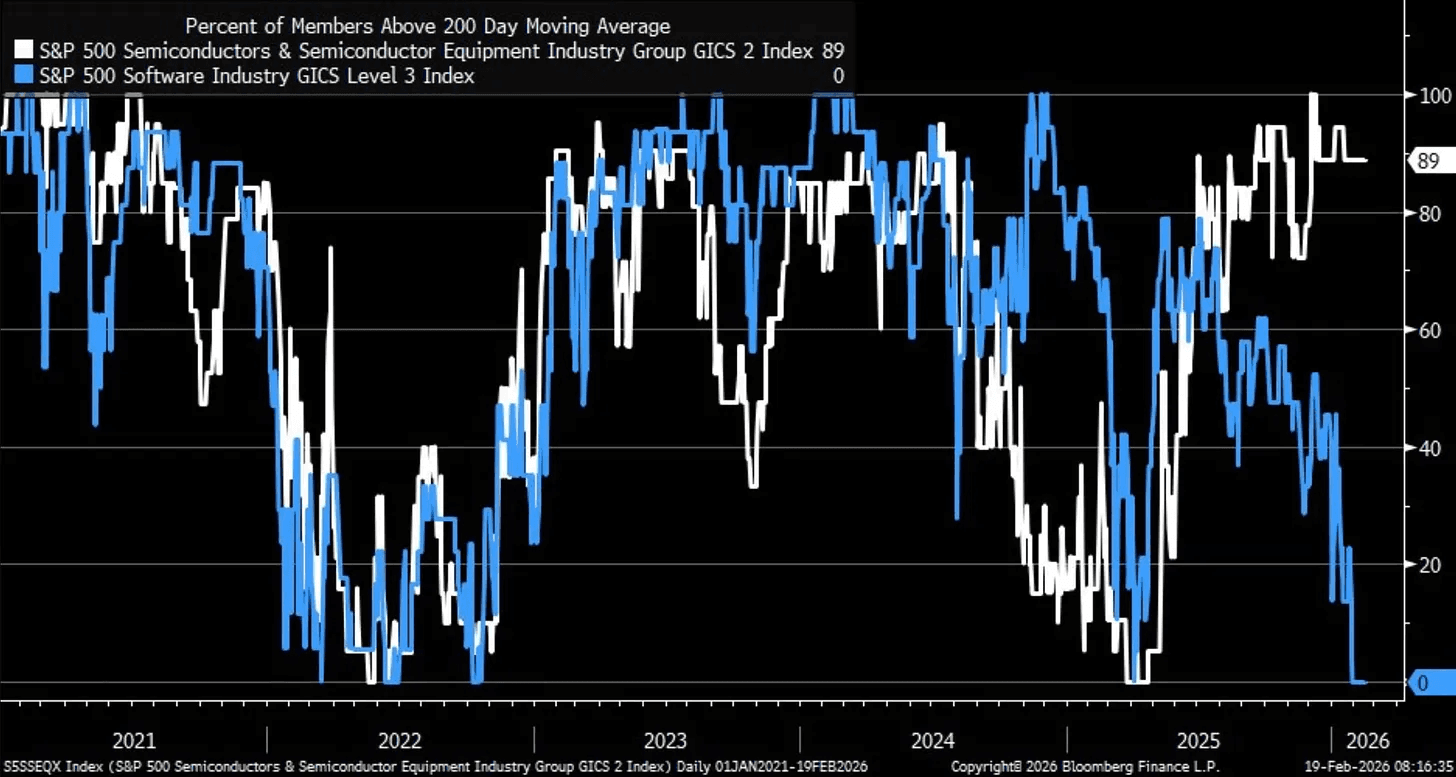
Perhaps the starkest data point of all. 89% of semiconductor stocks are trading above their 200-day moving average right now. For software, that number is exactly 0%. Not a single name. Two sectors, both in tech, living in completely different worlds.
The markets seems to be inching closer to a decision point. Nvidia could act as the catalyst that pushes the Nasdaq in either direction out of this drawn-out, multi-month consolidation.
And there are a few interesting sectors and stocks that I will be highlighting soon. These are areas I want to focus on going forward, especially if the market decides to resume its uptrend after Nvidia’s earnings.
For now I want I want to reiterate exactly what I said last week. In the big picture, I am still bullish. But short-term I remain cautious. I have long exposure, but I am not trying to be aggressive. That kind of action is best saved for clear uptrends and easy markets. You want to be aggressive when the market feels easy, when everything starts to work. Not when there is a volatile chaos.
Lin
The Magic of Moving Averages
Moving averages are the foundation for almost every investment decision I make. They have been part of my core process for more than a decade. They are one of the most common indicators in the world for a reason. They are an incredible simple, reliable, and effective guide through all kinds of market conditions. That’s why you’re seeing them everywhere on here.
I use moving averages to decide how aggressive to be with my portfolio, which stocks to buy or short, how strong a trend really is, and even which news events are worth paying attention to. They carry more importance than headlines, economic data, or even earnings reports. If I were starting over as a beginner looking to build my net worth, learning how to use moving averages would be my number one priority. They simplify the noise of the market and turn complex price action into something you can actually understand and act on.
Moving averages are valuable for every investment style, whether you are a day trader, swing trader, or a long-term investor. They help you see whether buyers or sellers are in control, whether a pullback is healthy or a sign that the trend is breaking, and whether a breakout is sustainable or extended. I always want to own stocks that are “surfing” their moving averages because it means they are in sync with the trend.
My personal setup includes four moving averages:
10 SMA/EMA: very short-term trend
20 SMA/EMA: short term trend
50 SMA: intermediate trend
200 SMA: long-term trend
The 10-day and 20-day SMAs react quickly to price movements and help me track short- to medium-term momentum. They change direction fast enough to alert me early when the character of a trend begins to shift, which is useful for entries, exits, and managing risk.
The 50-day and 200-day SMAs represent the bigger picture. These are levels that institutions watch closely. They often act as major areas of support or resistance. A stock trading above both of these rising averages is usually in a strong structural trend, while a break below them often signals deeper weakness. Together, these four averages help me see both the short-term momentum and the long-term foundation of a stock’s move.
The difference between an EMA and an SMA is in how they treat recent prices. The EMA gives more weight to the most recent data, so it reacts faster to changes. The SMA treats all past prices equally, creating a smoother picture of the overall trend. EMAs are more sensitive to recent price action, giving me an earlier read on near-term momentum while preserving perspective on long-term trends. That is why I use EMAs for short-term movement and SMAs for the broader structure.
Moving averages are also a key part of risk management.
No matter if you’re a long-term or short-term investor, you should only take new long positions when a stock is trading above its 200-day SMA. That way you automatically filter out weak names and limit exposure to downtrends. If a bullish breakout forms while the stock is below its 200-day SMA, I usually skip it because the odds are against me. This simple rule will save you a lot of money and headaches. Conversely, if the breakout occurs above the 200-day SMA, that often signals a potential turnaround and a shift in the long-term trend.
So, to make this more visual here are few current examples:
Netflix ($NFLX)

Hims & Hers ($HIMS)

ServiceNow ($NOW)

Strategy ($MSTR)
Bitcoin
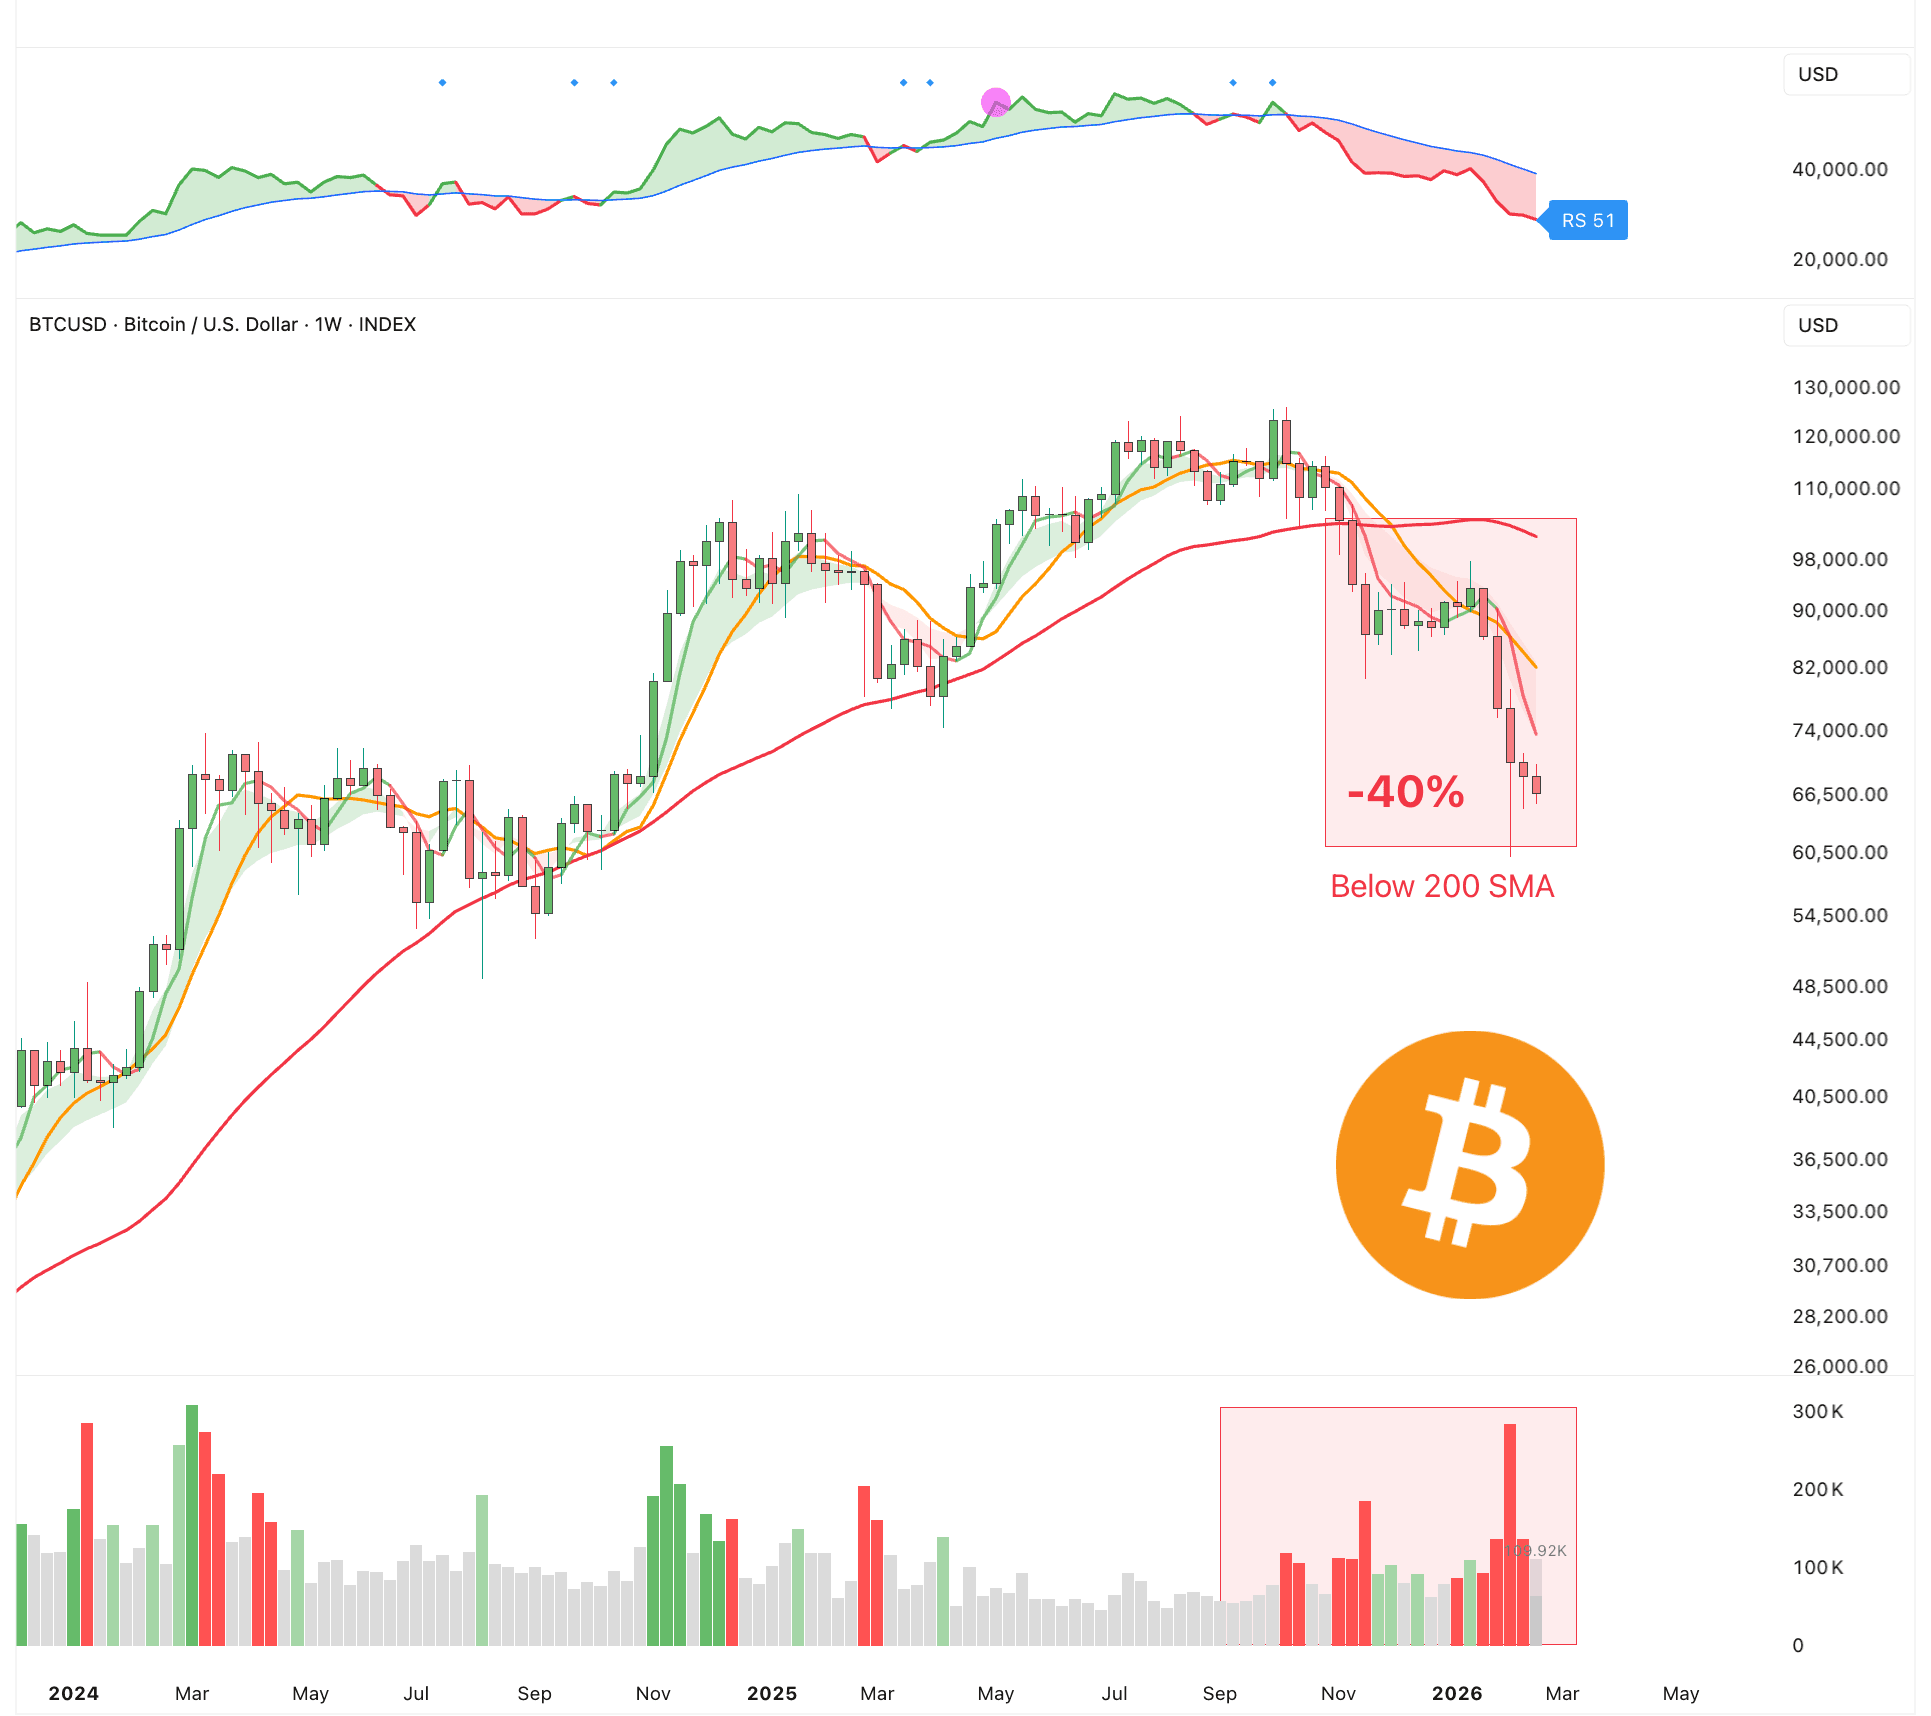
That’s why you should avoid stocks or assets that are below their 200-day SMA if you’re thinking about buying a new position. The odds are against you. It’s much easier to make progress when everything is aligned in your favor. Ideally, all the moving averages are stacked on top of each other and pointing up. Sometimes less is more, and keeping it simple is best.
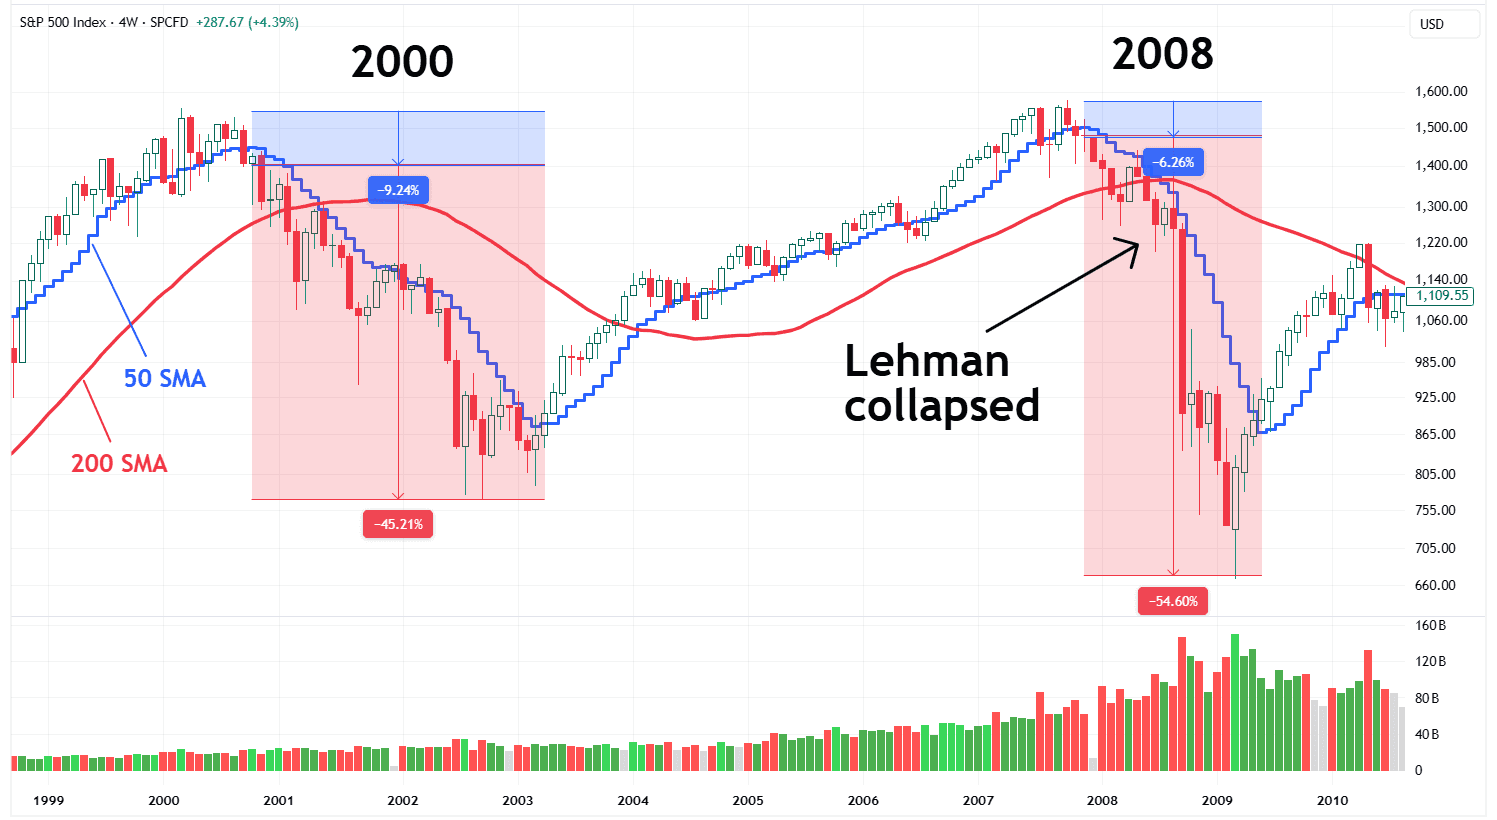
This also works for the general indices.
The most dangerous markets are when the index is below the 200-day SMA. If we look at the crashes in 2000 and 2008, you’ll see that most of the drawdown happened below the 50-day SMA and, more importantly, the 200-day SMA. You could have avoided most of the crash simply by getting out once the market fell below its 200-day SMA. It’s really that simple.
Now, of course, sometimes the market will briefly touch or close below the 200-day SMA and then move right back up. That will happen. There will be false signals. No indicator is perfect. But if it continues to stay below a key moving average, you know something is not quite right.
Many investors dismiss moving averages, saying they “don’t work” because everyone can see them. But moving averages are not meant to be a secret signal or a standalone strategy. They are a tool for context and decision-making. I do not buy or sell solely because of a moving average, but they shape almost every choice I make.
Lin
Market Update: Correction Ahead?
A correction is likely. In fact, in many parts of the market, it is already here. Some sectors are even in deep bear markets. It started with software and crypto, then spread to private credit, consulting firms, insurance brokers, financials, and real estate services. Today, logistics stocks are plunging by double digits. The weakness is slowly spreading from sector to sector, crushing stocks across the board.
What stands out most is not the selling itself, but the complete lack of willingness from investors to step in and defend during these sharp selloffs. That is because everyone is all in. There is very little dry powder left, as highlighted in last week’s update.
So, from last week’s update:
Continued volatile and choppy action is likely. And it’s not like a pullback would be completely unexpectedly either. So, some caution is definitely warranted. You never know when they happen exactly but the market offers subtle clues, if you pay attention and look closely. I’ve been highlighting some of them over the last few weeks.
Elevated volatility
Sell off on good earnings
Value names outperforming
Gold and silver going parabolic
Narrowing breadth market
Crypto getting crushed
Of course, there are no guarantees.
But when you start to see more of these signals, it makes sense to be more cautious.
Now add this on top of what we already discussed:
Deteriorating sentiment
Many sectors are in deep bear markets
Most of the Mag 7 are in no man’s land
Very few leading stocks and sectors
And the main indices are starting to roll over
The market is clearly starting to cool off, which isn’t entirely surprising. But with increasing distribution days, leading stocks starting to give back, and risk-on assets under pressure, it adds up to the setup for a market correction.
Nobody knows how deep this correction could go.
But one thing is clear: the downside risk clearly outweighs the upside potential right now.
It’s really important to know when to be aggressive and look for opportunities in the market, and when to be defensive and protect both your mental and financial capital. This is a market where you get paid for being patient. You do not need to swing at every pitch. You can simply wait for the next big pitch when the odds are back in your favor and the market starts rewarding risk again. Right now it’s clearly not.

It’s hard to see any sustained rally when most of Big Tech is fading and showing no real signs of life. Google and Nvidia are holding up reasonably well. But even they cannot carry the entire market if the rest does not follow. You want to see broad participation, more stocks acting well, and leadership expanding. That is missing at the moment. Until that changes, rallies are likely to be short lived and sold into. Chasing strength in this environment usually ends poorly. Let the market prove itself first.
So, even though there is no reason to believe this bull market is over, it does not hurt to be cautious in the near term.
The focus right now should be on managing risk. When the market starts to correct, even a little, momentum stocks can get hit very hard. As we have seen, a normal 5-10% correction in the major indices can easily turn into a 40-50% correction in individual stocks. The goal is to give back as little of your hard-earned profits as possible. Make sure your risk exposure stays under control. That means smaller position sizes, fewer trades, and being very selective. Cutting exposure early is a lot easier than trying to recover from deep drawdowns later.
Here are a few ways to do that:
Cut losses early. You don’t want to hold too many losing positions, especially at the start of a correction. Nobody knows how long a pullback will last. That’s why you need to be even more disciplined.
Hold enough cash. A pullback can create new buying opportunities. But you can only take advantage of them if you have cash available.
Clean up your portfolio. You want to constantly prune your portfolio. Keep the strongest. Get rid of the weakest.
Reduce exposure to momentum names. They are the most vulnerable names in a correction.
Hedge your portfolio: This is a more advanced strategy and not suitable for everyone. If you know what you are doing, you can use short positions, inverse ETFs, or volatility instruments to help manage drawdowns.
Lin
Market Update: The Year of AI Agents
I believe we may have just seen the ChatGPT moment for agentic AI.
OpenClaw is one of the newest AI tools the public has gotten their hands on, and it might be the one of the most useful AI tool on the market.
(Side Fact: They had to change their name from Clawdbot to Moltbolt and then OpenClaw after Anthropic threatened to sue them.)
It is an open source, messaging native AI personal assistant that runs locally or on a small device server you control. Instead of living in a browser tab on a computer, it operates inside everyday messaging apps like WhatsApp, Telegram, iMessage, and Discord, replying and staying in sync across devices.
It essentially acts as a gateway that routes messages to AI models such as Claude or ChatGPT and can trigger real actions like checking email, managing calendars, running scripts, or sending proactive alerts.
For example, you could text Moldbot, “Keep an eye on my inbox for anything urgent from my boss,” and it would monitor your email in the background and message you as soon as one arrives. Or you might ask it to summarize tomorrow’s calendar and remind you an hour before your first meeting without needing to open another app.
It’s a true personal AI assistant.
What sets OpenClaw apart from many other AI applications is its persistence and proactivity. It maintains long term memory, can monitor conditions on a schedule, messages you first when something important happens, and generally stays up to date with your life. It does not need constant prompts. Instead, it becomes an extension of you. It may sound a bit dystopian, but this is what makes it feel like a real assistant. Go give it a try.
The future of AI is agentic.
So, which stocks could benefit from this shift toward agentic and personal AI assistants?
OpenClaw essentially gives models like Claude or ChatGPT a “life” by allowing them to interact with files, run commands, monitor inboxes, and message people proactively. Once these agents are enabled, they generate more automated traffic and more machine to machine activity across the internet. Essentially, AIs can start to work with one another. Not only that but software is becoming a commodity. Everyone will be a developer simple by using natural language.
The biggest edge you can have right now as an investor is to spend as much time as possible learning and using AI. You’ll understand what’s possible and the huge number of opportunities being created at this very moment.
One of the sectors that will likely be a huge beneficiary is security or cybersecurity to be precise. Hence, make sure to check out the Cybersecurity thematic portfolio.
And in that sector Cloudflare ($NET) is one of the leading companies in this sector. It sits directly at the intersection of edge compute, API security, bot management, and more, which makes it a natural beneficiary of AI agents.
As more AI agents come online, Cloudflare’s ability to inspect and secure requests at the edge becomes even more valuable. This further reinforces its position as the default front door for the modern internet. They also allow you too create and orchestrate your agents right in Cloudflare.
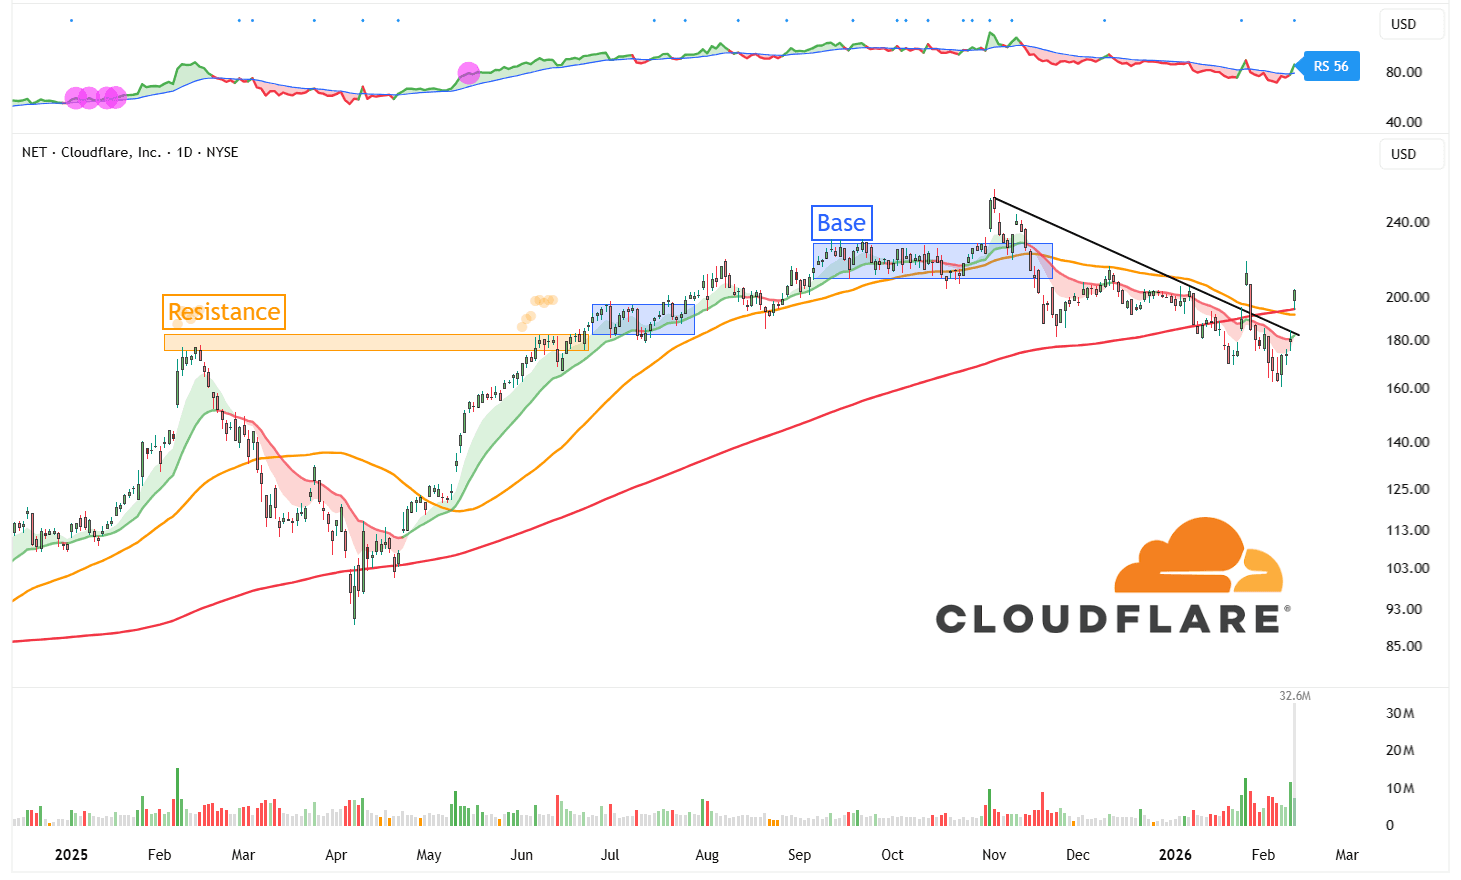
When products and moments like this appear, they can change the entire story and trajectory of a stock and even a whole sector.
OpenClaw looks like a clear inflection point where agentic AI moves into the hands of real users. It feels similar to when people first tried ChatGPT and could not believe what it could do.
This also means a lot more activity behind the scenes. More automated traffic, more API calls, more background processes, more DDoS attacks, more scams, more systems failing, and simply more of everything related to cyber.
Hyperscalers like Amazon, Google, and Oracle benefit as well, and the entire AI value chain will be a major beneficiary. Cybersecurity sits right at the application layer for agentic AI.
It’s not just that we’ve reached an inflection point for agentic AI. We may have reached one for video generation as well with the launch of Seedance 2.0 by ByteDance, TikTok’s parent company. It’s almost hard to believe how far AI video has come in just a few years.
Most people still underestimate what AI can do, but it’s improving so quickly that what seems impressive today will feel normal in a few months. And markets often underprice these second order effects at first, then reprice them quickly once people understand.
That’s why it’s crucial to be positioned to benefit from the AI tailwind and not invest in sectors that stand to be disrupted.
Lin
Weekly Market Update: A Bifurcated Market
The last week was one of the most bifurcated weeks of 2026.
The Dow Jones crossed 50,000 for the first time ever. But beneath this good headline the market underwent a violent rotation. The Nasdaq had its worst 3 day decline since April before Friday’s reversal. Software stocks posted their worst week since the 2008 financial crisis. Bitcoin and the entire crypto complex melted down, while the S&P 500 was essentially flat.
It’s remarkable how well the S&P 500 held up with everything going on. But let’s explore.
A clear rotation is happening under the hood.
Market participants are moving into more stable blue chips and defensive. Energy, materials, and industrials all hit record highs this week.
The divergence is striking. Value and cyclicals are gaining strength while growth and tech face an existential reckoning tied to AI disruption.

Software has been one of the weakest sectors this year. The drop was fast and deep, like what you usually see in real bear markets. For many software stocks, it felt like pure armageddon.
A big reason for this selloff is fear. Fear that new AI players like OpenAI and Anthropic could disrupt the whole software industry. It’s clear that new tools like AI agents are completely changing how developers work.
And OpenAI and Anthropic are clearly going not just after developers but almost all white collar jobs.
That’s why software stocks just had their worst week since 2008.
The IGV Software ETF fell more than 11% for the week and is now down over 24% to start 2026. Names like Salesforce, ServiceNow, Figma, and Hubsspot have been crushed.
No one wants to own software right now.
It feels like everything has been thrown out with the bathwater. That is also what creates opportunity. Investors are selling first and asking questions later. But you have to be very selective here.
Not every software company will come back. Some business models will truly get disrupted. Others will adapt, integrate AI, and come out stronger. (More on the latest AI developments in a later market update.)
I have been very bullish on AI for a long time. It will change almost every industry. That is why it is so important to spend time understanding it and actually using it. This is the biggest tech shift we have seen.
What happened in software makes one thing very clear. You want to be in the sectors that benefit from the AI buildout and avoid the ones that are most at risk of being disrupted.
And if you invert the chart above, you see the other side of the story. It has been all about semisconductors. And of course for good reason. They are the most critical part of the trillion dollar AI buildout.

Now onto crypto.
Bitcoin fell by over 20%, its worst weekly loss in a long time. This drop already far exceeds the decline it saw in April 2025 during the tariff wars.
Big drawdowns are nothing new for Bitcoin.
It is now down about 50% in just a few months. It literally got cut in half. This is the worst drawdown since the 2022 bear market. Most other cryptocurrencies did even worse. As strange as it sounds, 50% swings are almost normal for Bitcoin and just a “routine” correction.
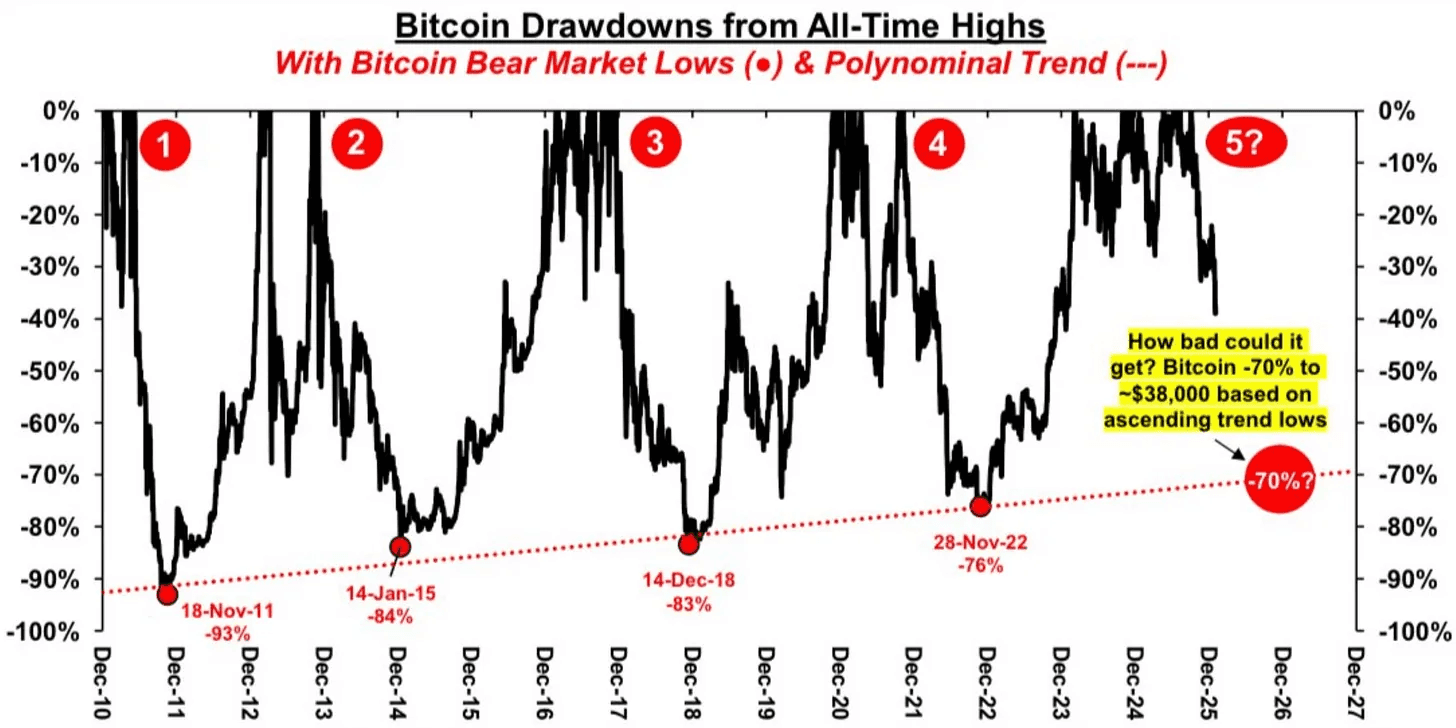
Now the real question is this. Does this turn into another 80% bear market, or is this the end of the correction?
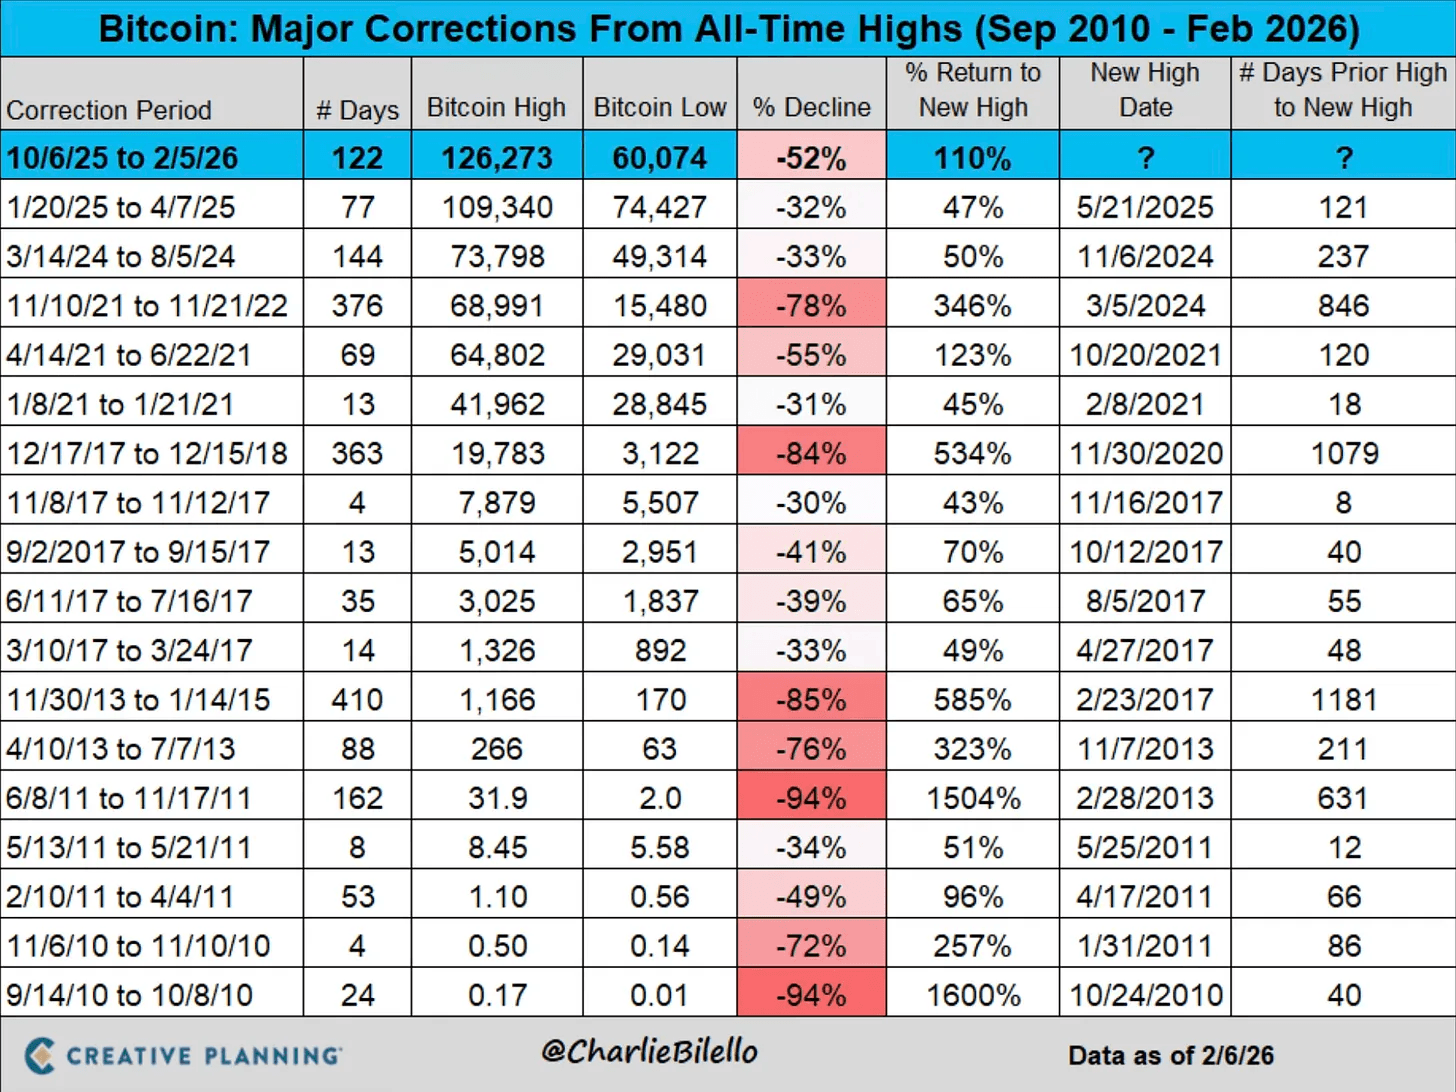
If Bitcoin follows the pattern from past crypto winters, it could even fall toward $50,000 or $40,000. In previous cycles, Bitcoin saw drawdowns between 70% and 80% from its all time highs during major bear markets. Of course, this is not a projection, but merely a possibility.
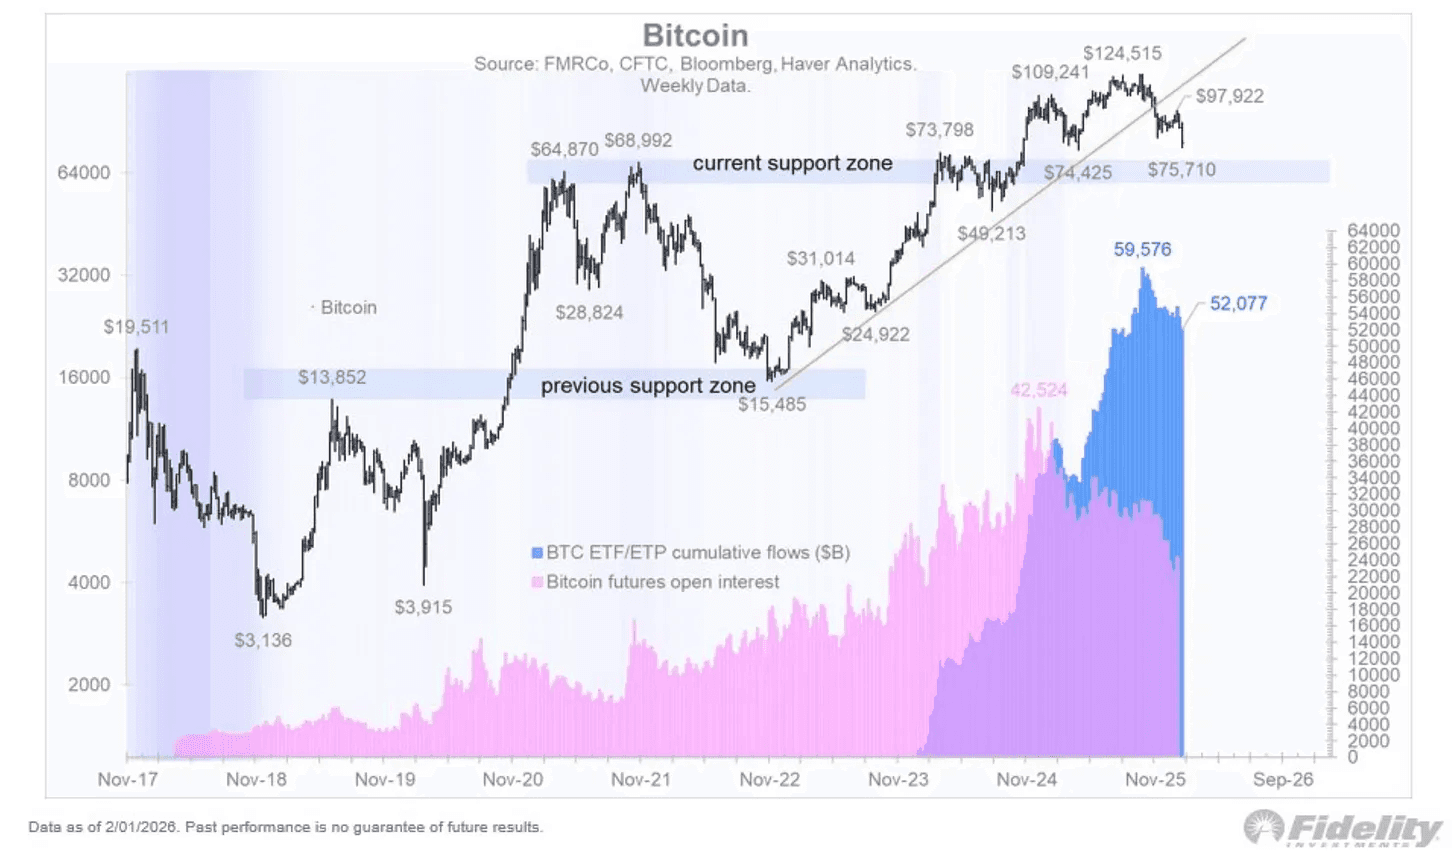
Now that was the extreme scenario. If this is just a routine correction, we could be closer to a low.
Last week we saw record put volume in Bitcoin ETFs. That shows extreme fear, heavy hedging, and panic all at once. Traders rushed to protect against more downside. Many investors exited positions. This kind of action often happen near exhaustion points close to the lows, where most sellers are already out.
Whichever way this goes, there is no reason to try to time the exact bottom. One key principle I advocate is to focus on the strongest assets, not the weakest. There will be plenty of chances to buy IF it starts to turn around.

The problem is this. I do not see a clear catalyst. The “digital gold” story is broken. Gold is up 24% since last October while Bitcoin is down 44%.
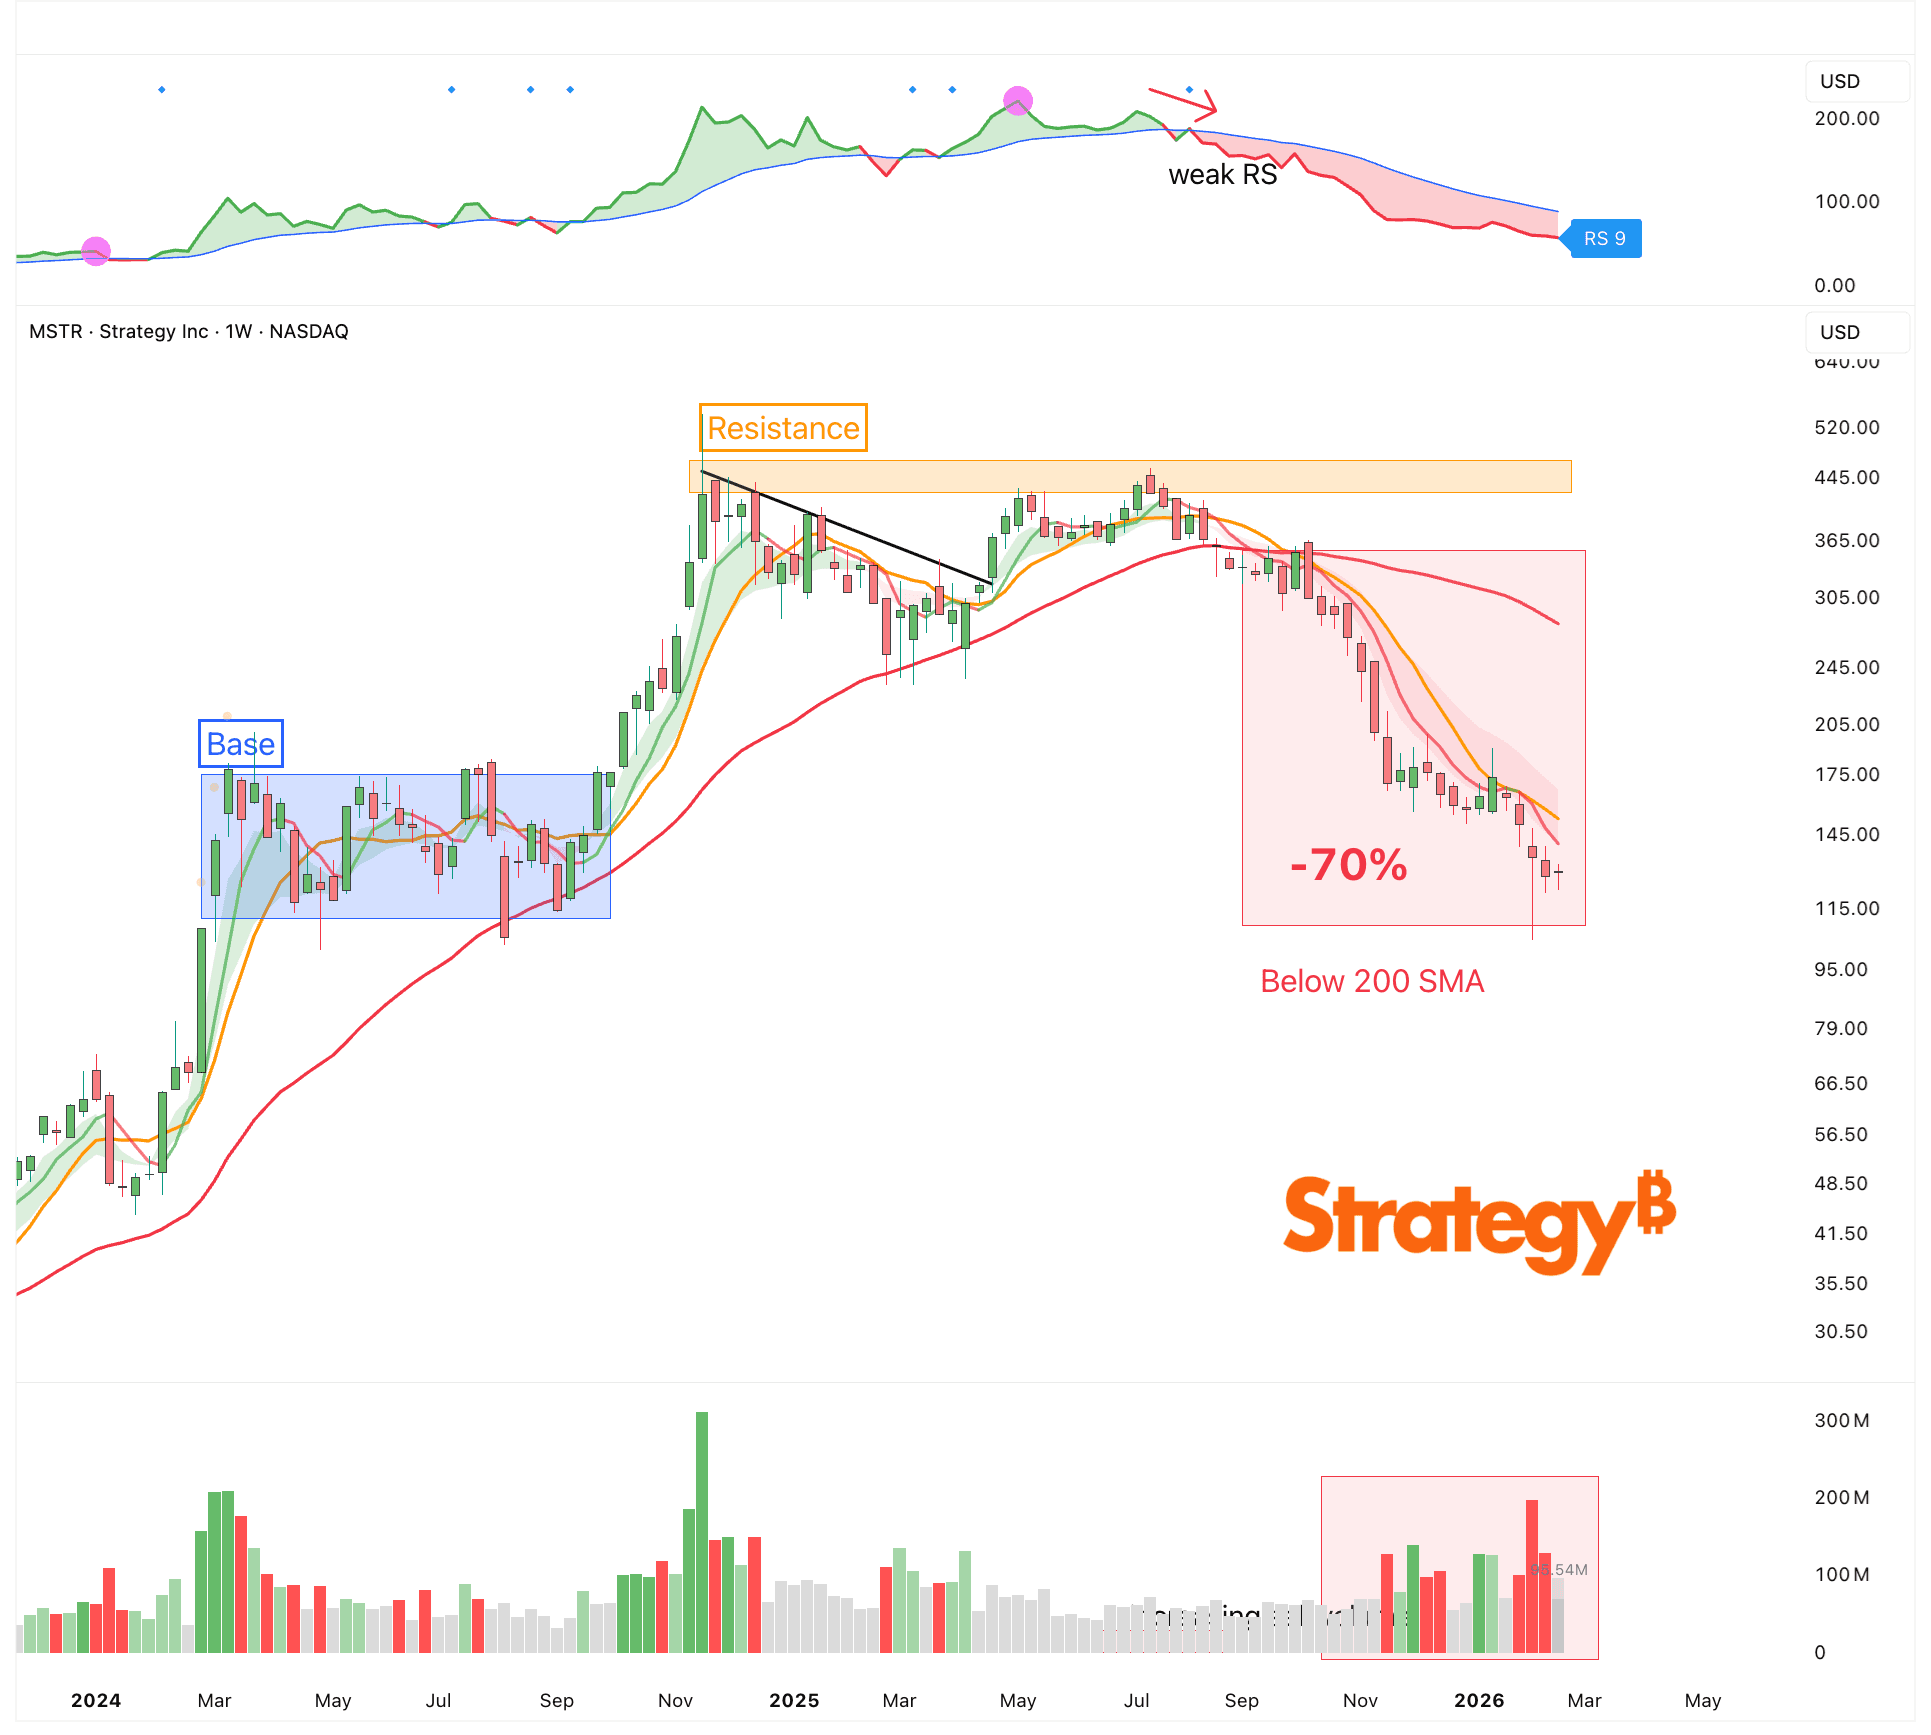
For months, people pointed to Strategy and Michael Saylor as a weak spot. The idea was that Saylor could be forced to liquidate and flood the market with Bitcoin. That fear was addressed on the latest earnings call.
Management said they are not at risk of liquidation and that the value of their Bitcoin holdings would cover their debt as long as Bitcoin stays above $8,000. So, apparently there are no balance sheet issues unless Bitcoin collapses far below current levels.
That action spilled over into equities. Tech stocks, software, and other momentum groups started falling just as fast and just as hard as crypto.
There are a few reasons for that:
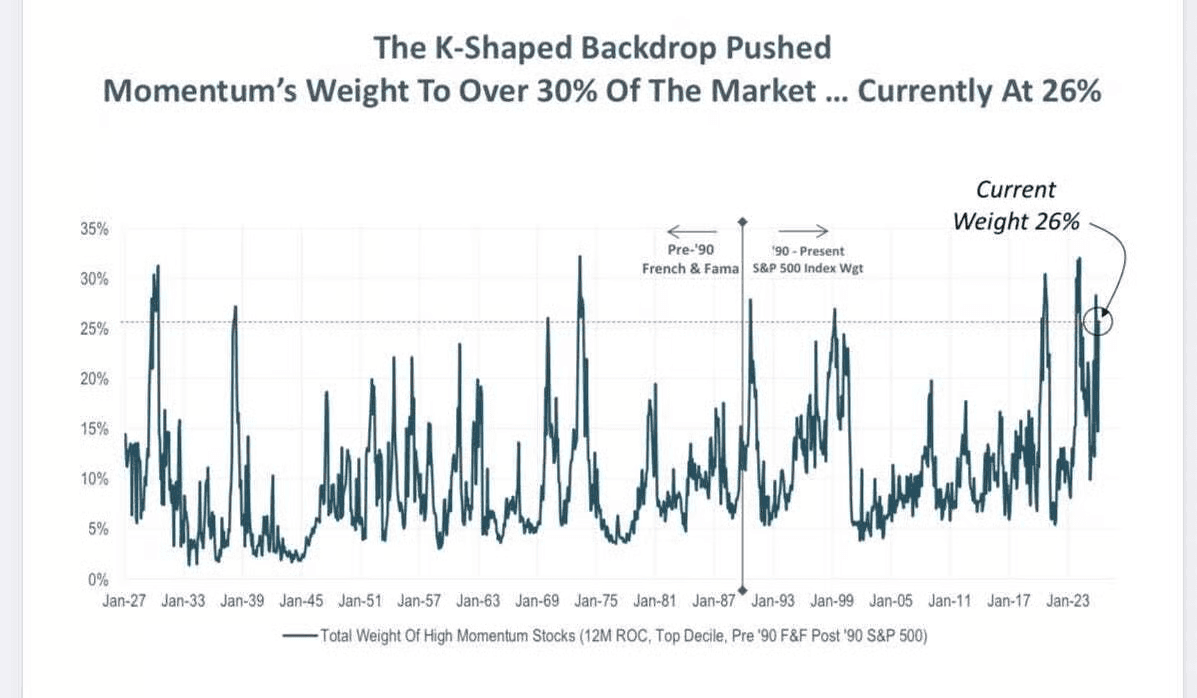
First, many investors are positioned in the same momentum names. Today, momentum makes up about 26% of the market.
Second, fund managers are putting money into almost anything except cash.
That makes sense in a bull market like this. Cash levels usually get drawn down, especially during a period when the USD is actively being devalued. But if cash is not an option, the natural result is rotation.
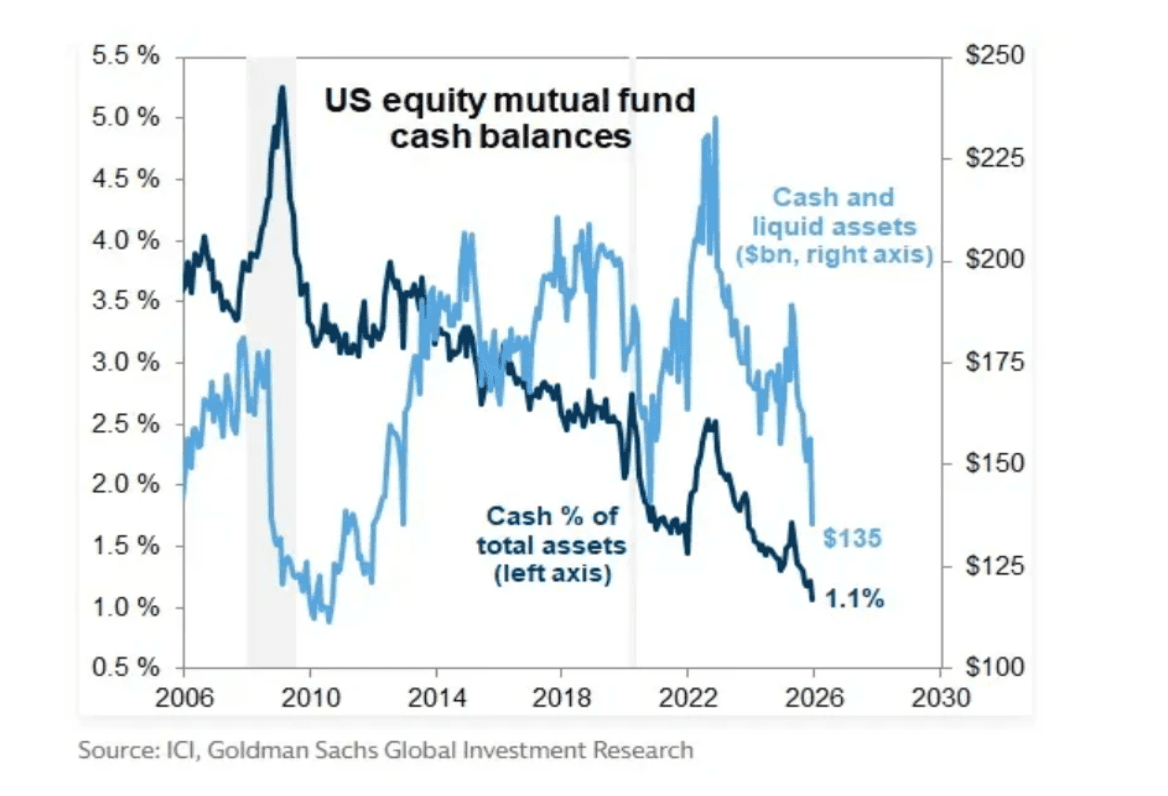
The chart below shows a clear rotation inside the S&P 500. Performance is no longer driven by just a few mega cap names but by a much wider group of stocks. Instead of relying on a handful of leaders, investors are now rotating capital into the laggards.

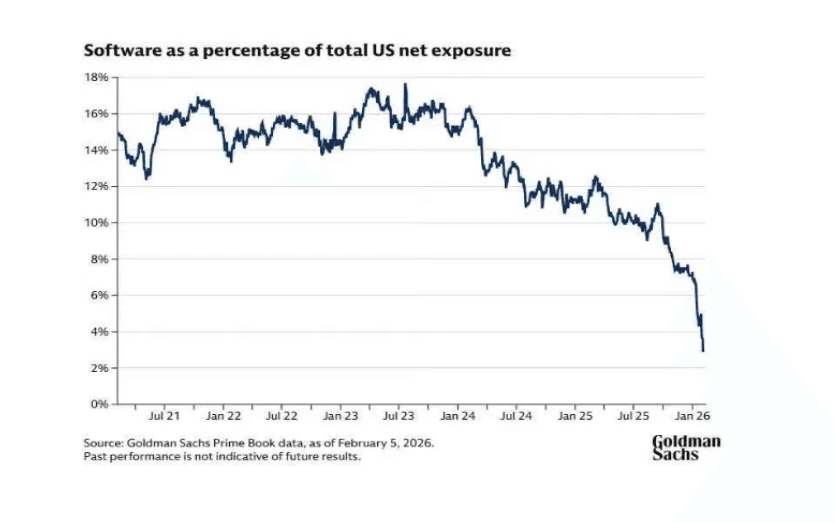
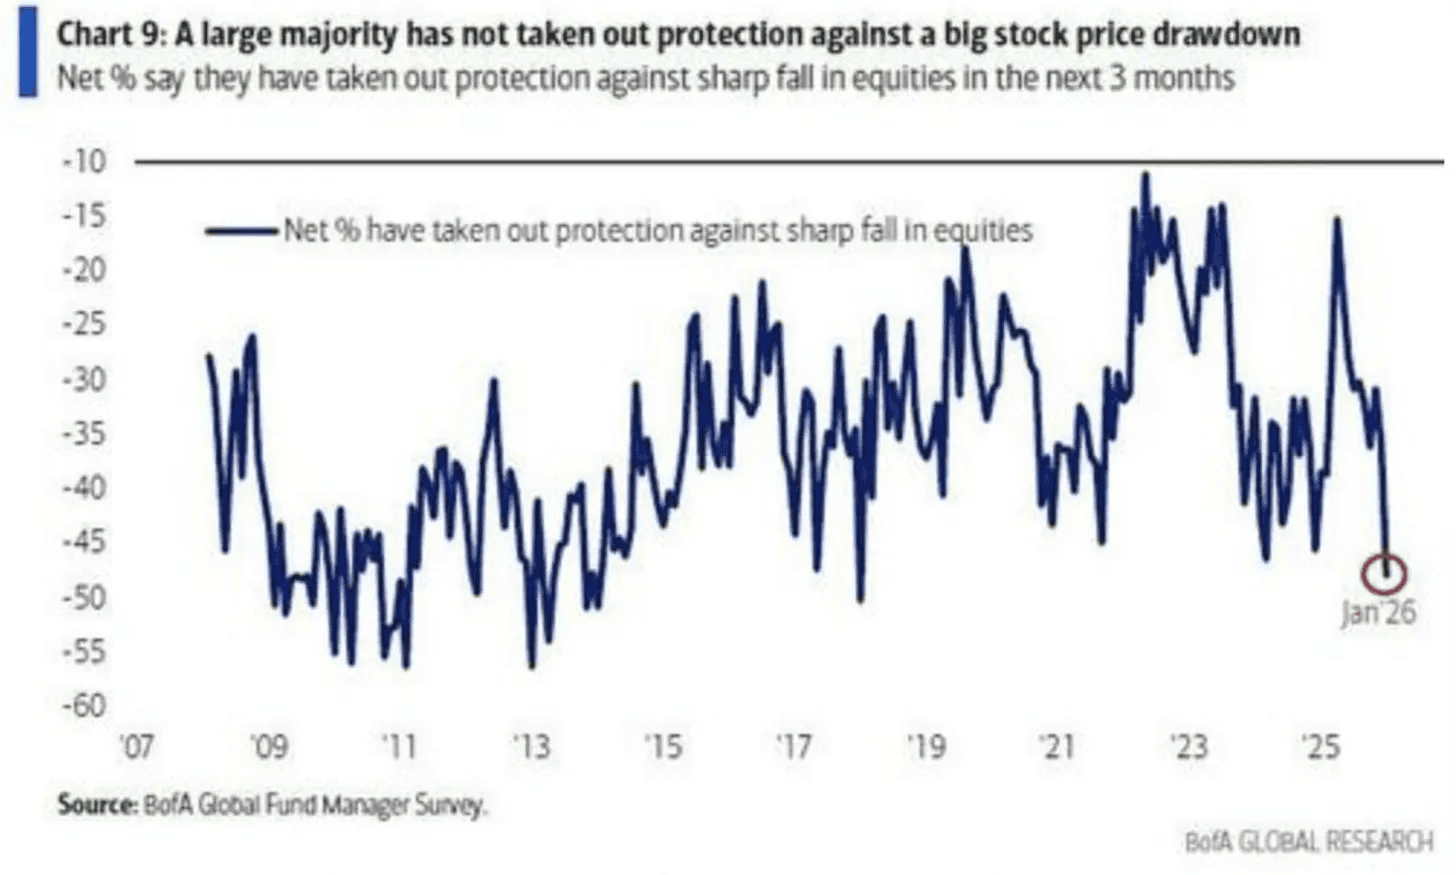
Third, it is not just low cash levels. Funds are also the least hedged in almost a decade.
They are fully exposed with very little protection if selling speeds up. Many portfolios now move almost 1 to 1 with the market.
When selling pressure increases, they cannot buy the dip because they have no dry powder. They also cannot rely on hedges to soften the fall. That leaves selling as the only option.
This triggers a chain reaction where selling leads to even more selling.
This is why we saw an extreme number of stocks with an oversold RSI this past week, the highest reading since the April 2025 tariff war lows.
If you look left on the chart, the last time before that was in 2022. Each time, the market still went a bit lower after the signal. So it did not mark the exact bottom. But it was usually very close to a low.
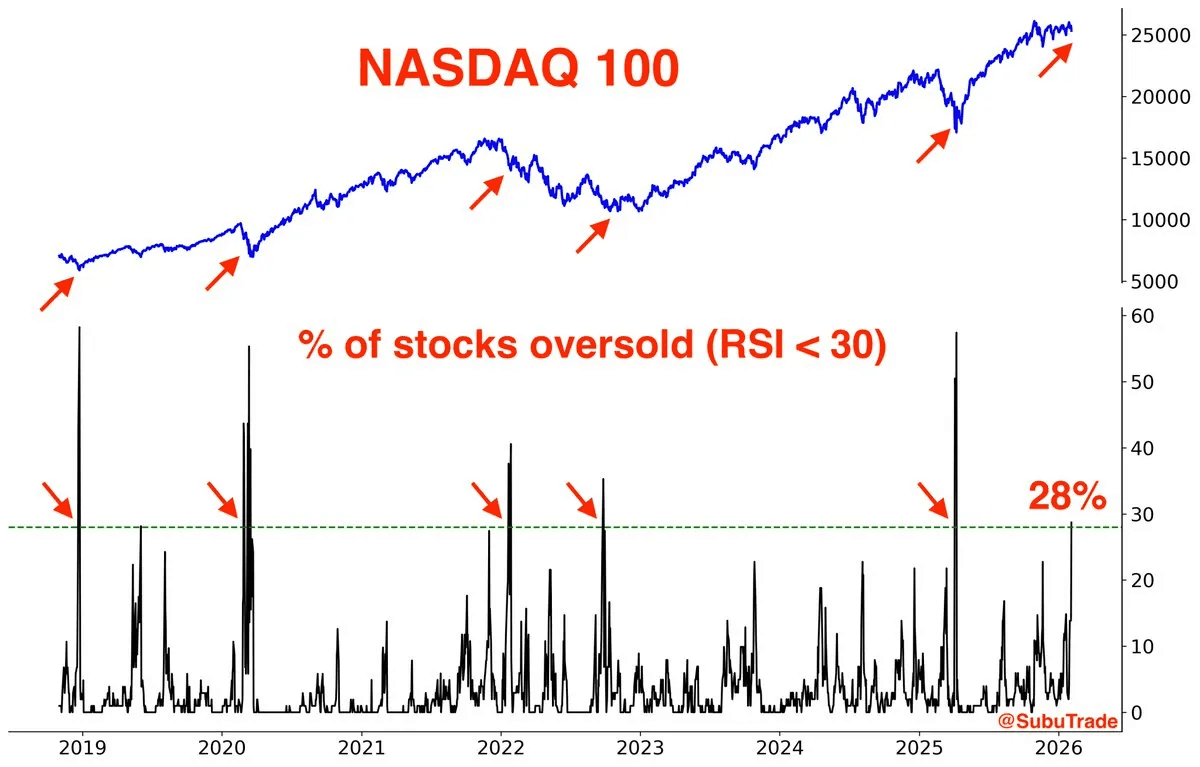
This supports the idea that we are not heading for a crash.
The action under the hood was brutal in some groups, but the S&P 500 held up well and many stocks still hit new all time highs.
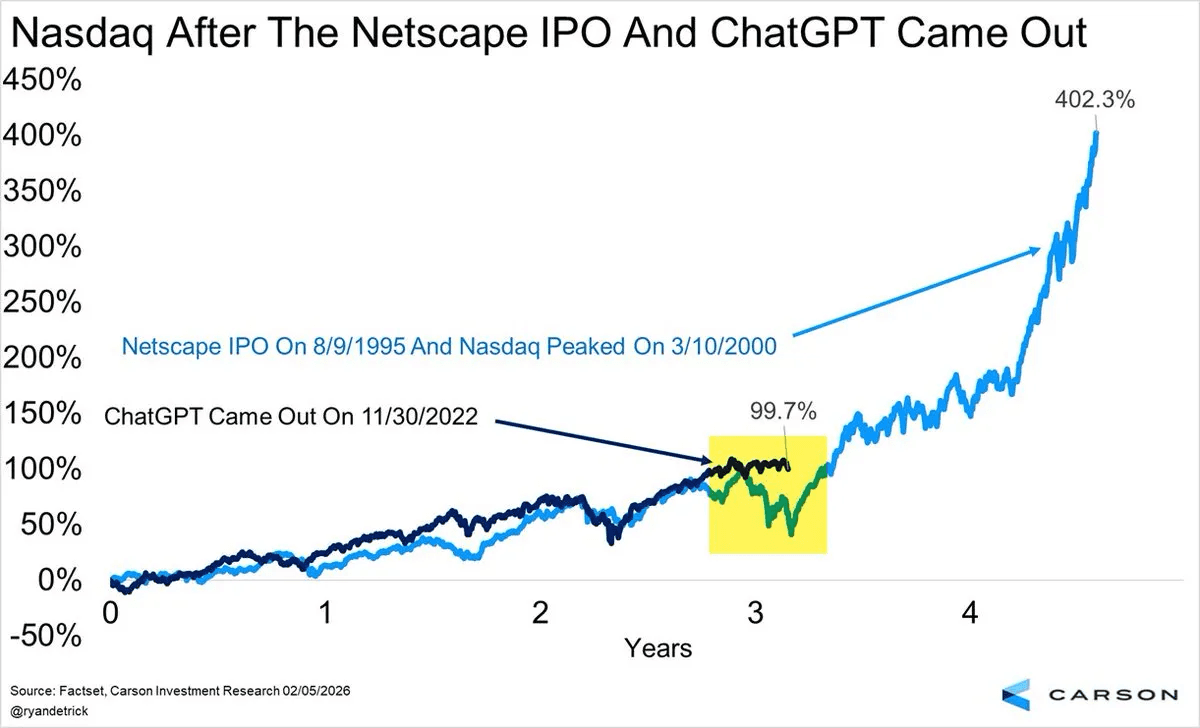
Everyone likes to compare the AI boom to the dot com era. So far, the path actually looks quite similar.
If this analog holds, what we are seeing now is normal for this stage of the cycle. Year 3 and moving into year 4, where we are now, was very volatile back then too. And a larger correction is still possible.
There is another important point. The biggest gains often come late in the cycle. That is when the real mania starts. That is the part most people remember about the dot com bubble. The final few months. Fortunes were made but unfortunately also lost.
If we see a wave of IPOs from names like OpenAI, Anthropic, and SpaceX, we could see similar behavior.
Catching even part of that move can be life changing. The key is to not give it all back on the way down. That is why risk management matters so much.
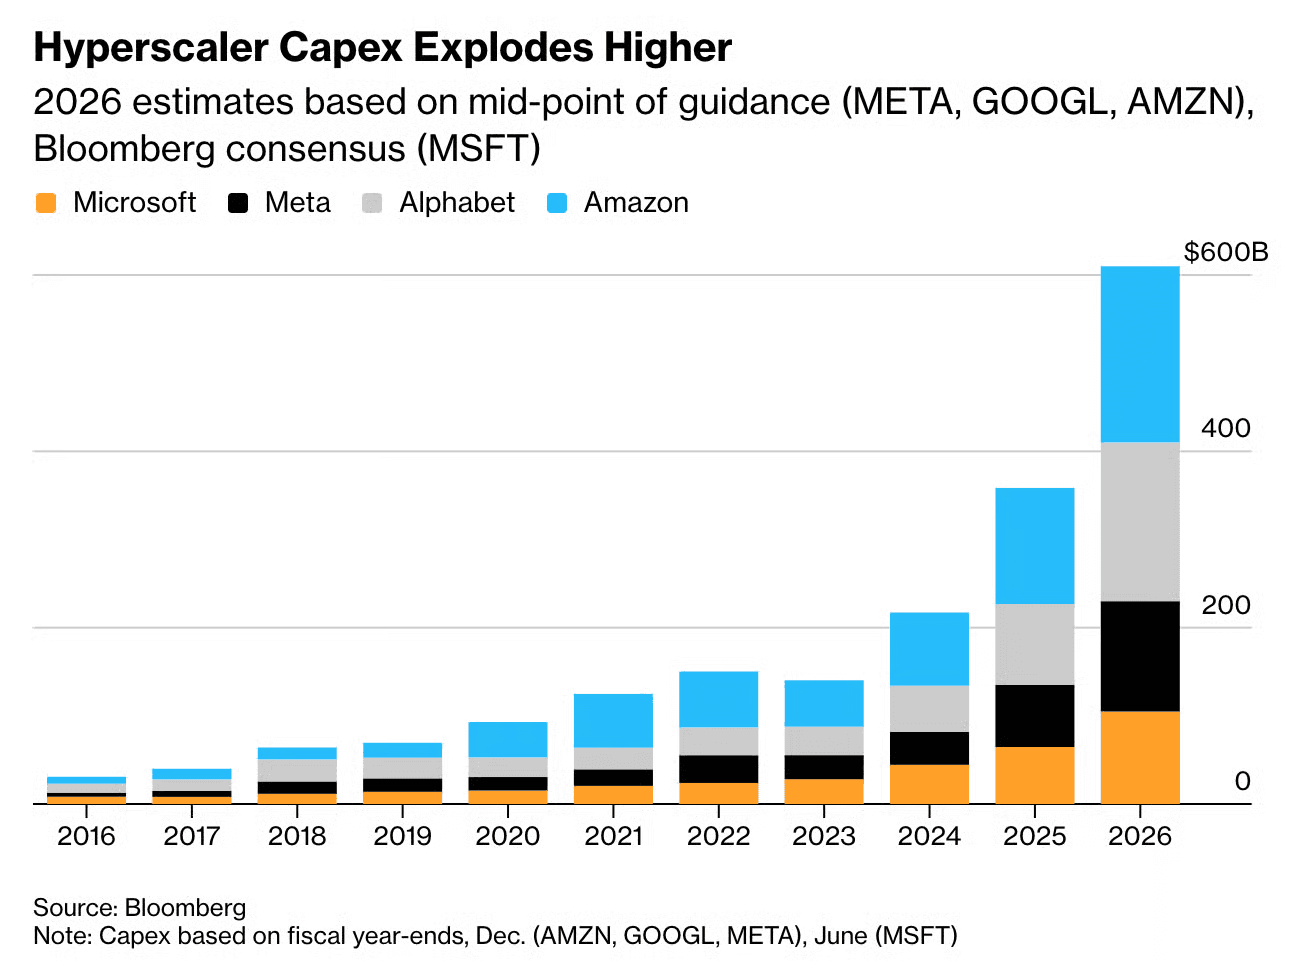
We are seeing mind boggling CAPEX numbers.
The four hyperscalers, Microsoft, Meta, Alphabet, and Amazon, are set to invest more than 600bn this year into data centers. And this is not likely to slow down soon. This is a global arms race.
You do not need to know when it ends. You just need solid risk management. You might miss part of the upside, but you avoid serious trouble.
Position sizing is one of the most important parts of investing. If you size wrong, you can get wiped out in a single week. We just saw that across crypto, software, and other speculative groups where normal selling turned into forced selling.
This does not mean you need to own 100 or more stocks. But it does mean that going all in on a small number of names carries real risk. When momentum turns, concentration works against you as fast as it worked in your favor. That’s why I’m a fan of increasing exposure and sizing when the markets are favorable and reduce exposure when the markets are deteriorating or much more volatile.
Speaking of volatility. There will be plenty of it over the next two months.
We are more than halfway through the Q4 earnings season. But there are still plenty of interesting names left to report.

This week was wild and I don’t think we’re out of the woods yet. I still believe we are in a bull market and recent action is just a bump in the road. Pullbacks and corrections are part of any bull market. But even so it’s important to not let a correction get out hand.
Crypto and software are still two groups to watch to see if sentiment and price action improve. Focusing only on the weakest groups while ignoring the strength in energy, blue chips, semiconductors, and other leaders does not make much sense to me, but it is still a useful indicator to track.
I also want to point out again that most individual stocks and themes are at the mercy of the broader market. If the market, and especially the Nasdaq, weakens, many themes and groups will likely weaken as well. The past month has not been very constructive for many momentum themes, which explains the poor performance from these areas.
It is important not to force positions in a choppy market. It is very difficult for a single theme to move higher when there is broad selling across speculative sectors. In the end, money flows often behave like one large trade. You need capital flowing into speculative areas for these themes to work, and that has not been the case recently.
Lin
AAPL
Watch
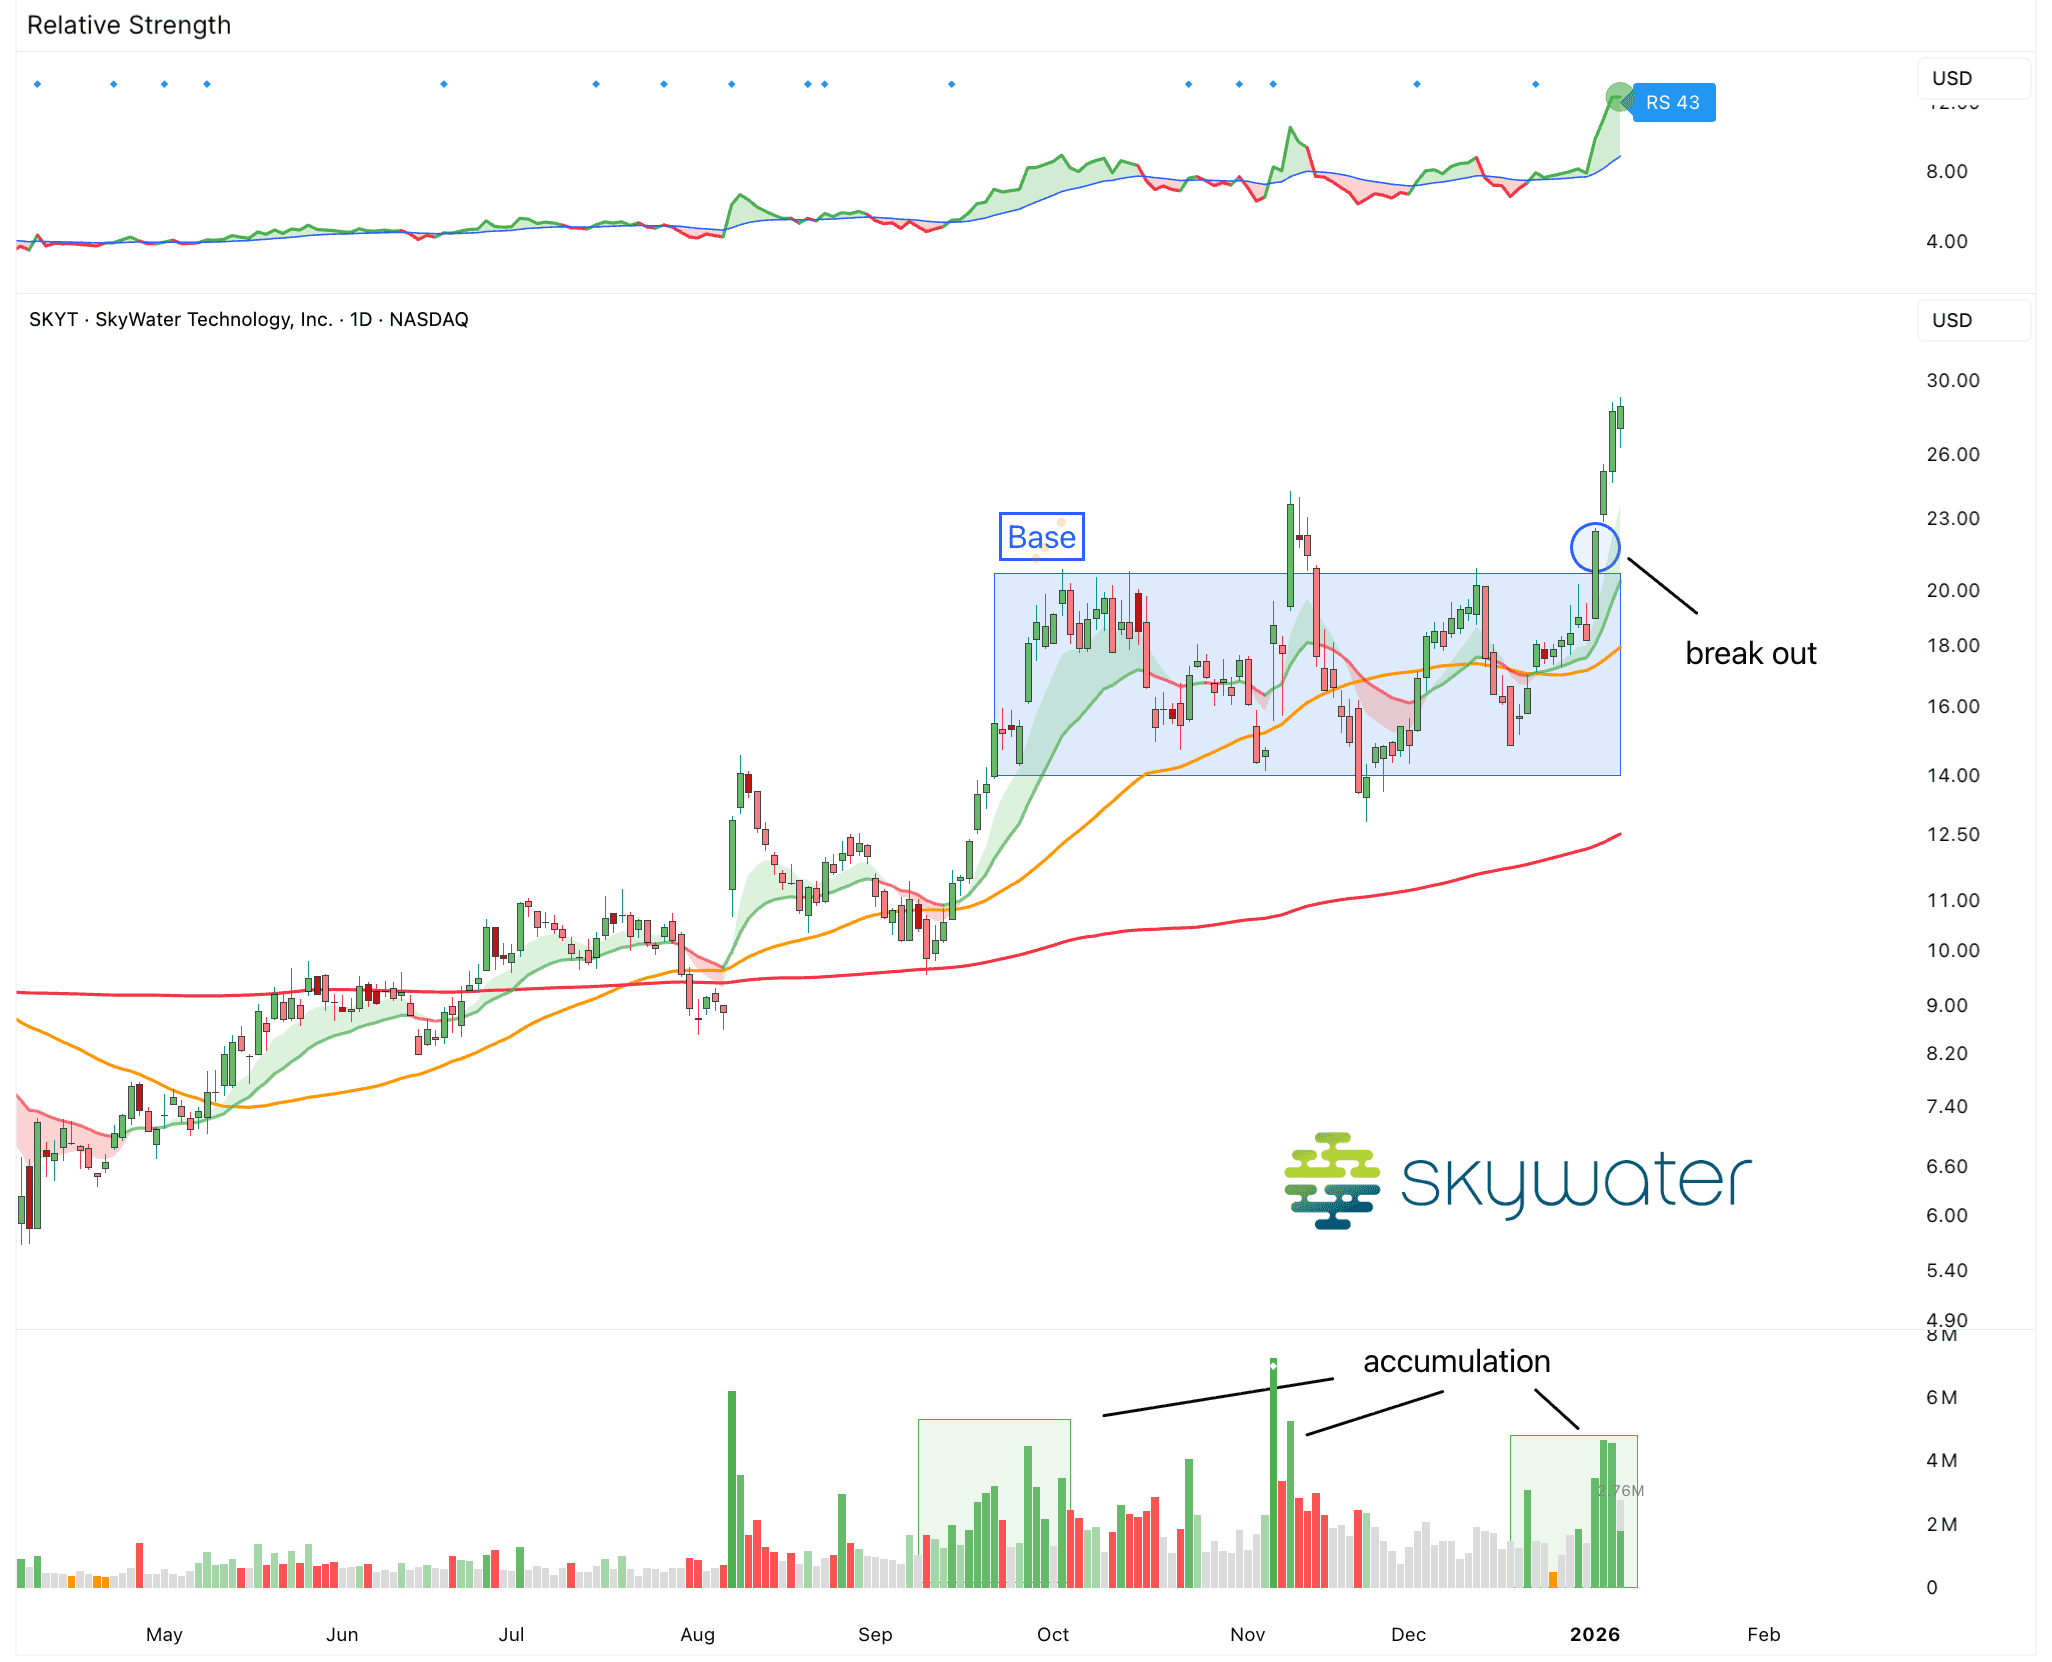
Stock to Watch: $SKYT
SkyWater is a pure play chip foundry.
That means it makes chips for other companies, similar to TSMC. Customers design the chips. SkyWater builds them in its own factories, called fabs. It does not sell its own chips or consumer products. Instead It works with fabless chip companies, large chip makers, and equipment companies that do not want to run their own fabs. And SkyWater focuses only on manufacturing and the engineering behind it.
SkyWater works very early in the chip process. Customers often come with just an idea or early design. SkyWater helps turn that idea into a real chip. This includes choosing materials, figuring out how the chip should be built on silicon, testing prototypes, and then producing the chips at scale. It supports the full path from design to volume production in the same fab.
This model is called Technology as a Service.
The big difference versus companies like TSMC is the type of chips SkyWater makes. Its chips are usually not the most advanced or smallest chips. Instead they are highly specialized. They are built for reliability, safety, and security. Many are radiation hardened for space and defense, mixed signal chips, MEMS, power devices, or fully custom designs.
These chips are used in aerospace and defense systems, cars, industrial equipment, medical and biotech devices, and some advanced computing and quantum related projects. These are the sectors where customers care more about trust, long lifetimes, and U.S. production than about the lowest cost or fastest node.
It’s been growing steadily until this recent quarter. In FY2024, the company did about $340M in revenue and was only barely profitable. Then last quarter alone, revenue jumped to around $150M, which is close to half of last year. That’s because their newly acquired fab in Texas added a ton of production capacity and revenue right away. Overall, business is accelerating.
At the same time, there has been noticeable institutional buying over the past few months. Large investors and institutions are building positions. And it just broke out of a 3 months long consolidation. This is one to watch very closely.
Lin
Market Update: The Next Phase of AI
Early January is one of my favorite times of the year.
Not just because it’s a fresh start, but because the biggest Consumer Electronics Show (CES) happens right now.
It’s the best glimpse into the future.
All the newest ideas and technologies show up here. AI. Robotics. Smart glasses. And a lot more. Watching it all makes my engineering heart beat faster and gets me incredibly excited about the future.
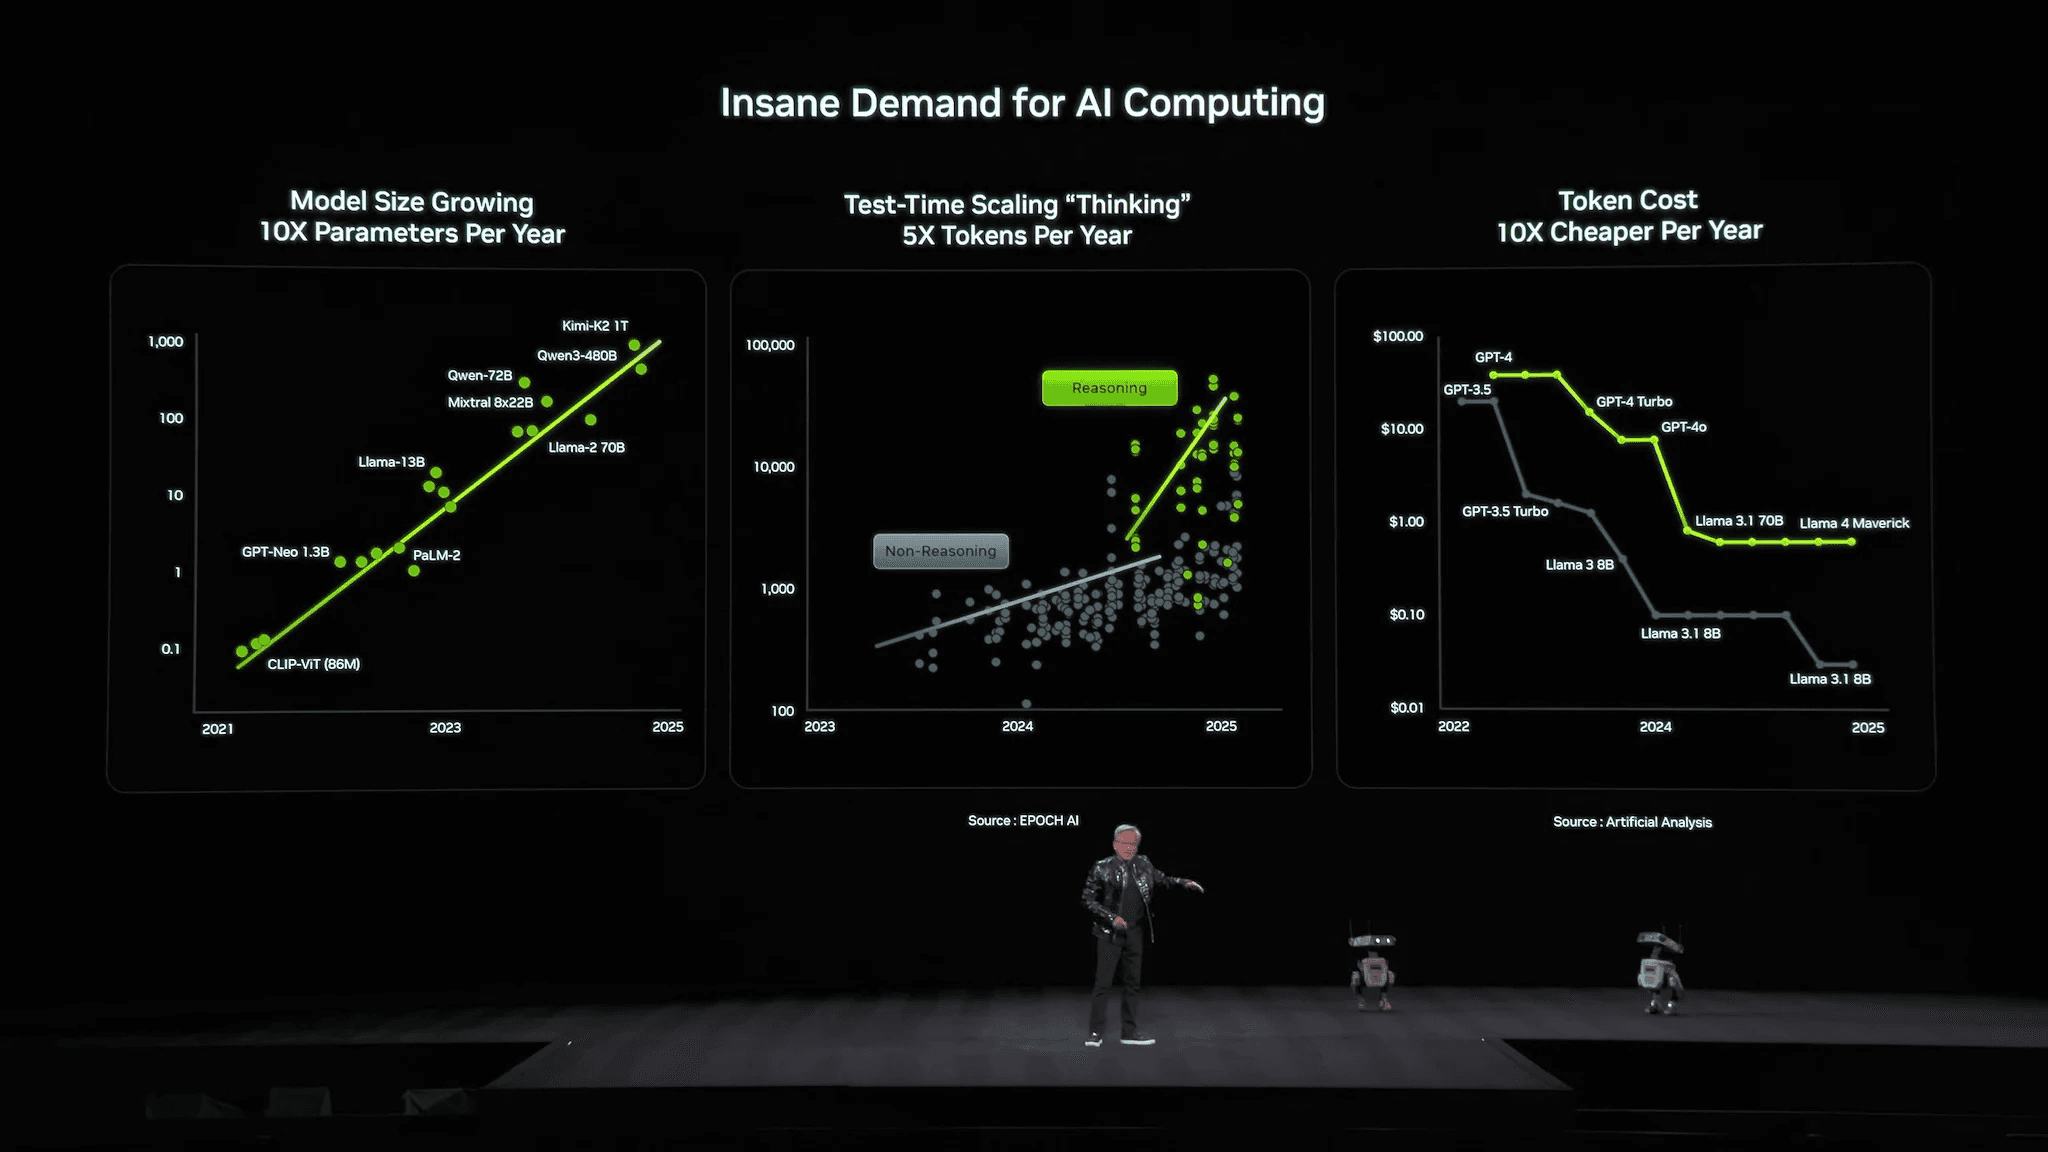
And one of the biggest names at CES is, of course, Nvidia.I highly recommend watching Jensen’s presentation. It’s really good. Many of the topics we’ve already discussed right here. You can watch it here.
But if you do not have the time, here’s the short version.
AI is moving at breakneck speed. It’s ten times bigger and advancing 10x faster than anything we’ve ever seen.
This is not a fad. This is a historic moment. It’s a turning point.
Most people overestimate what AI can do today. But they completely underestimate what it will be able to do in a year or two.
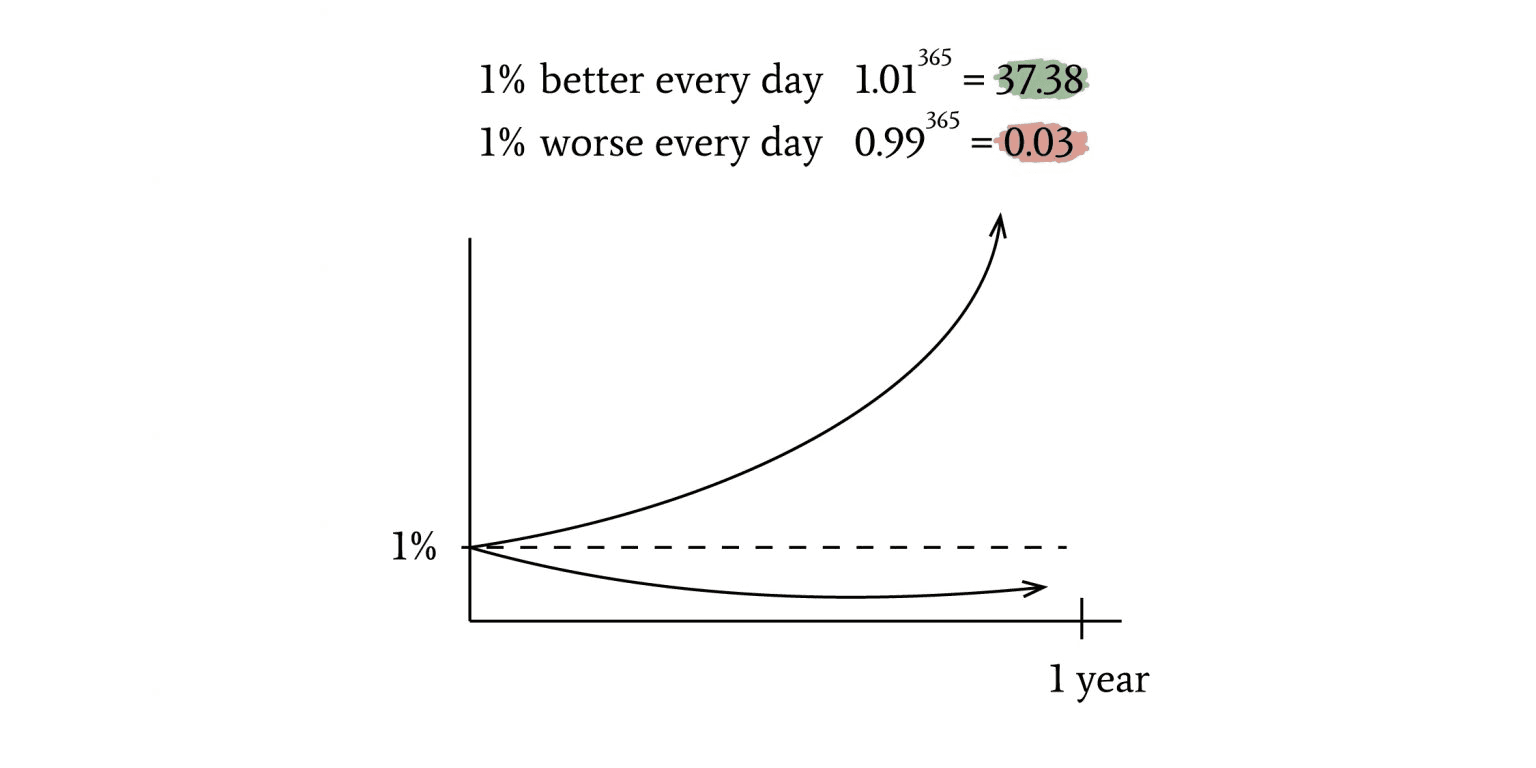
When you move at this incredible pace, every small improvement in technology compounds.
Just as a thought experiment, if you get better by 1% every day, you would be about 37x better by the end of the year.
Now imagine if you are not improving by just 1% but by much more.
So far, AI has mostly been limited to text. For most people, AI means chatbots like ChatGPT. You type something, it answers. But soon, we will move beyond natural language processing and LLMs. AI will become agentic and multimodal.
What comes next is much bigger.
AI will move beyond just understanding words. It will see images, hear sounds, watch videos, and understand the real world. This is what multimodal means. One system that can read, listen, watch, and respond all at once.
At the same time, AI will become agentic.
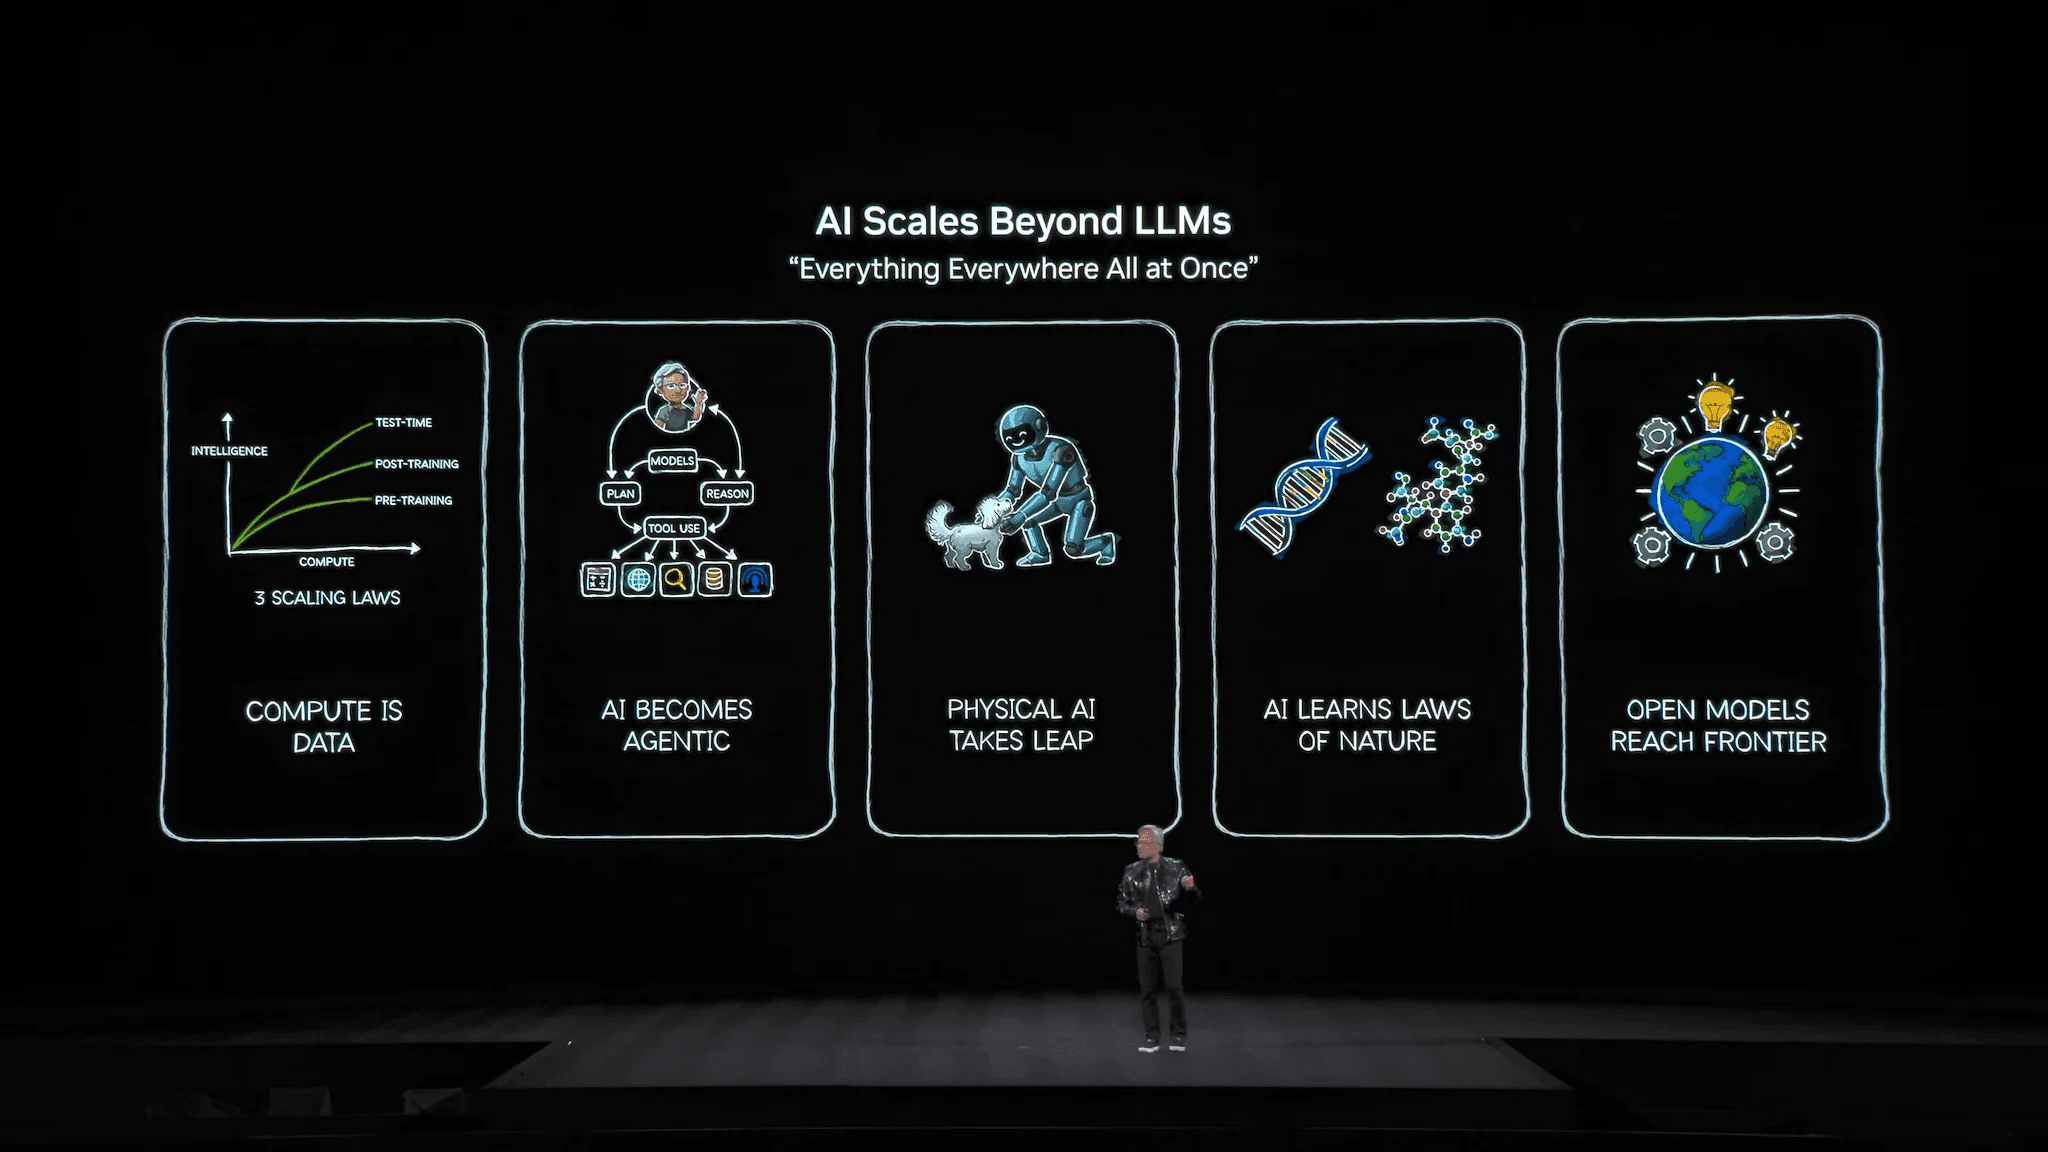
That means it will not just answer questions. It will take actions. It will plan steps, make decisions, use tools, and work toward goals on its own. Instead of asking AI to write an email, you will ask it to handle a task. It will decide what to do, when to do it, and how to do it.
AI will be able to call other AI agents to help. It will work with images and videos. And most importantly, it will handle real world tasks.
2026 is likely the year we see a real breakthrough moment. Think ChatGPT, but for physical AI. Robotaxis will likely roll out at scale, with humanoid robots following a year or two later.
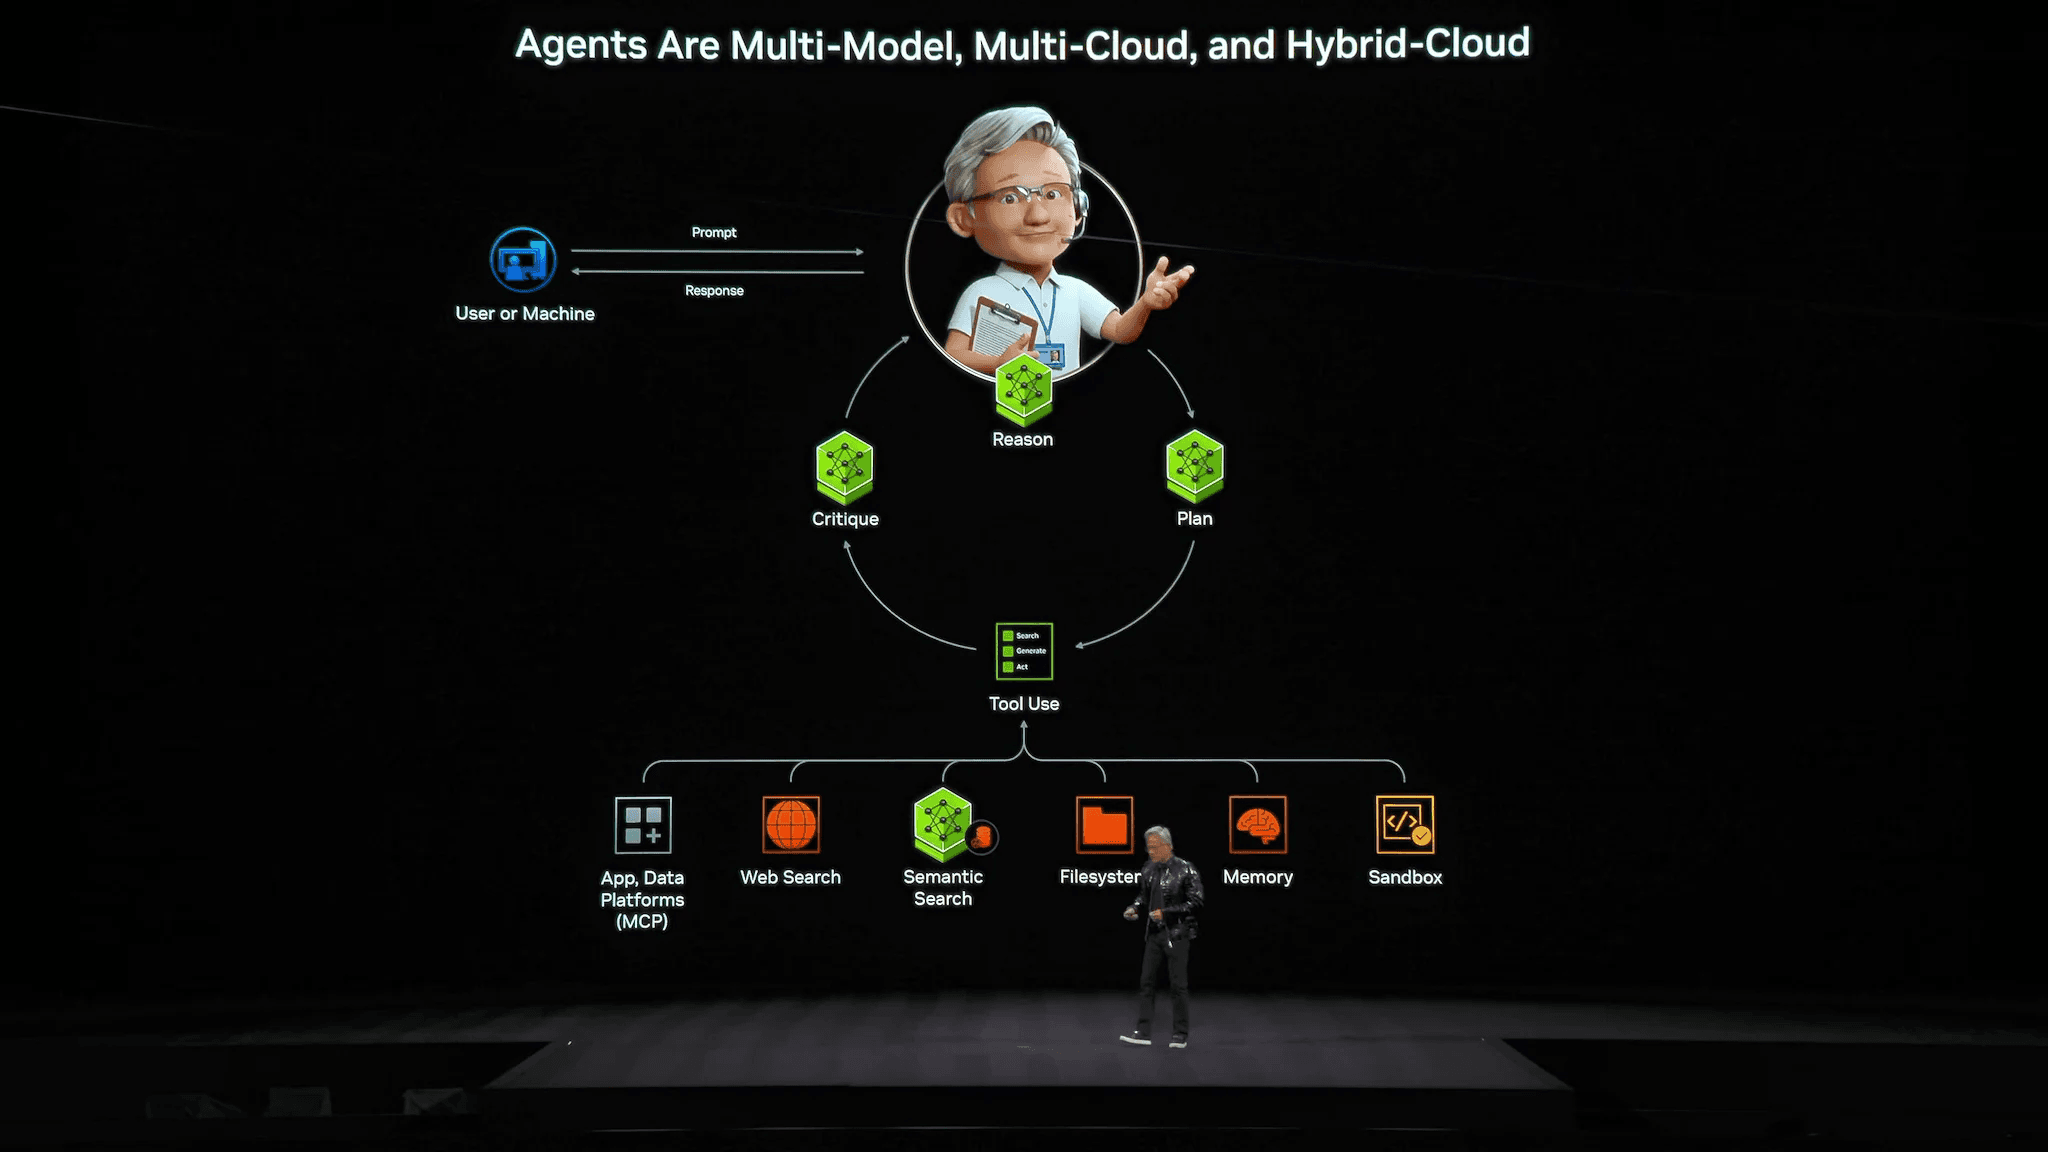
Nvidia just released a full new robotics stack. That includes robot foundation models, simulation tools, and specialized hardware. It wants to be a full stack robotics provider or the default platform for robotics, just like Windows became the default for PCs or Android for smartphones.

These are multi-trillion markets emerging from 0.
All of these require exponentially more compute: Text → Reasoning → Agents → Images → Videos → Physics → Real-word Applications
There is basically no limit for how much processing power we can use. Every jump in compute unlocks new things we simply could not do before.
AI is one of the rare platform technologies. It does not just create new products. It makes almost every other technology better at the same time.
And Nvidia is sitting on the forefront of this tech revolution.
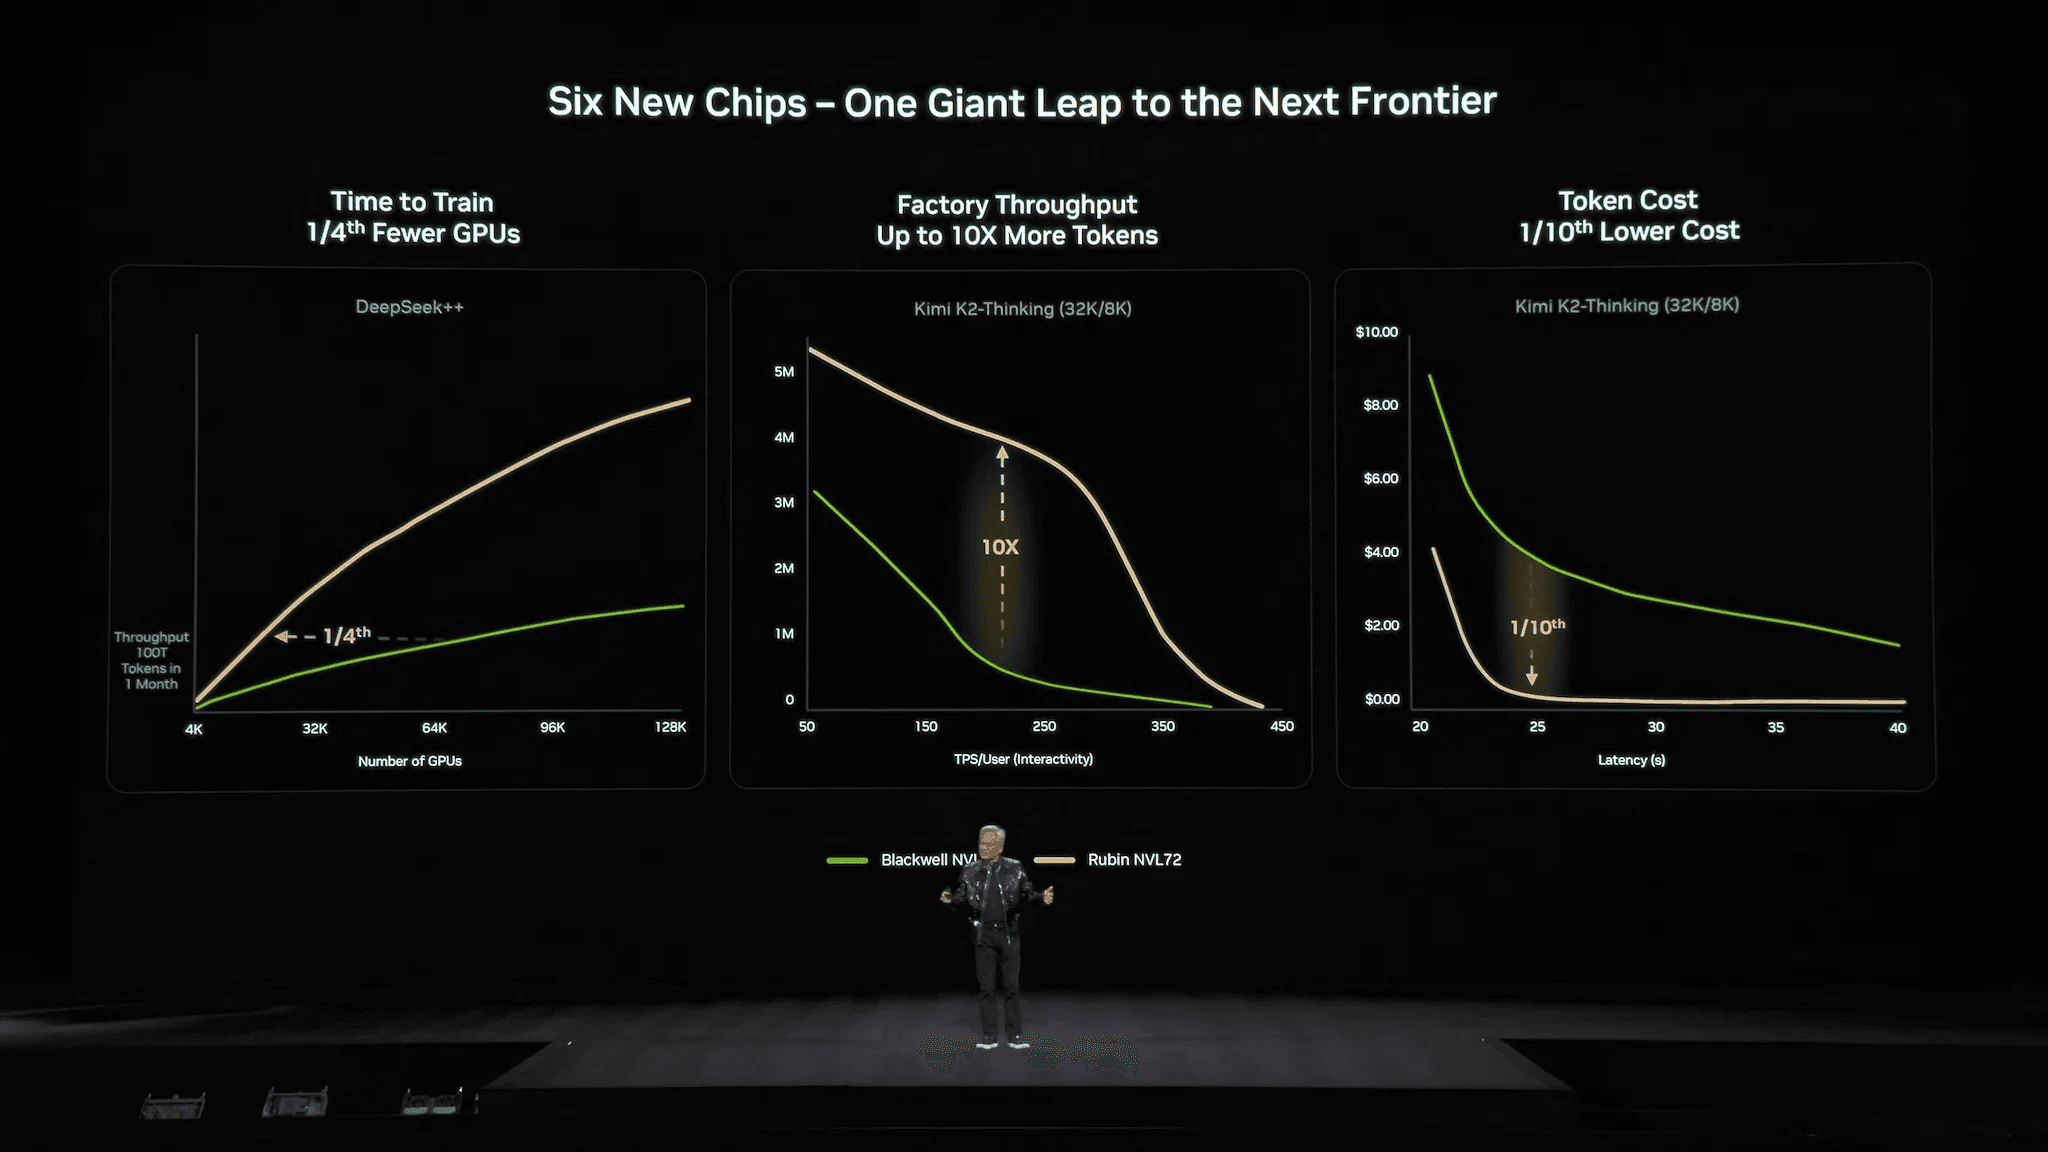
They just announced their next generation chips, called Vera Rubin. And it is not just one chip. It is actually 6 new chips, all redesigned from the ground up.
There is no doubt in my mind that Nvidia will stay at the frontier of innovation and continue to lead the AI era.

Lin
A Few Portfolio Changes
Here are a few new positions I’ve initiated:
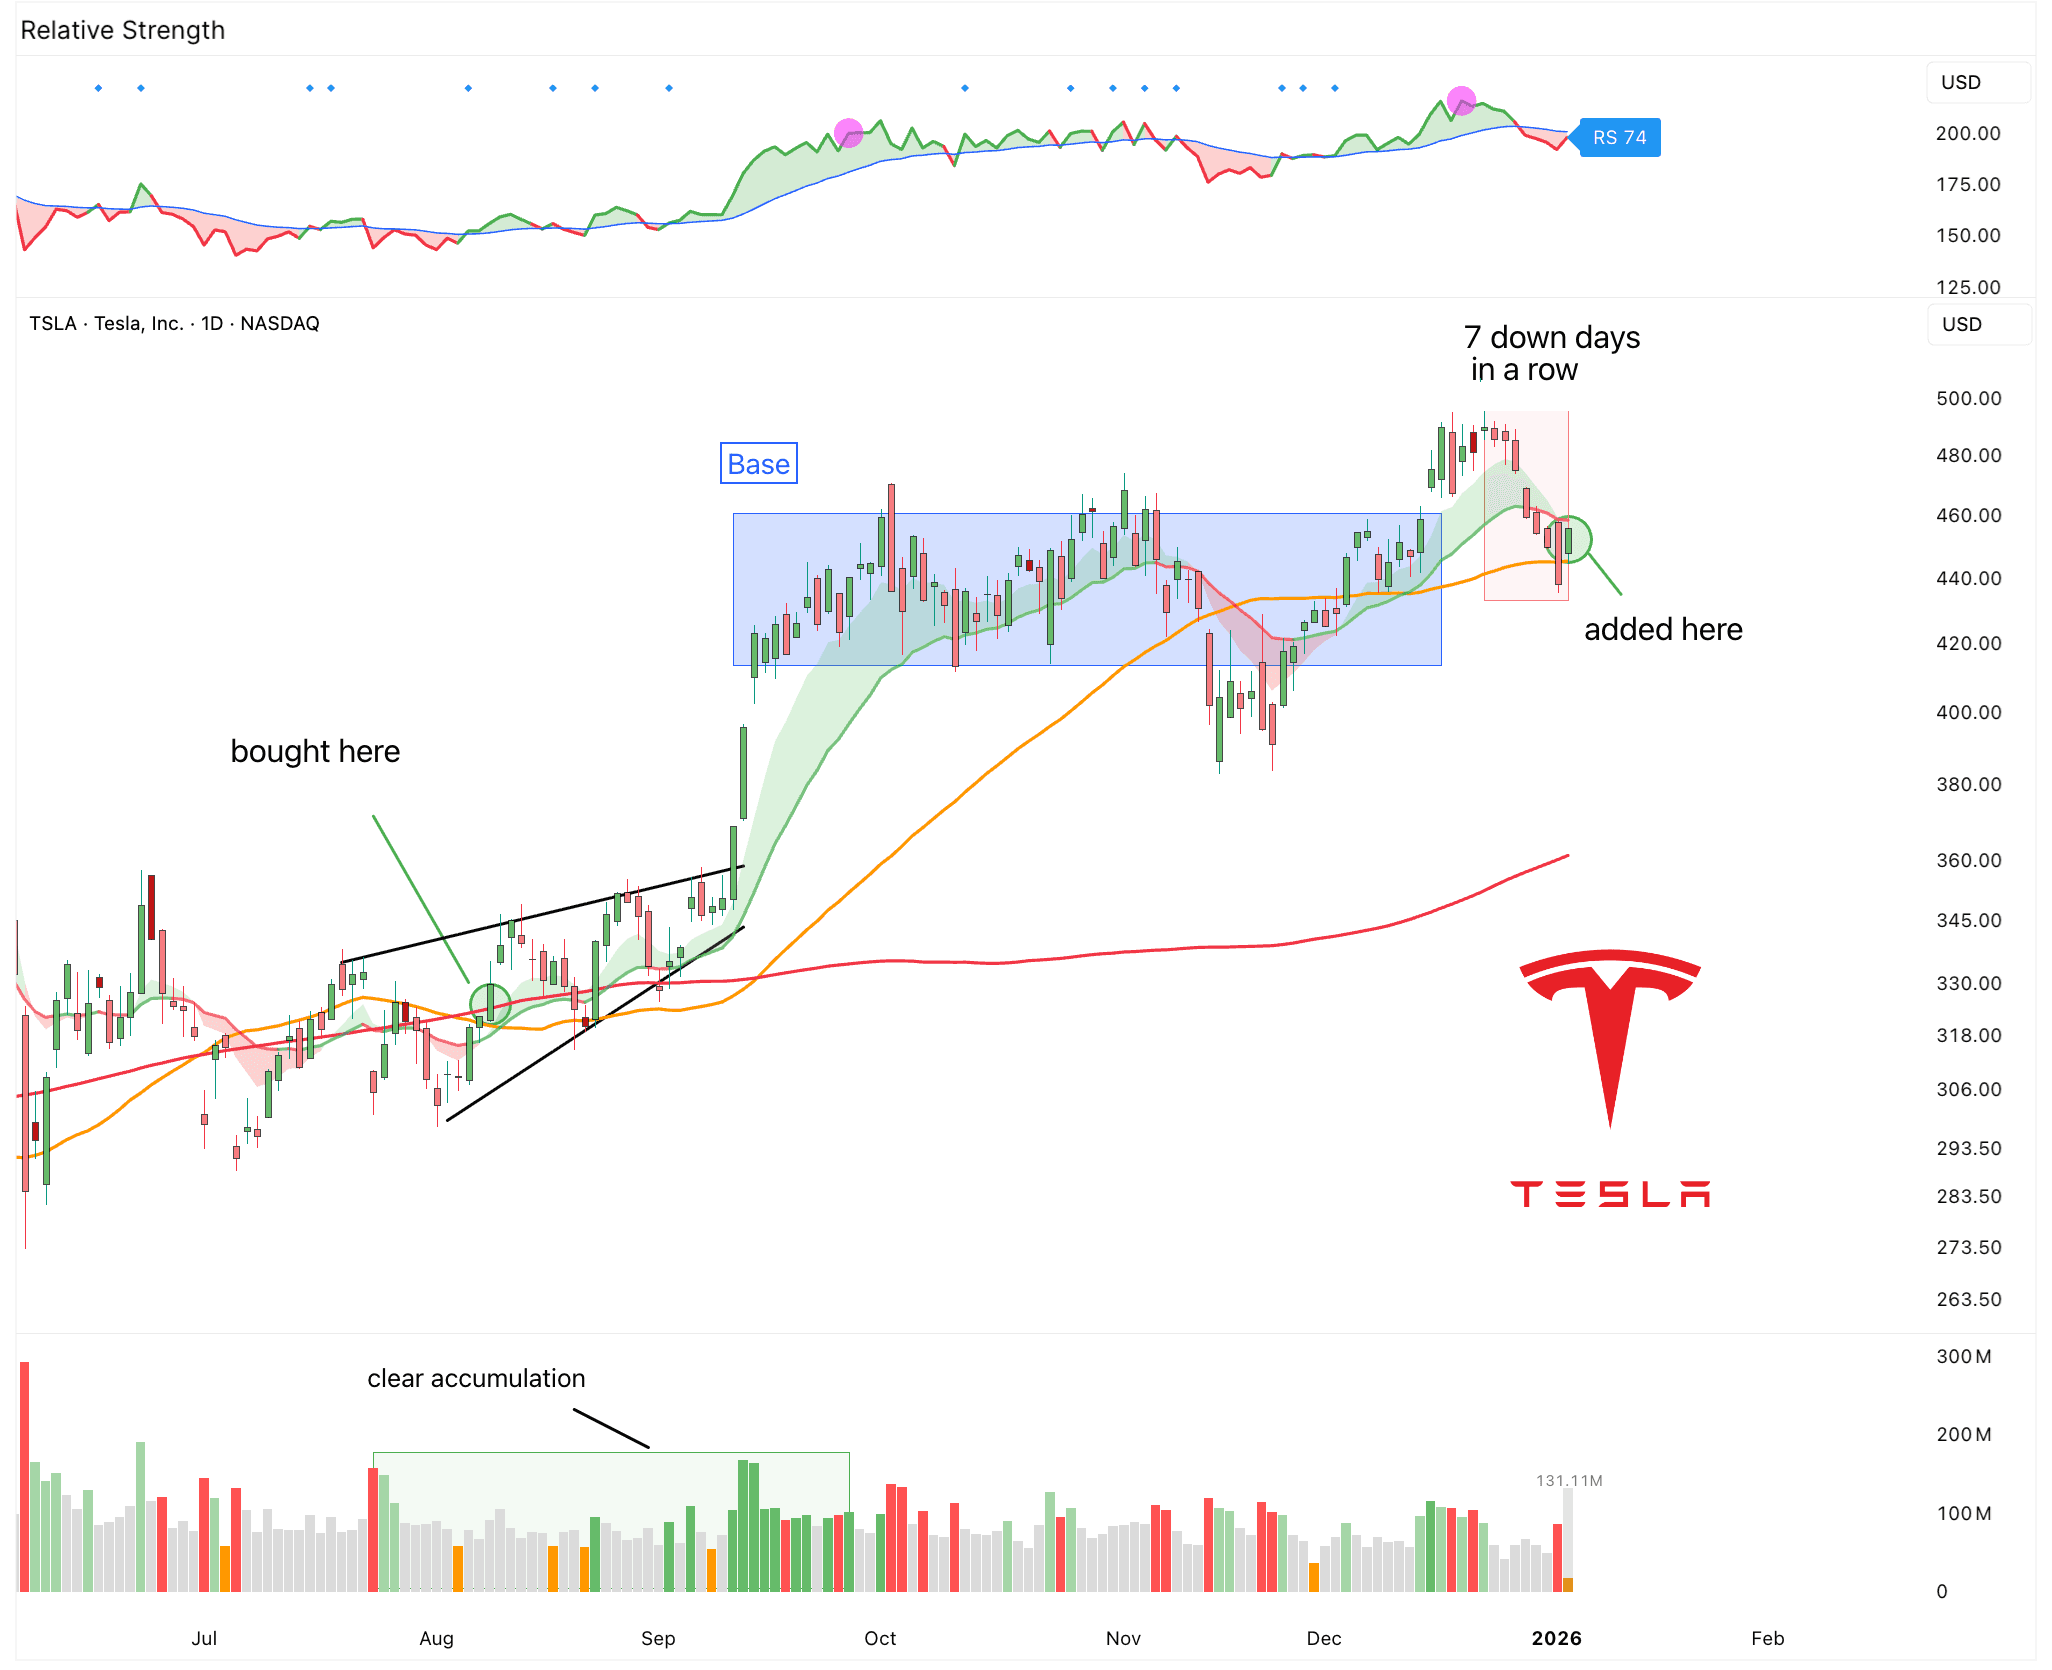
1. Add: Tesla ($TSLA)
I’ve talked about Tesla at length already.
2026 will be a critical year for Tesla. It has many potential tailwinds ahead. There are a few key highlights to watch this year: Cybercab production begins, without a steering wheel or pedals. Unsupervised FSD is solved. Optimus V3 is unveiled. Robotaxi expands more widely and sees broader adoption. Tesla Semi production starts. And the Tesla Roadster is unveiled.
Of course, Tesla still needs to deliver on its promises. But this could be a pivotal moment. With a potential SpaceX IPO coming, Elon has mentioned that Tesla investors could receive preferential treatment. We will see how that plays out.
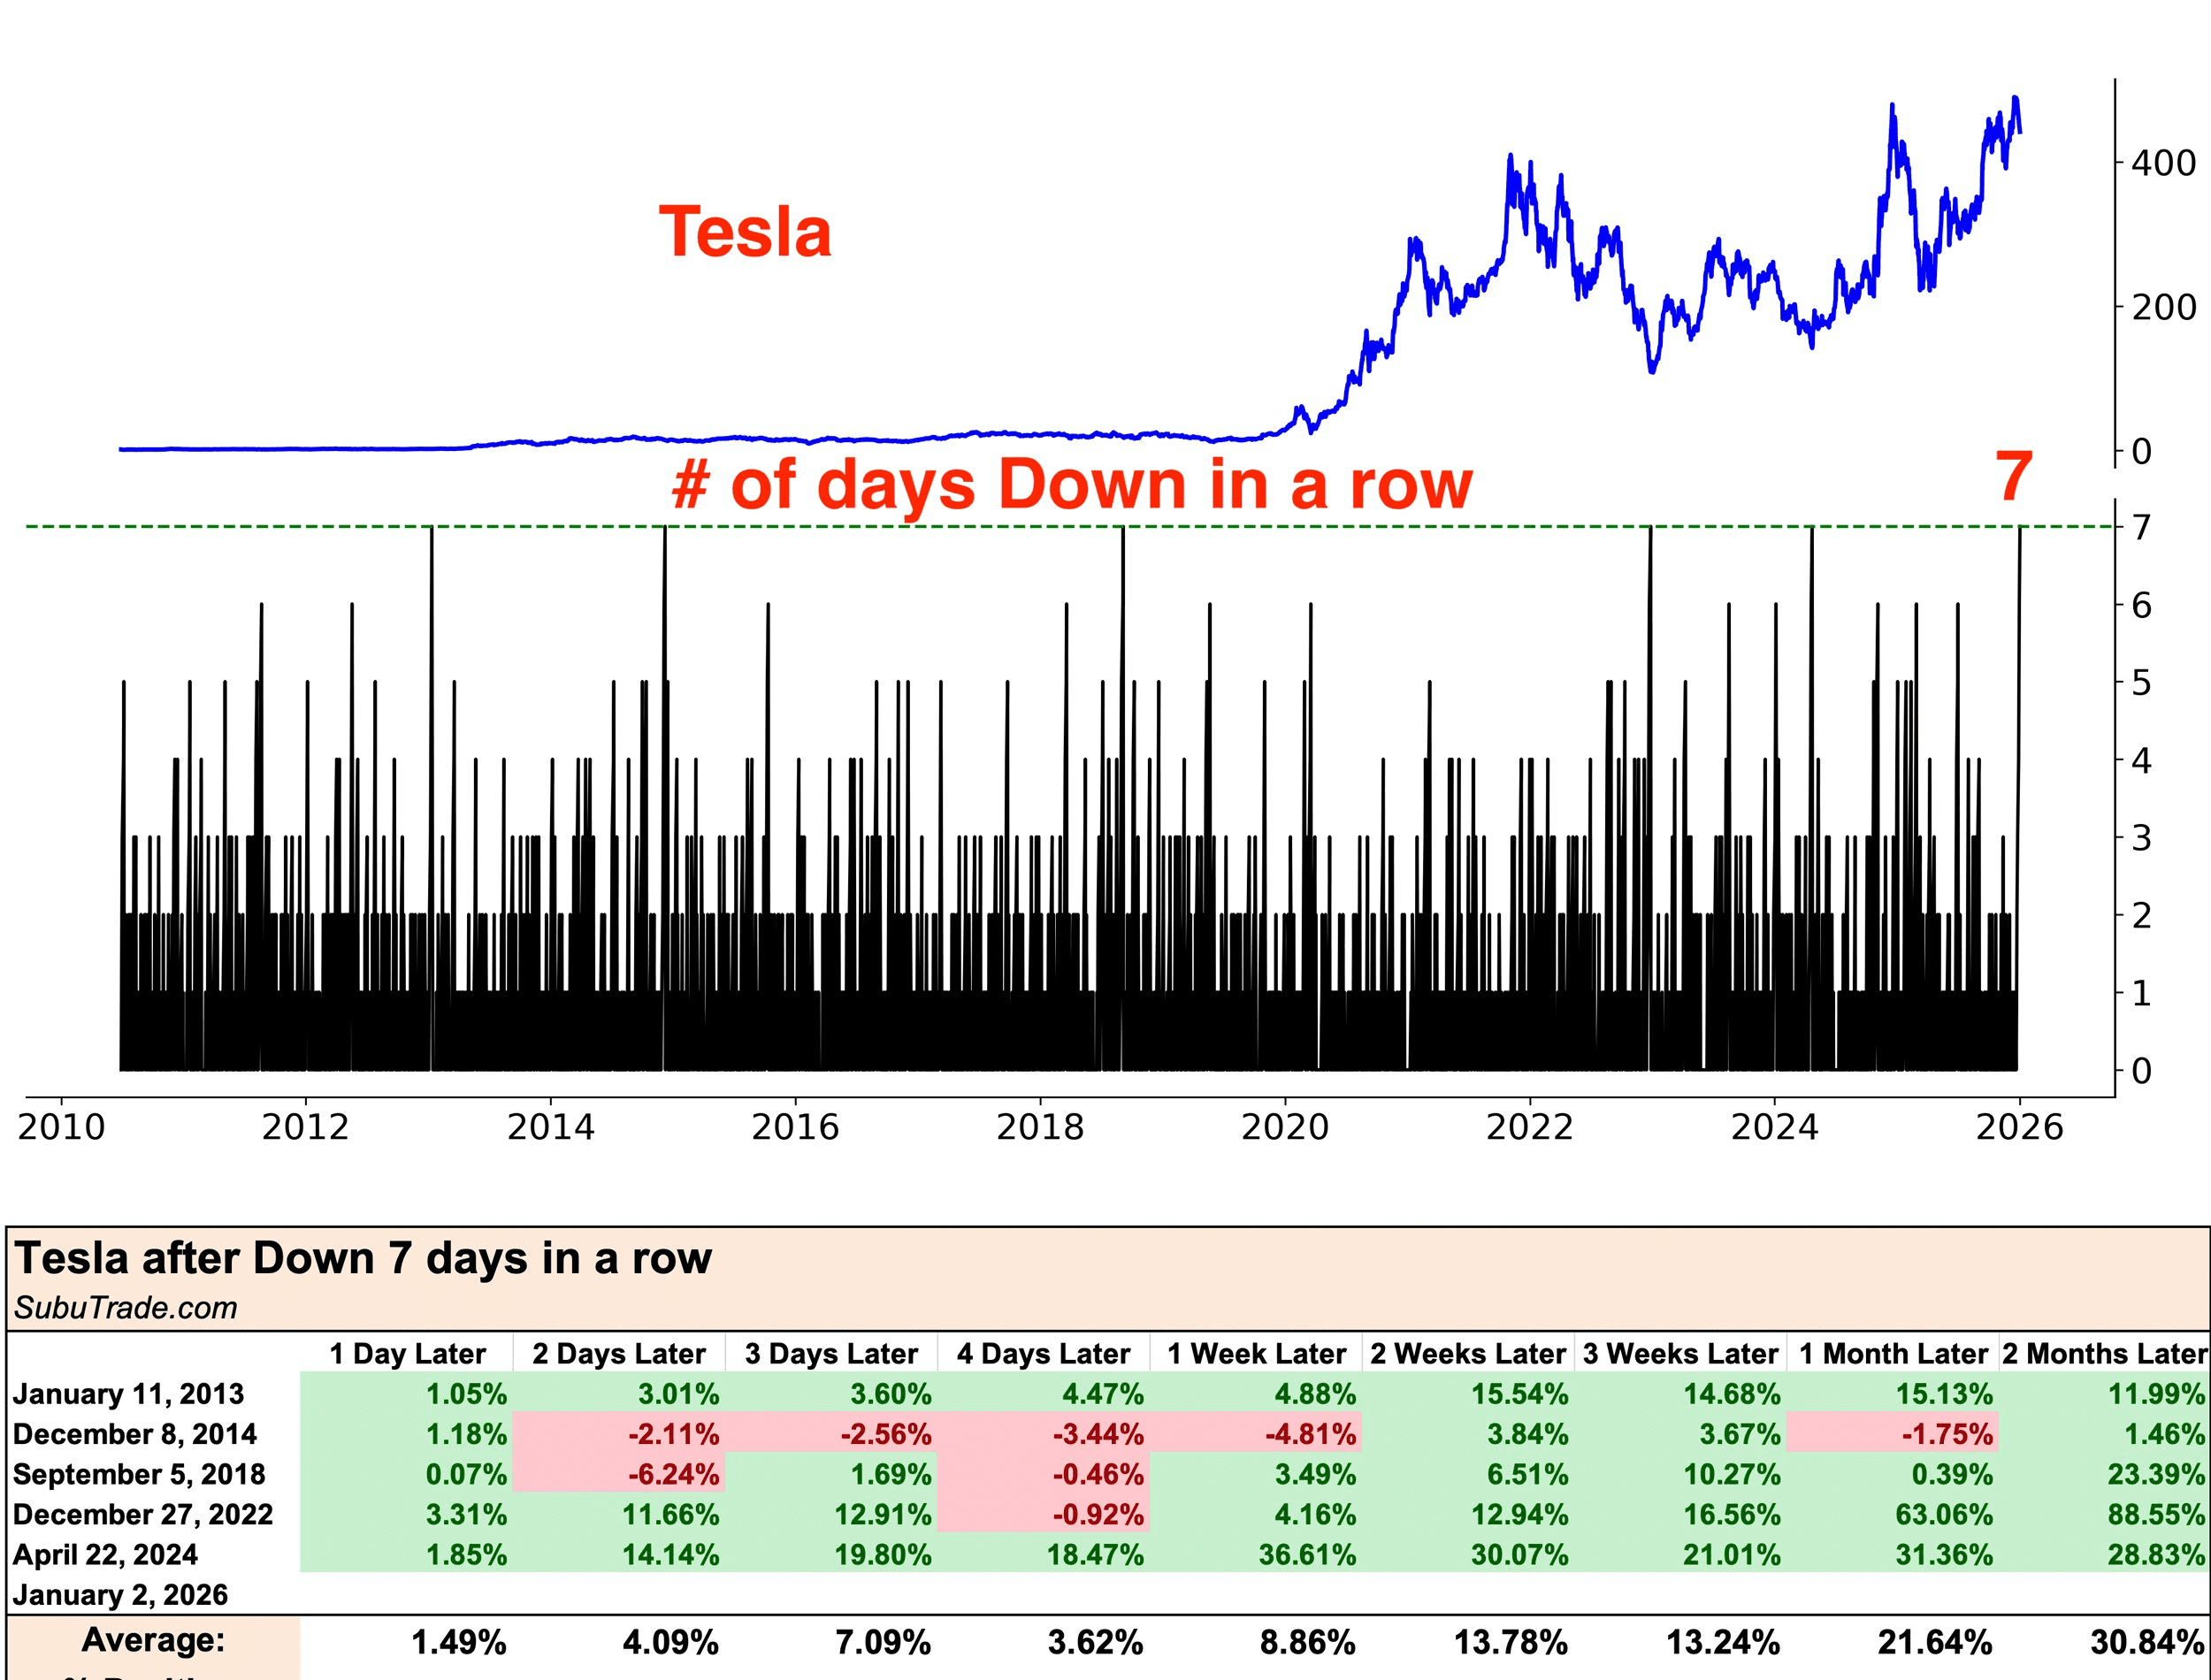
The stock is just below all time highs and has had 7 down days in a row. That is tied for the longest streak ever. Tesla has never fallen 8 days in a row. I have been waiting since August to add to my position, and this looks like a good opportunity.
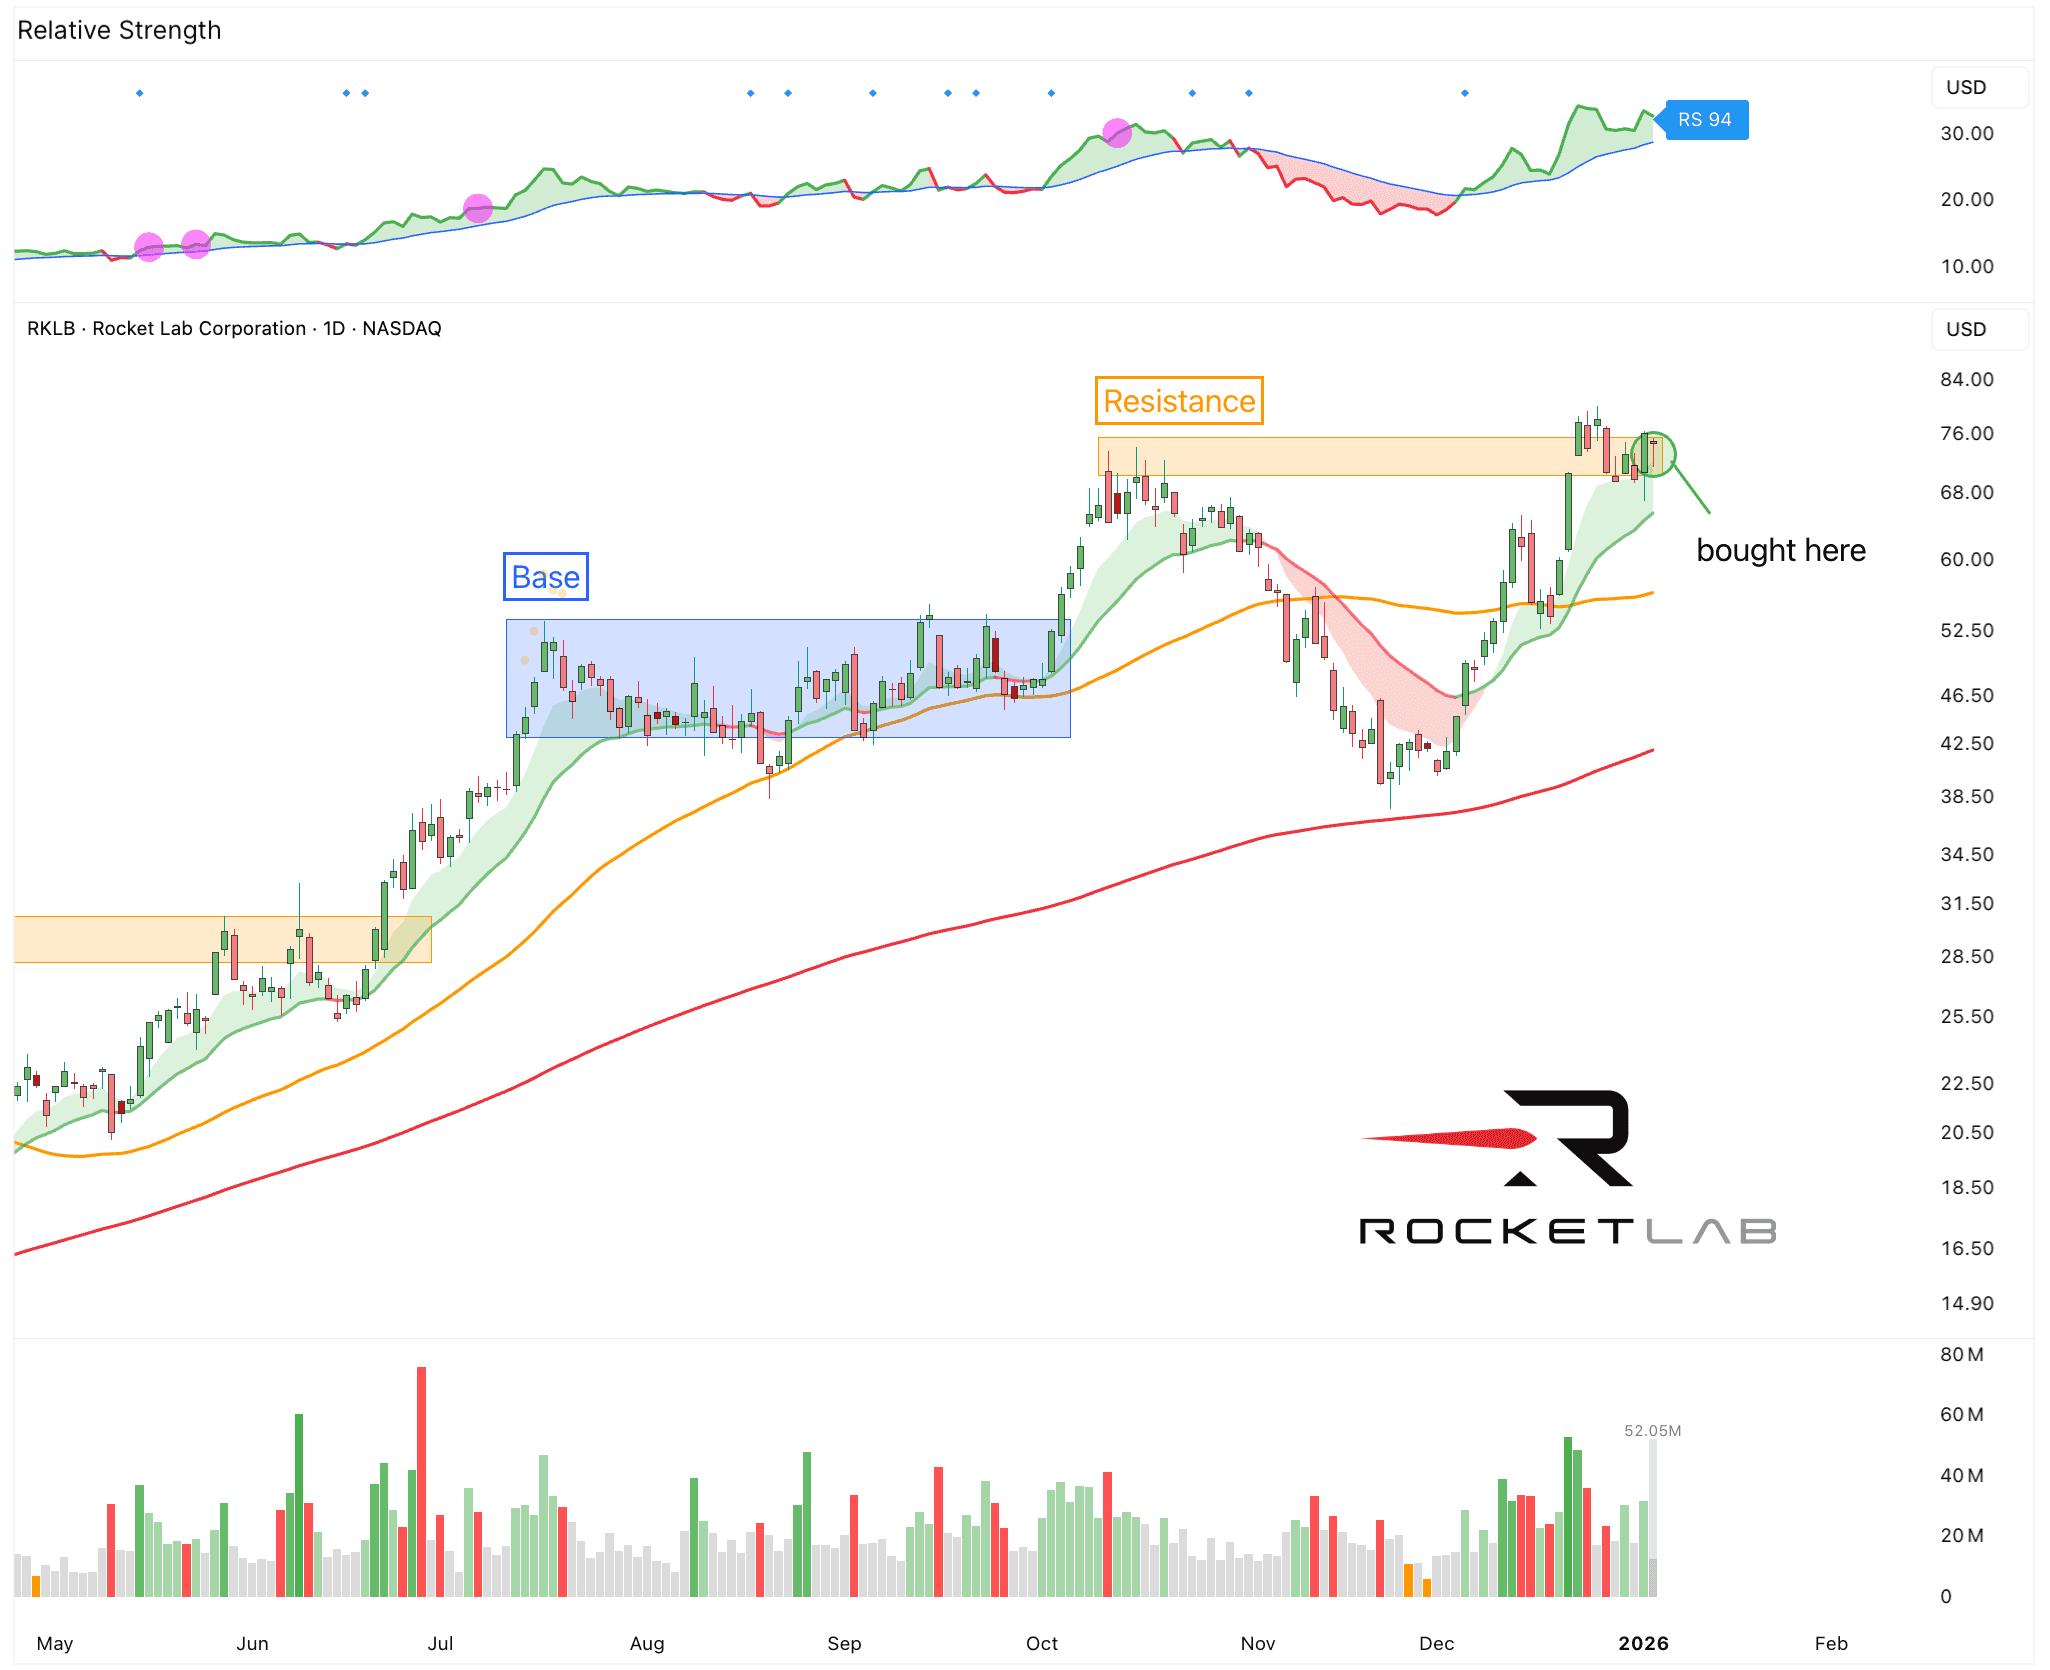
2. Buy: Rocket Lab ($RKLB)
As highlighted in my sector outlook, I wanted to get exposure to the Space sector. Hence, I used the pullback in RKLB today to initiate a position.
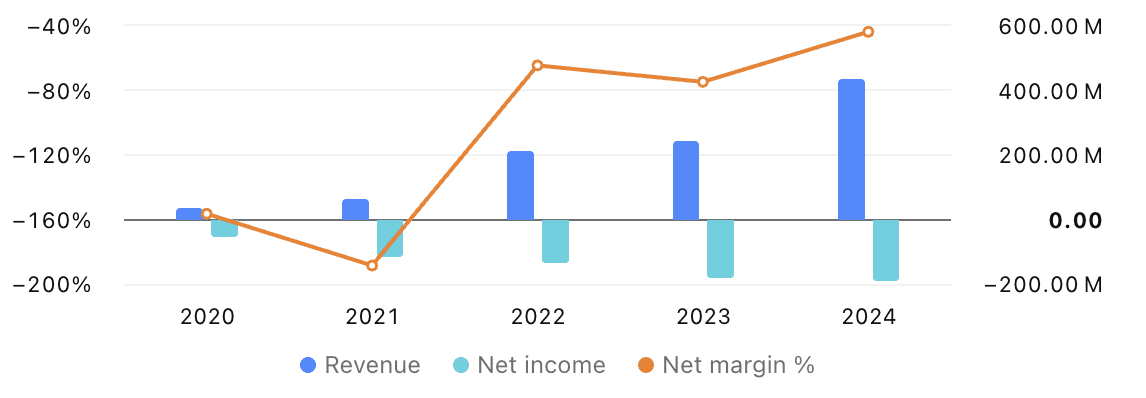
I’ve talked about Rocket Lab for a while now. It stands out as one of the few space companies already generating significant amount of revenue from both launches and satellite components. While it isn’t profitable yet, the company is investing heavily in new technology and long-term growth.
It’s one of the few public companies with a real shot at competing in the multibillion-dollar space industry.
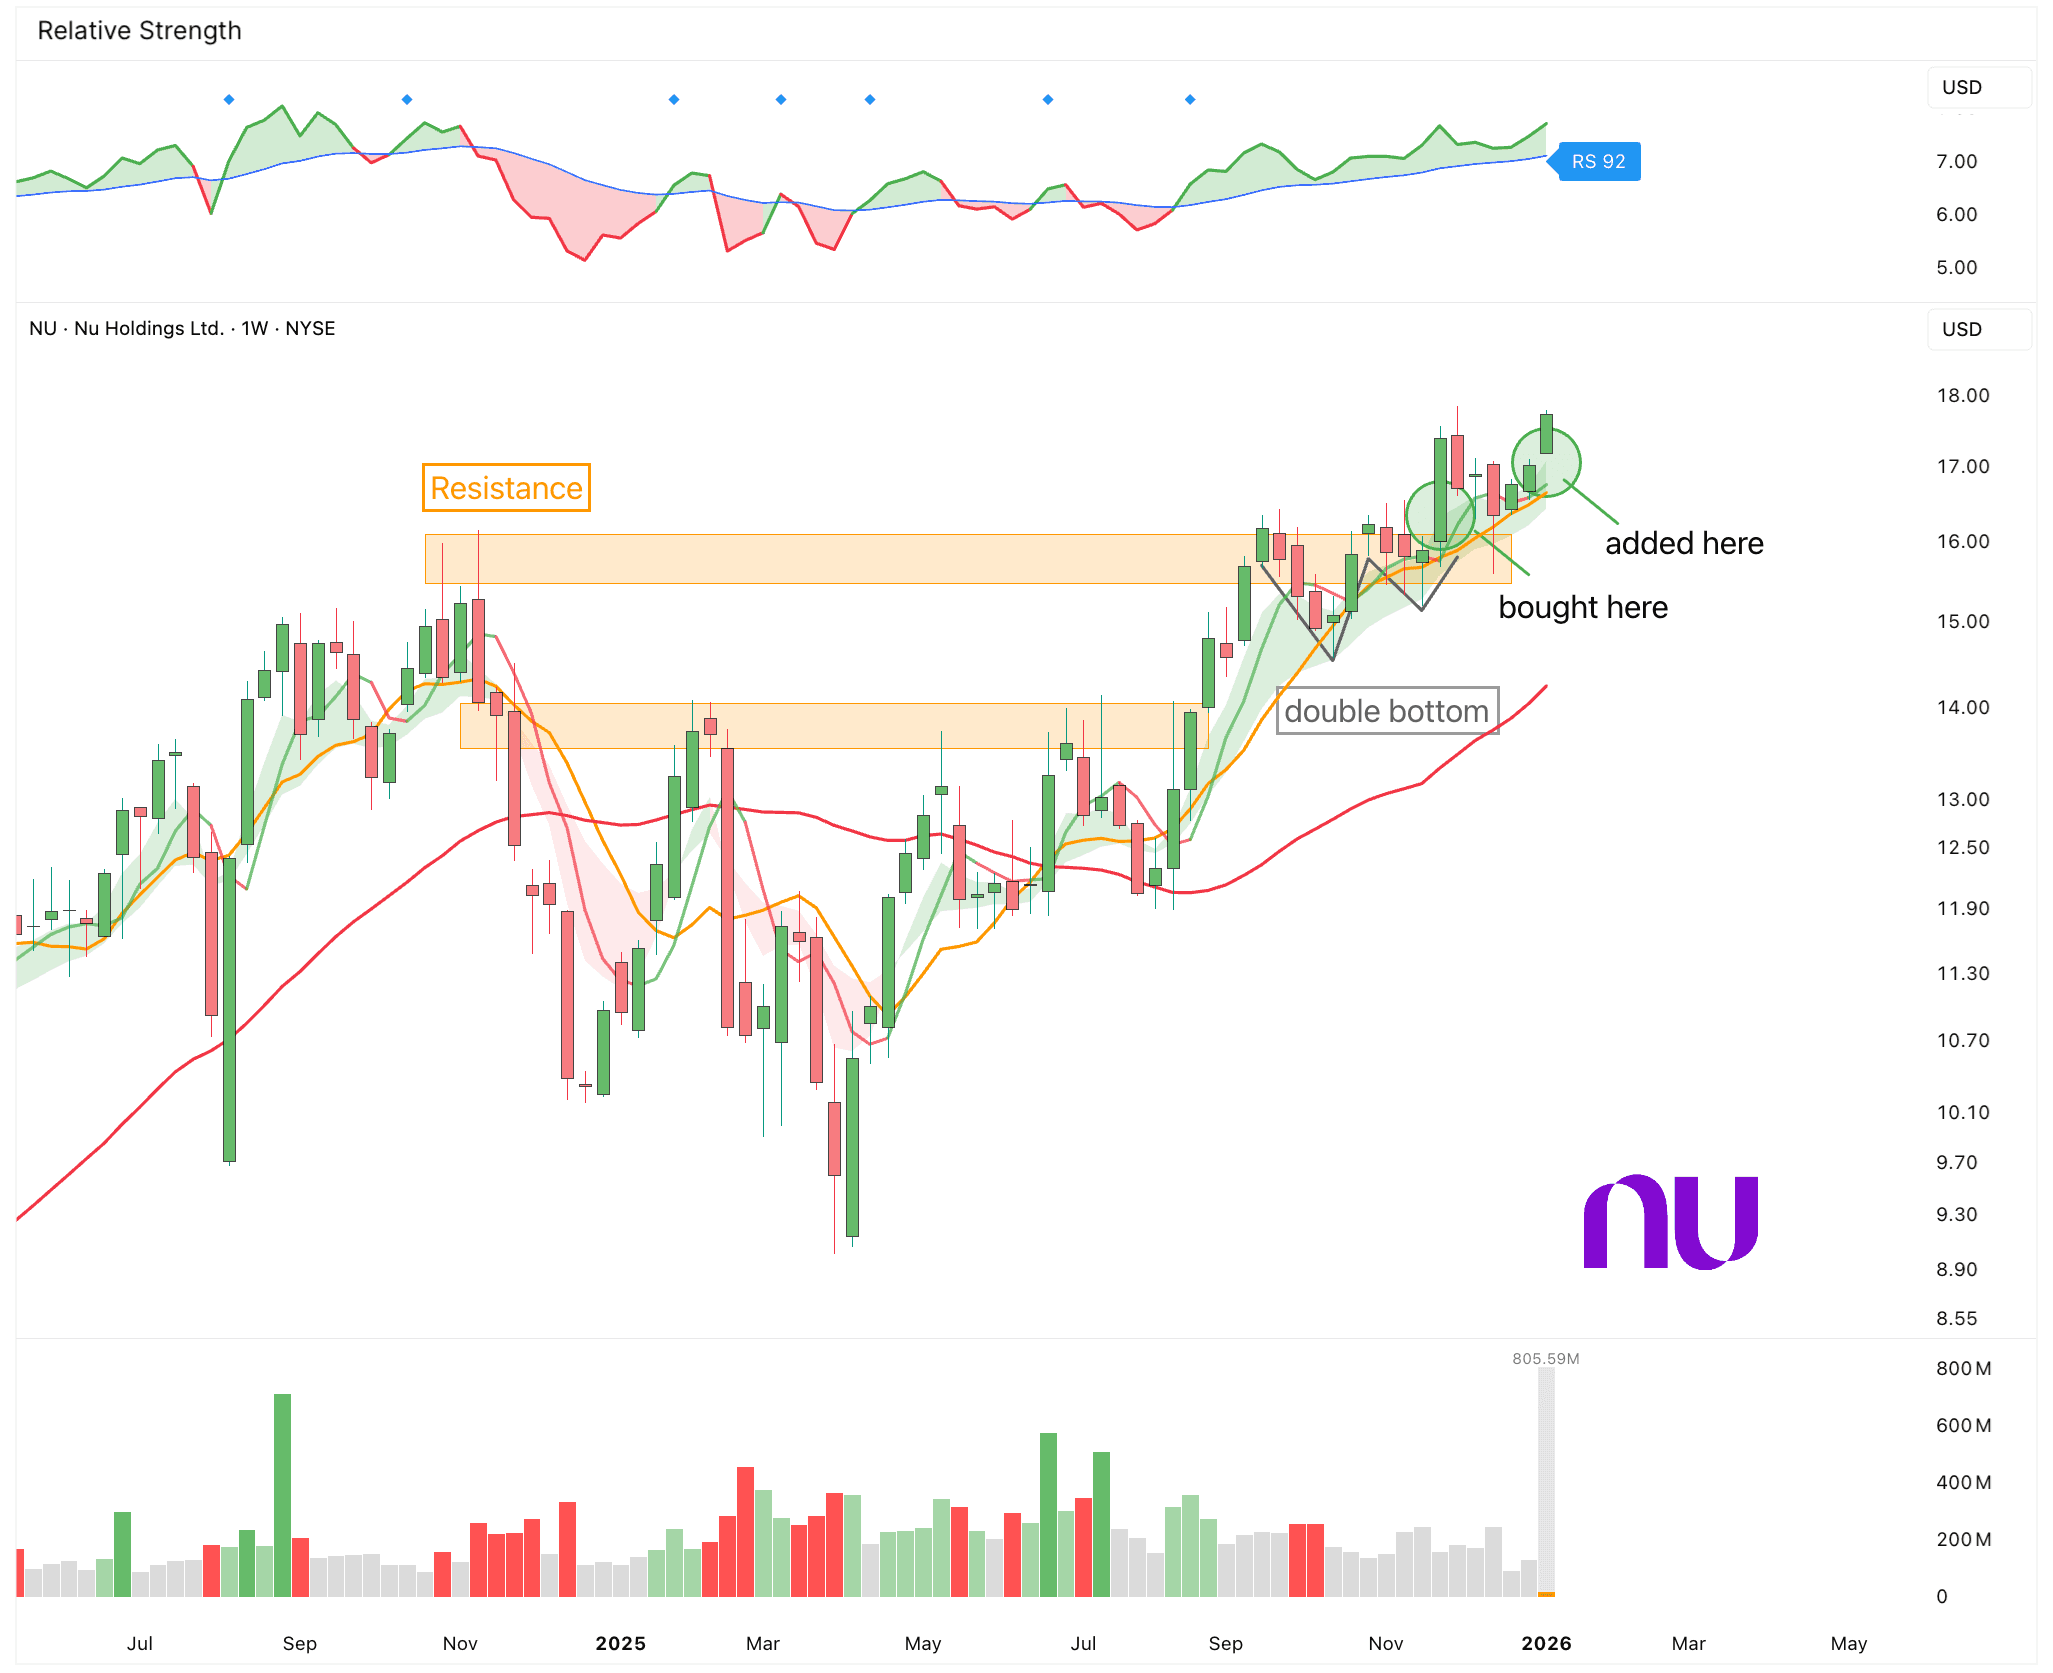
3. Add: Nu Holdings ($NU)
I’ve also added to my NU position.
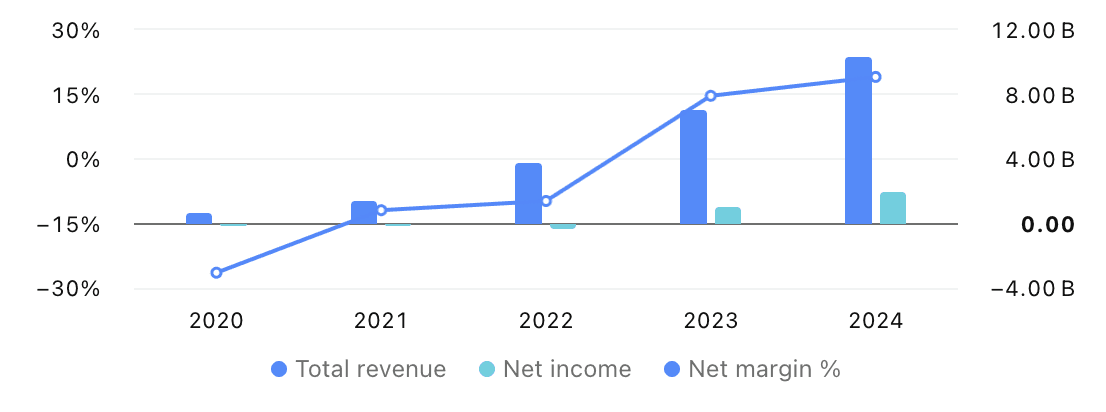
Nu is building a large digital bank with a lean cost structure and a broad product portfolio on top of it. And the bigger it grows, the more data it collects, better its systems become. And even with all that growth it is still at a reasonable 30 PE.
After the initial break out a few weeks ago, it did a perfect retest and is now approaching new all-time highs.
Lin
Weekly Market Update: Venezuela Attack
Most of you have probably seen the news.
The US just attacked Venezuela. We can only speculate what Trump’s exact motivation is. But it’s likely not just benevolence. And it likely has a lot to do with Venezuela’s resources. In fact, it’s one of the richest countries in the world when it comes to natural resources.
Venezuela has significant, yet largely undeveloped, deposits of rare earth elements.
Estimates show Venezuela has the 12th-largest iron ore reserves in the world.
And most importantly, Venezuela holds hundreds of billions of barrels of oil reserves, one of the biggest in the world. However, much of this is heavy crude oil, which is far more expensive to extract because it’s harder to process and requires more advanced machinery.
Not only does Venezuela hold oil, but it also holds a lot of gold. While gold is currently trading at all-time highs, many economies like BRICS have been stocking up on reserves.
We’ll likely find out more soon.

2026 is already off to a wild start. Whatever happens next, it’s clear that we’ll be in some rough waters this year. It’s also safe to assume that there will be plenty more surprises to come. So buckle up.
Volatility will definitely be a constant companion this year.
Interestingly, geopolitical events tend to be short-lived. Initially, markets sell off because of increased uncertainty, but historically, they recover quickly.
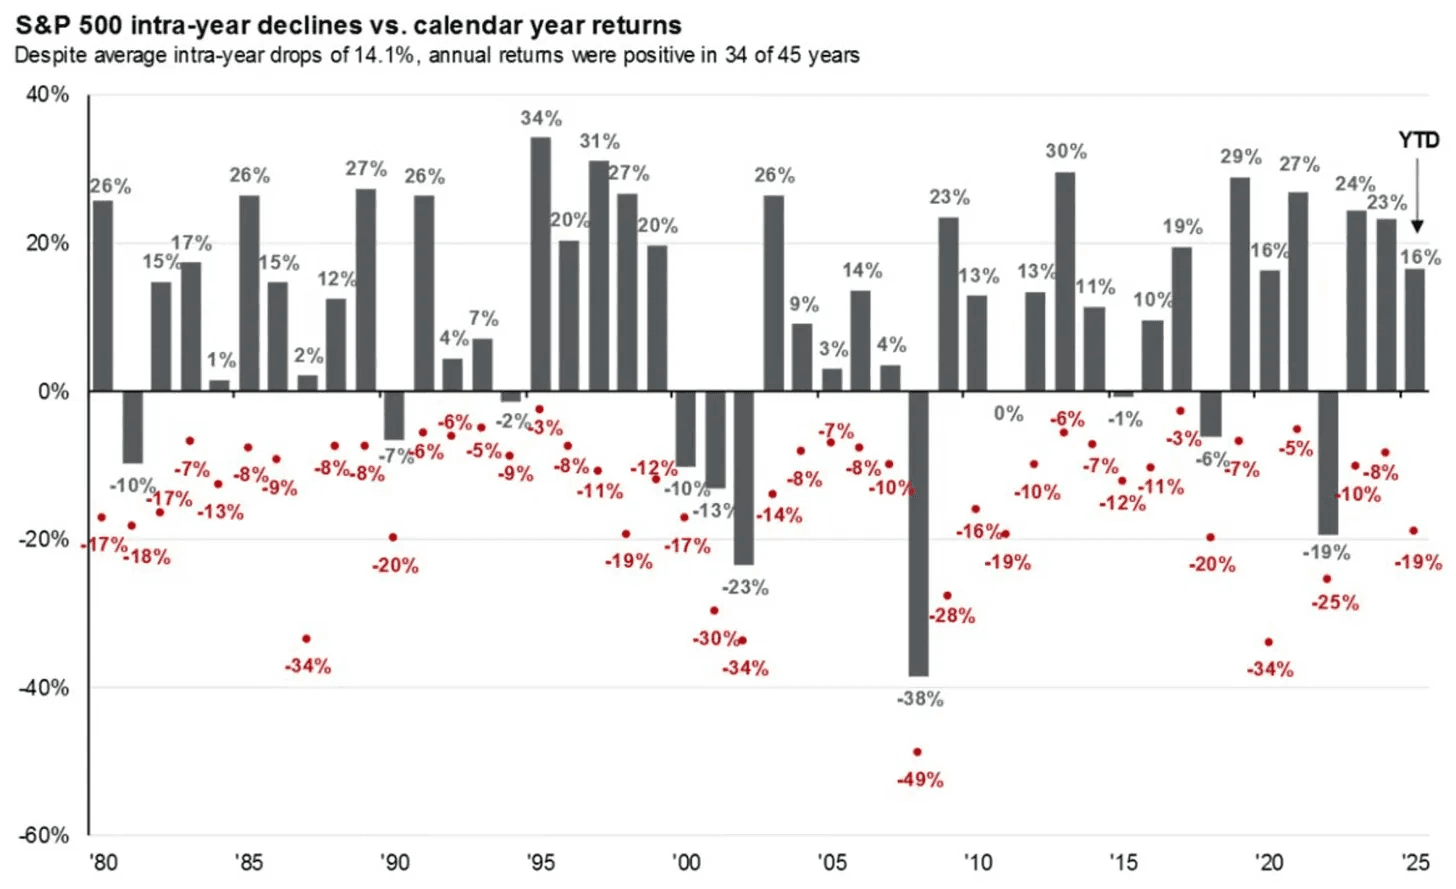
One thing to note, especially at the start of a new year, is that even during good years, corrections are pretty normal. The path isn’t just straight up. There are always drawdowns. Last year, the largest drawdown was 19%. And as you can see below 8–10% corrections are very common even in good years.
One thing I’m wary about is that everyone on Wall Street expects the market to just keep heading higher and continue rallying in 2026. They all seem to be in sync. Everyone is on the same side of the boat. But the market rarely does what…
Lin
The Key Sectors For 2026
I hope you all had a fantastic start to the new year.
Although 2025 was one of the busiest years of my life, it was also one of the most rewarding. It always shocks me how far you can get in 12 months if you really set your mind to it and go after your goals. It won’t be easy, though. You have to show up every day, even when you don’t feel like it. But it will be worth it.
It takes one year to change your life. Why not this one?
A year from now, you’ll wish you had started today.
One of my favorite things to do at the beginning of a new year is to hit pause, look back, and reflect. An exercise I like to do every year is an annual review.
It’s simple. Grab a notepad and create 2 columns: positive and negative. Now go through the past year and write down all the highlights and lowlights. Put them in their respective columns. Once you’ve gone through the year, look at your list and ask, “What 20% of each column produced the most reliable or powerful peaks?” Based on the answers, take your positive leaders and do more of them in the new year.
This works for almost anything. Review your investment portfolio. Write down what went well. What didn’t. What you would have done differently. What you want to keep doing. Who and what helped you the most. Do this for any part of your life you want to improve: relationships, career, business, sports, anything.
This is one of the most effective and fastest ways to improve, because you can only improve what you track. If you don’t track it, you’ll never get better.
Block 1 or 2 hours. I’ve been doing this for years, and it has helped me tremendously.
A new year means a new opportunity.
The good thing about a new year is that you can treat it as a blank slate. All the wins, losses, mistakes, and lessons from last year can be left behind. You don’t have to carry them over.
For some, it’s just another day. But psychologically, it can be much more.
It can serve as a good reset.
Now on to the market.
….
Lin
Weekly Market Update: The Final Countdown
This has been one of the greatest market comebacks in history.
What a year.
I don’t think anyone had the slightest idea how eventful 2025 was going to be.
Back in April, the S&P 500 was down over 15% on the year, its 4th worst start ever. After a 38% rally, it’s now up 17% on the year, hitting 38 all time highs along the way, just in time for Christmas. 7000 is now a fingertip away.
This has been one of the greatest market comebacks in history.
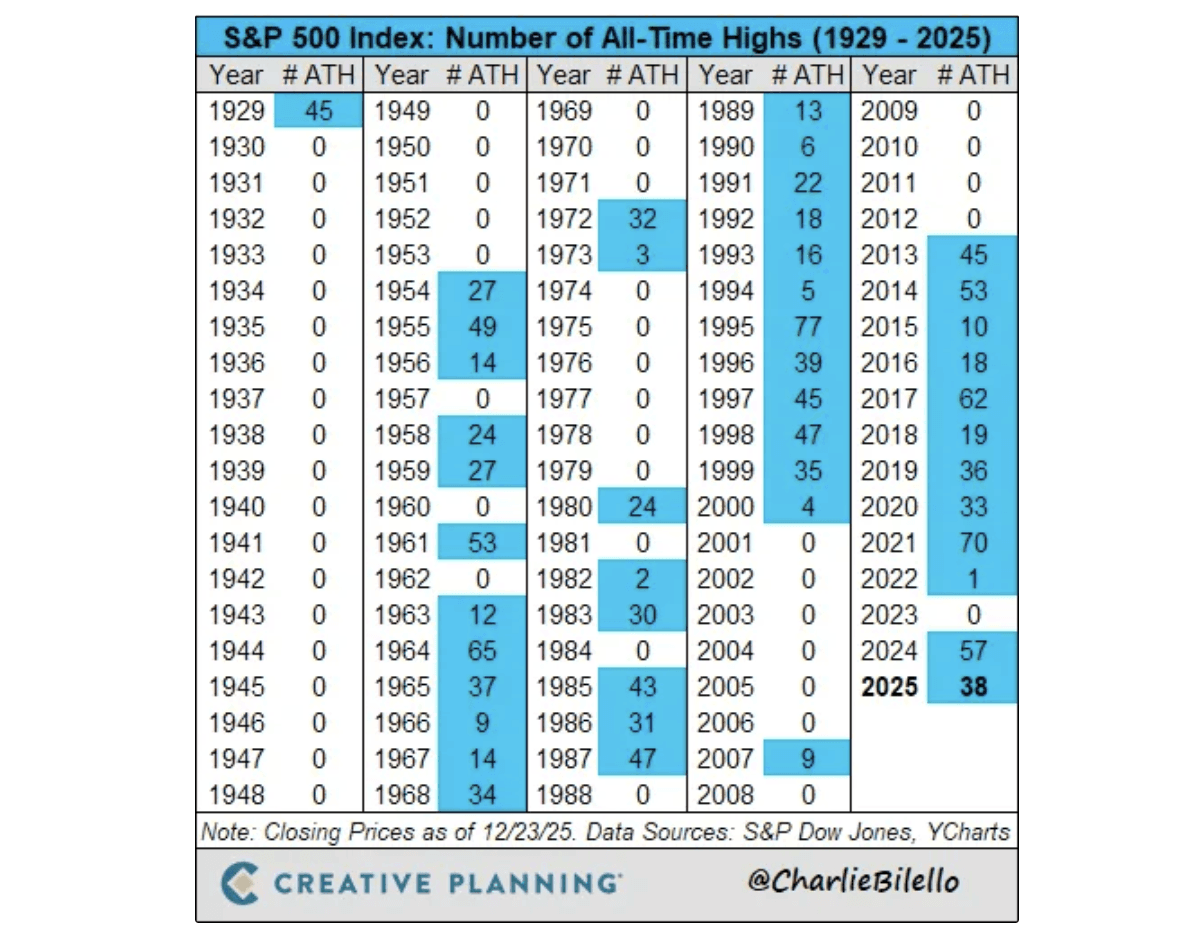
Although 17% is a really good performance for the index, it is actually below its average up year. Of course, over the long run, the average price change across all years is about +8%, but as usual, averages tend to be deceiving. The average during up years for the S&P is actually +21% versus -13% during down years.
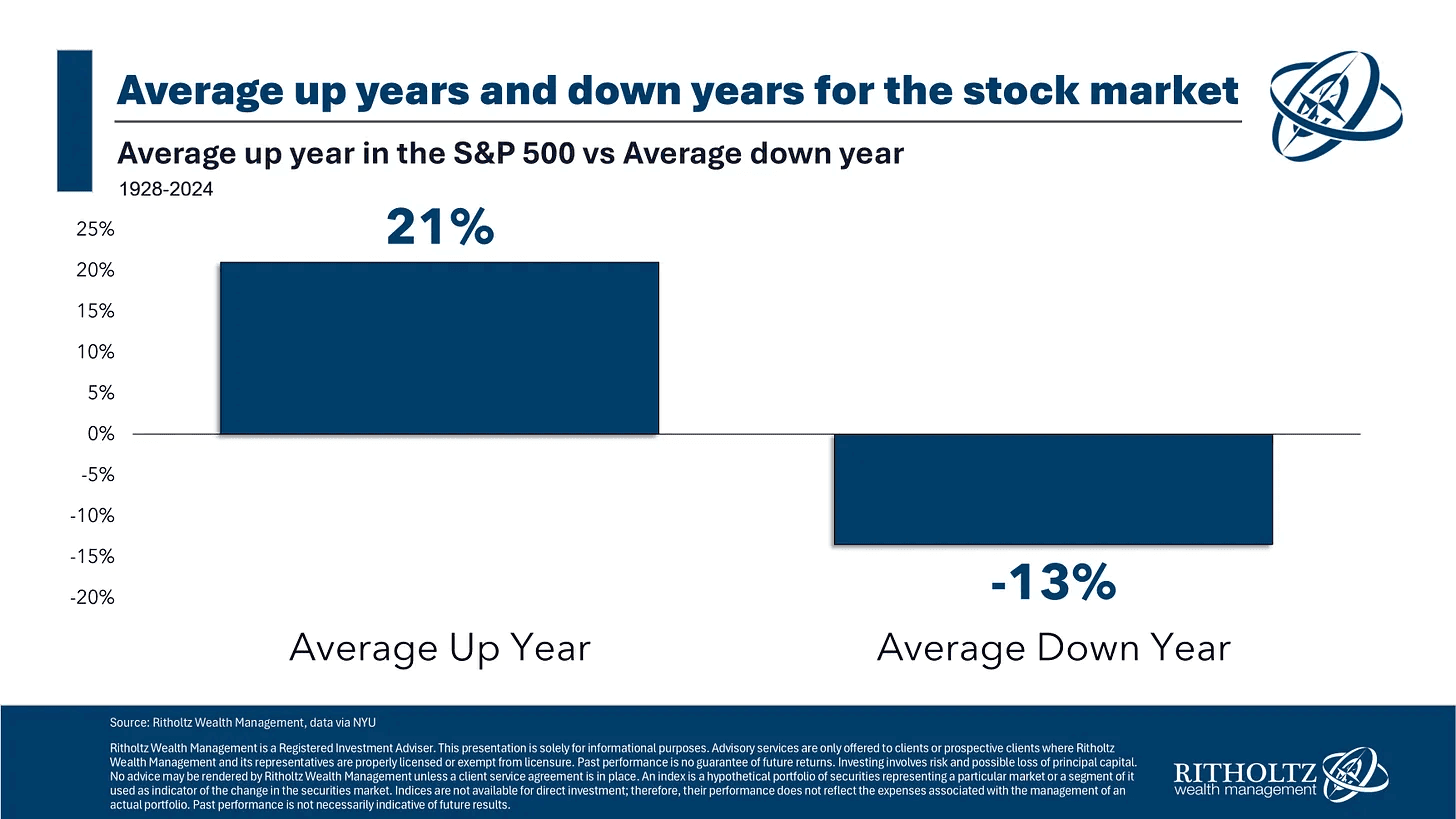
Even with all the hype around US stocks, this was one of the worst years for US markets relative to global markets since 2009.
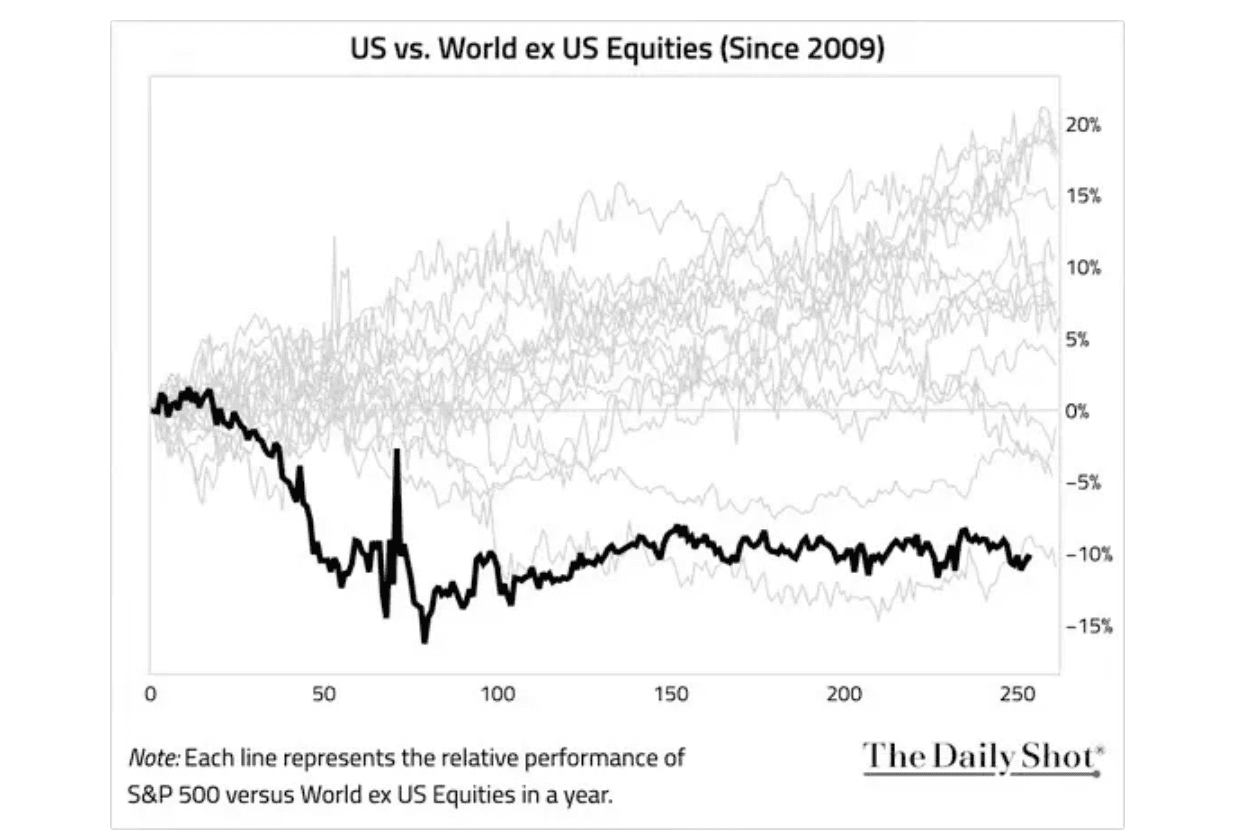
On an equal weighted basis, the US ended up in the bottom group. That means many other countries did much better while everyone was focused on the same big US names. The big question now is whether we’re seeing a reversion of this trend in 2026.
* Note this is the US equal weighted index.
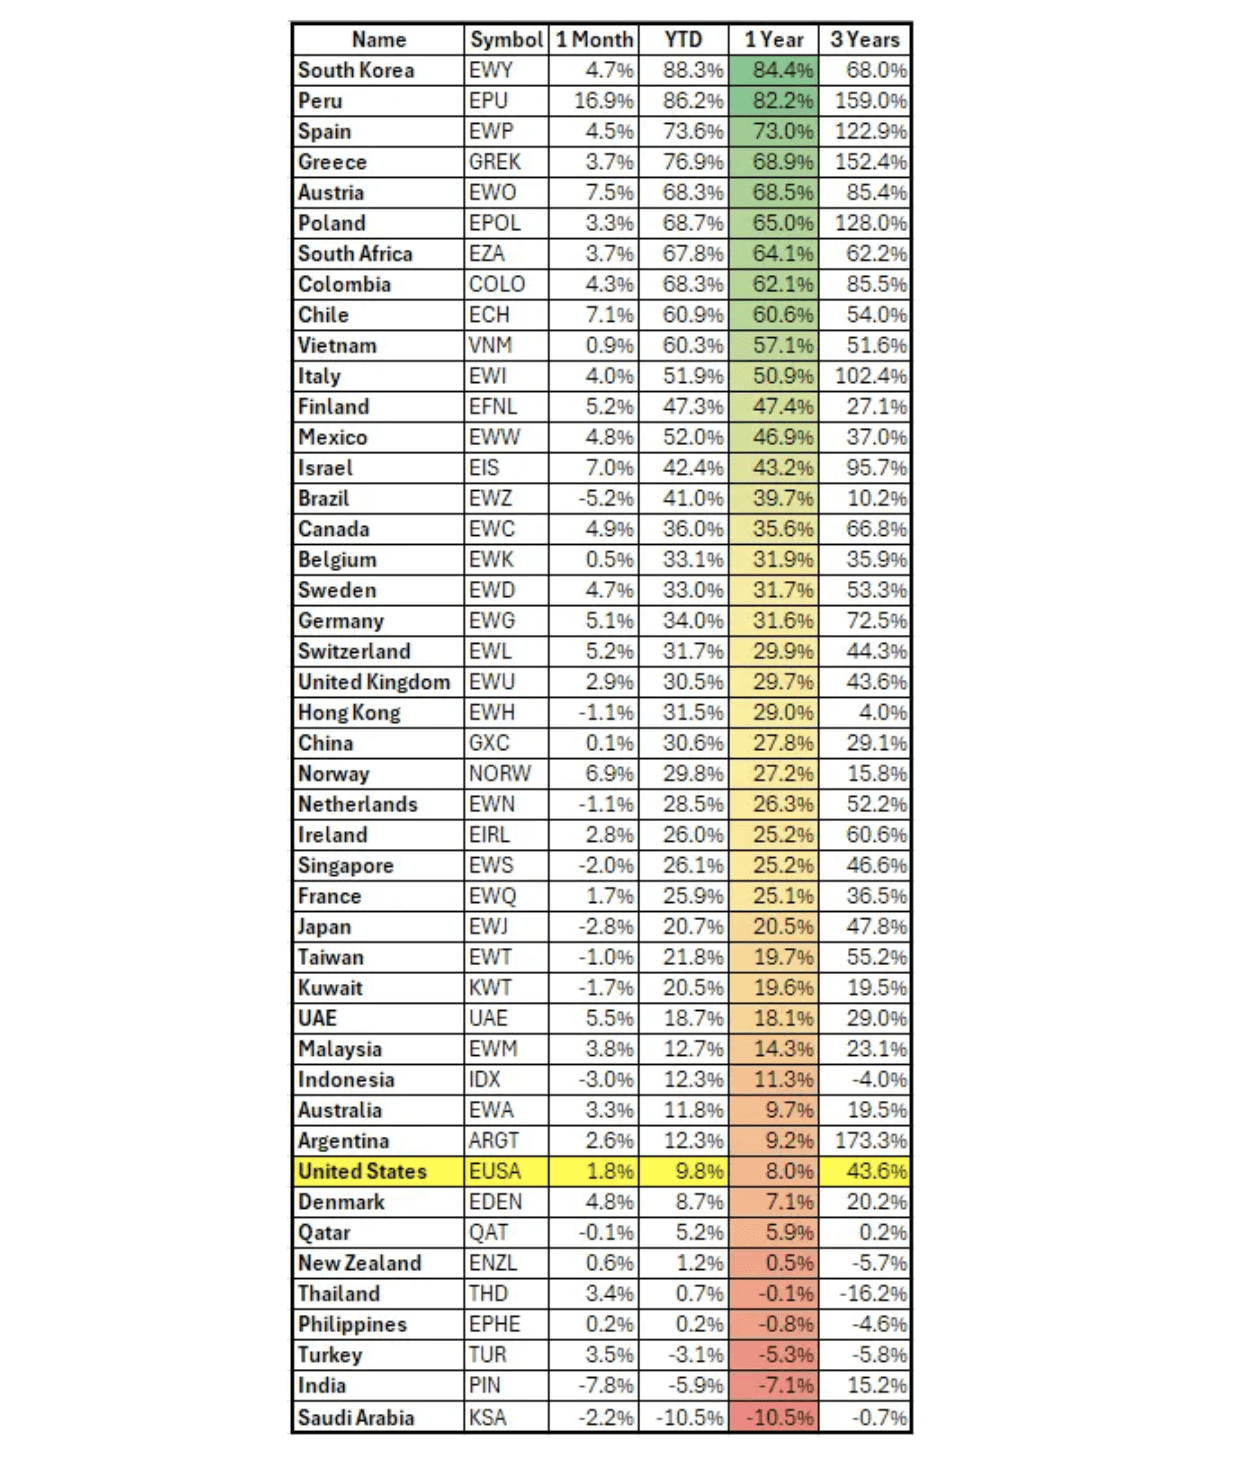
The biggest theme of the year was debasement.
People started worrying about money losing value. Governments are spending a lot. Debt keeps rising. Global tensions are high. So investors ran toward assets. Gold and silver exploded. Since late August, silver is up around 90%. Gold is up about 35%. That is truly historic.
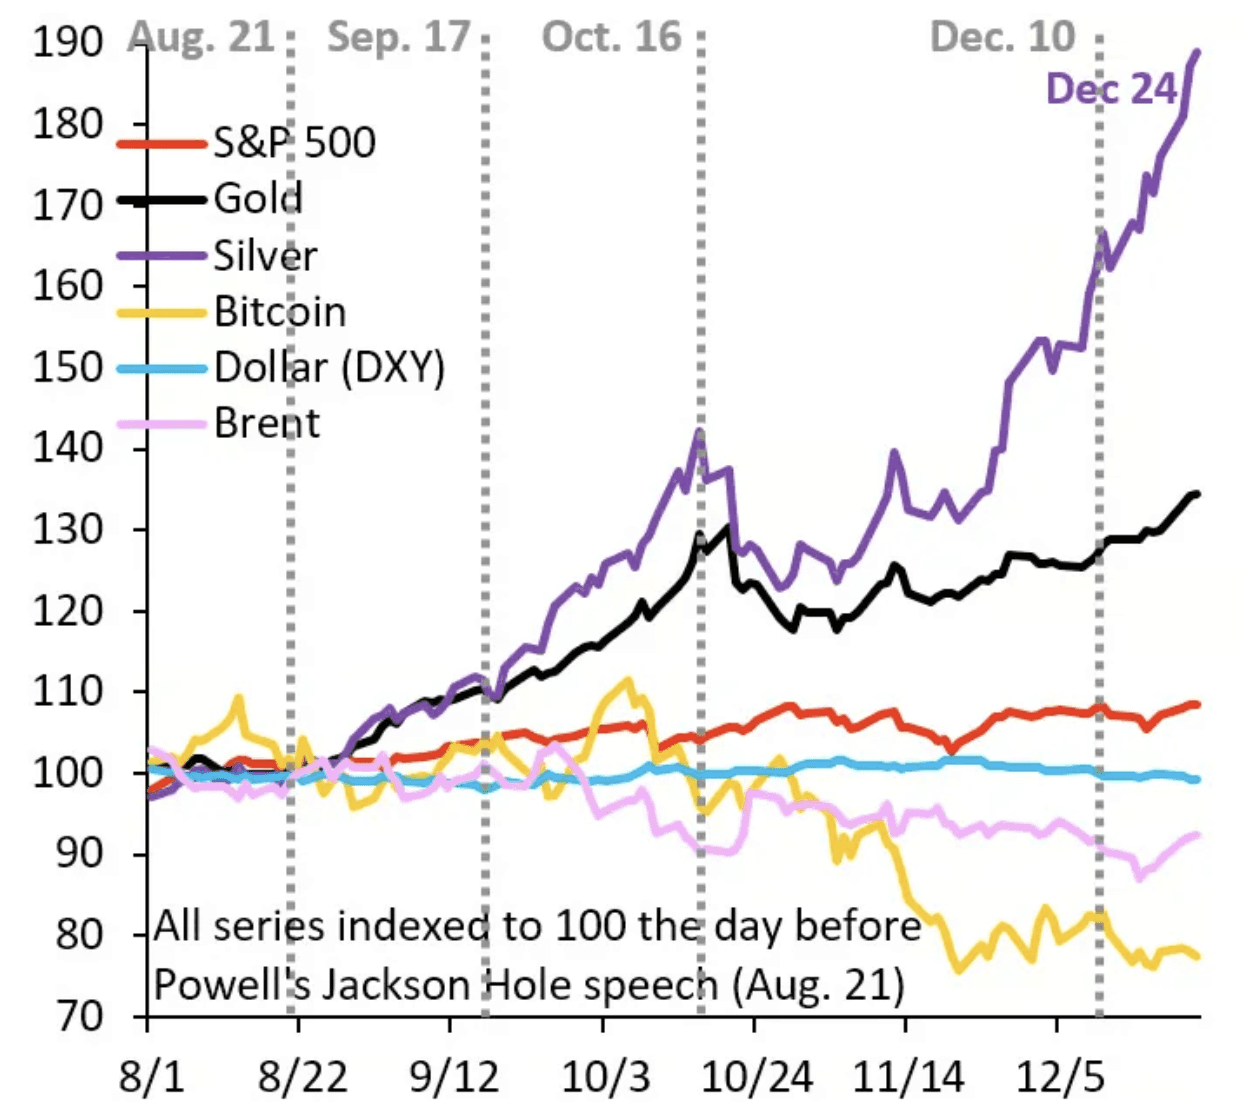
That is why gold is having its best year since 1979.
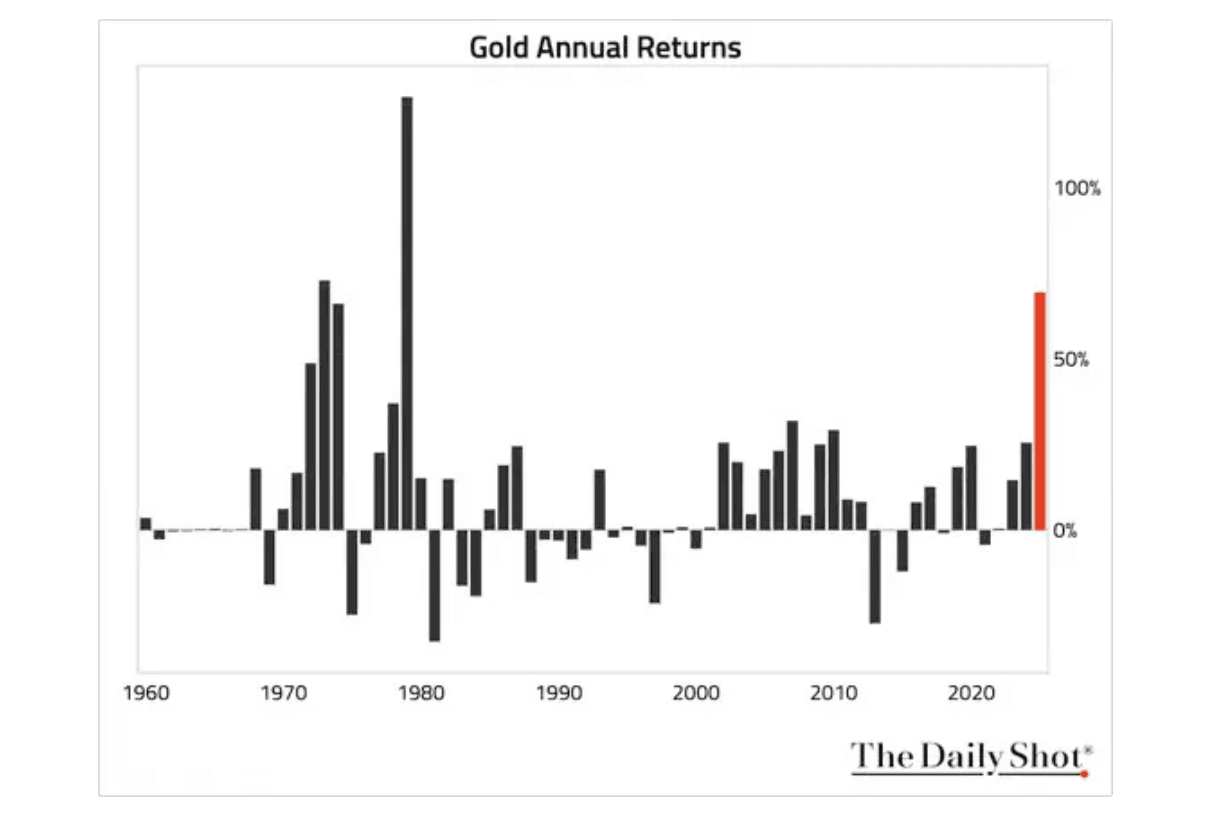
Gold went first. Then silver. Then palladium. Now copper and steel stocks are moving. Aluminum might be next. 2026 could be a supercycle in commodities.
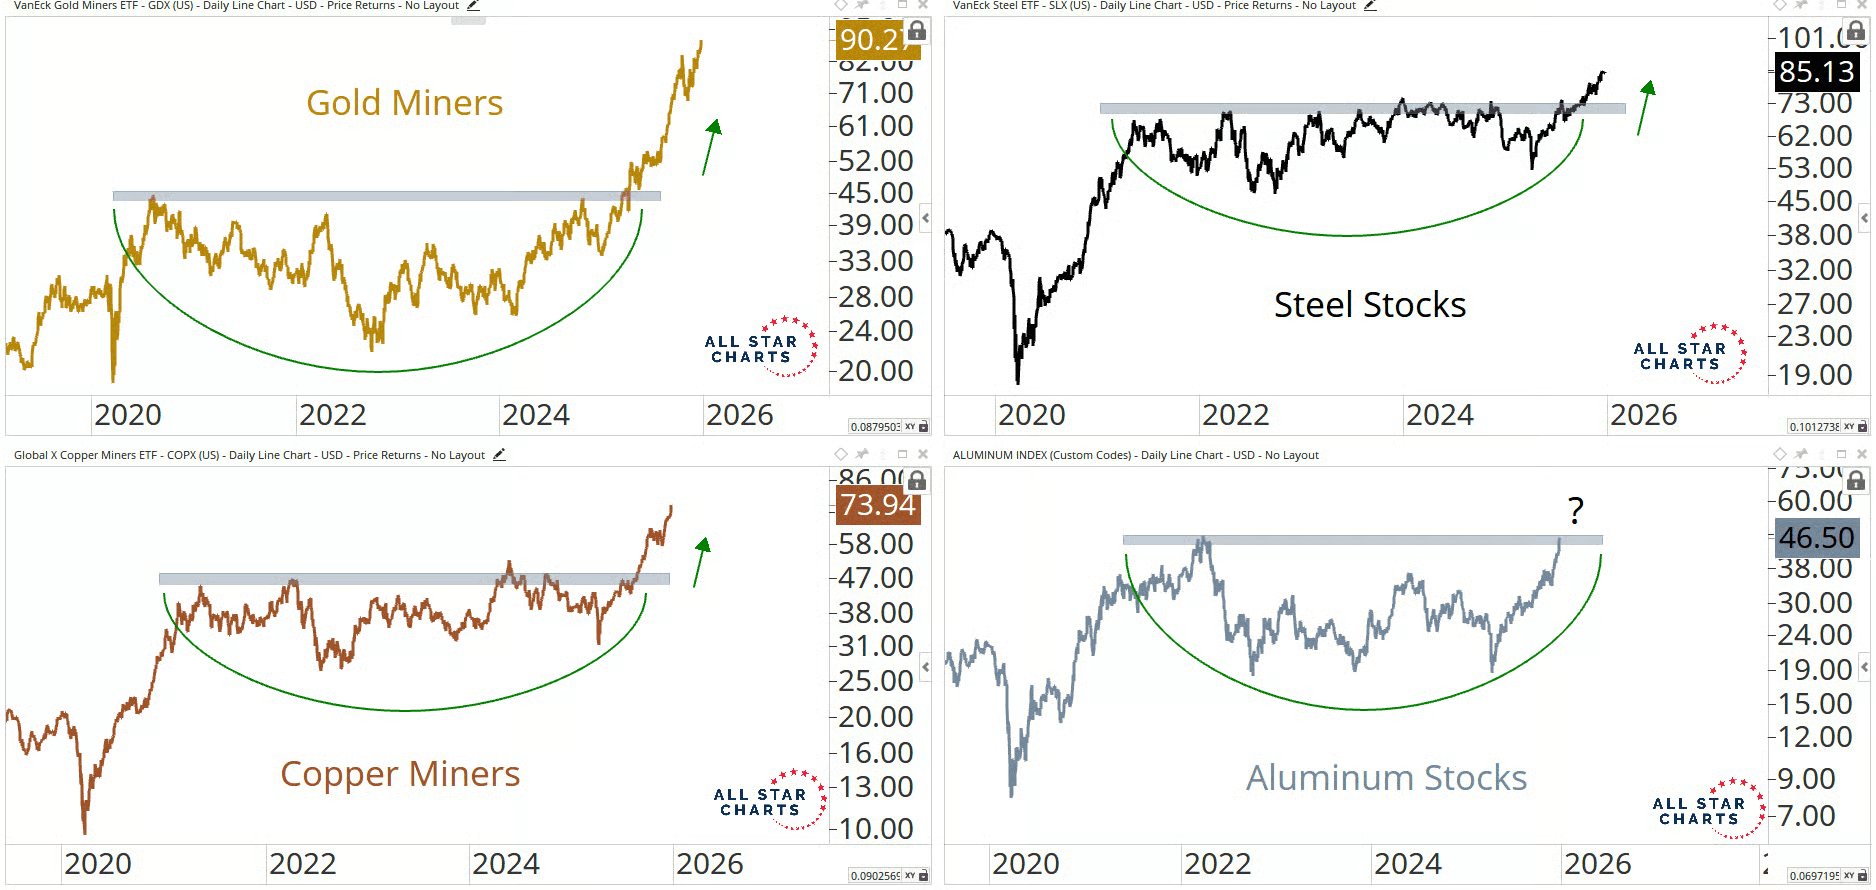
Only crypto has been standing out this year, though not in a positive way.
In fact, it is the only major asset class that is actually down so far.
Since November, net flows into both Bitcoin and Ethereum ETFs have turned negative and remained so. But they are starting to turn positive, which tends to happen very close to the actual bottoms.
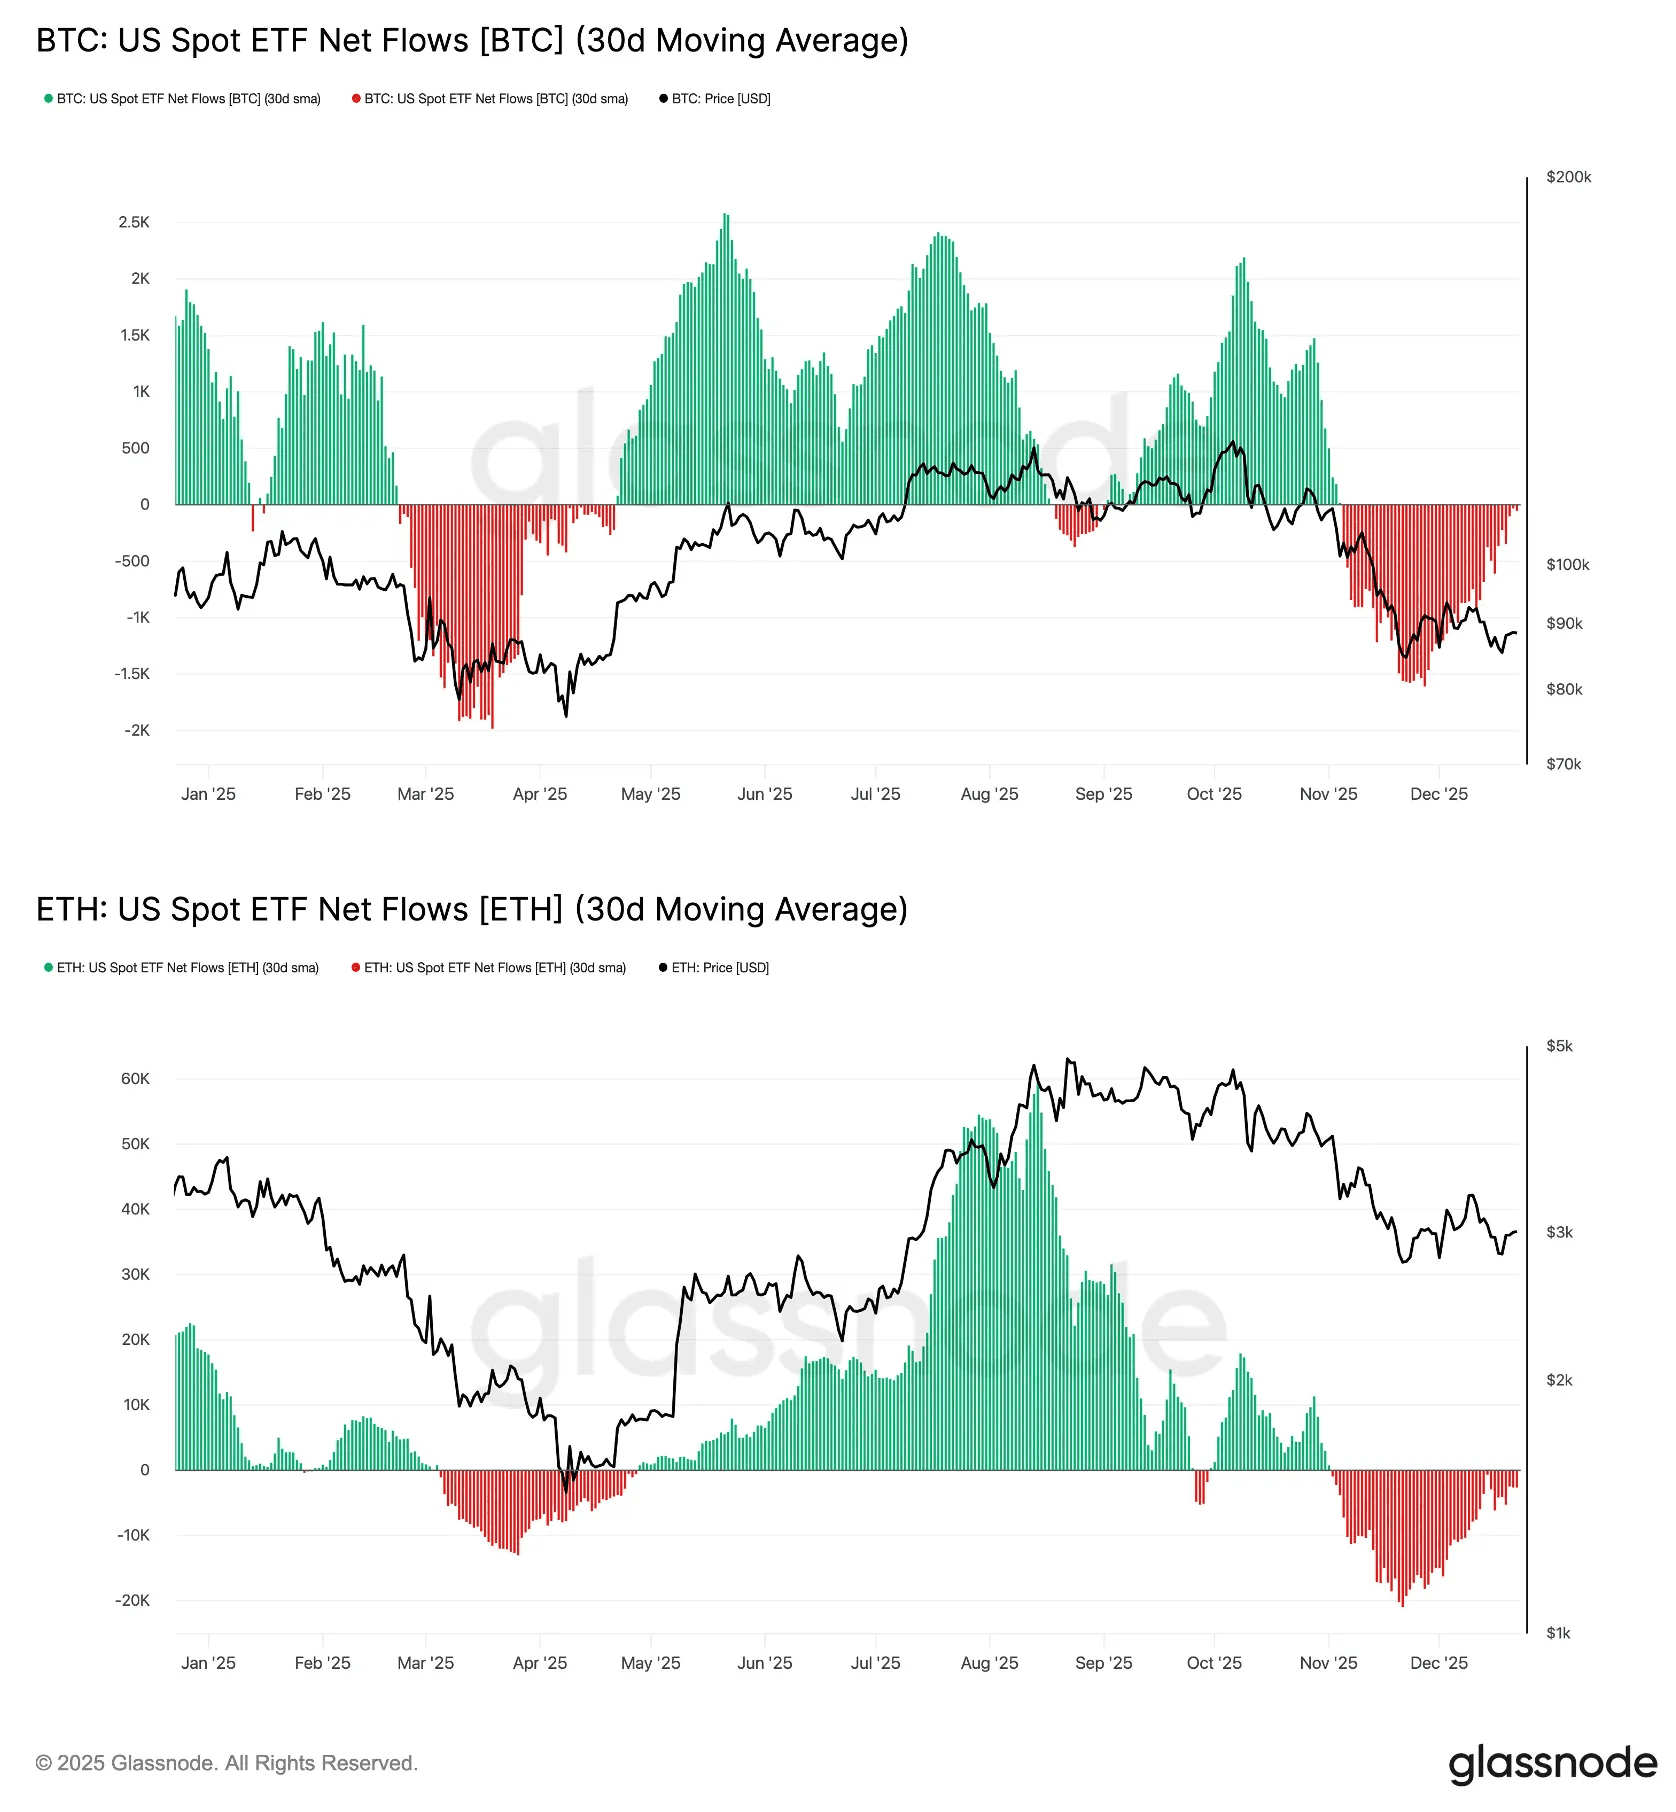
The biggest companies kept getting bigger.
Nvidia is now the largest and most important company in the world. It became the poster child of the entire AI boom. The big lesson here is that leaders can stay…
Lin
Sector to Watch: Solar Energy
I just published a new thematic portfolio: Solar Energy.
One of the reasons I enjoy doing these sector breakdown is because you’ll always discover new interesting companies.
All of this comes at a time when valuations across the solar industry have pulled back after 4 very challenging years. After a long reset, the sector’s fundamentals are starting to stabilize. Solar is now experiencing a renaissance. Global electricity demand is accelerating again, and a big part of that growth is coming from data centers needed to power AI.
So, here are 3 stocks that stood out.
1. Enlight Renewable Energy ($ENLT)
Enlight builds and operates large clean power projects. Its main focus is utility scale solar and wind farms that feed electricity directly into the grid. These are not rooftop panels, but very large projects designed to supply cities, industries, and data centers.
Enlight works across the full life cycle of a project. It finds suitable land, secures permits, arranges financing, builds the power plants, and then operates them for many years. By owning and running the assets long term, the company earns steady revenue from selling electricity under long term contracts. The company operates internationally. While it started in Israel, it now has projects in Europe and the United States.
Solar and wind are the core of the business, but storage is becoming more important. Enlight also develops large battery systems that store energy from solar and wind and release it later when demand is higher. This makes Enlight a full stack renewable energy company.
It has not only been growing incredibly fast, but it has also been profitable for years.
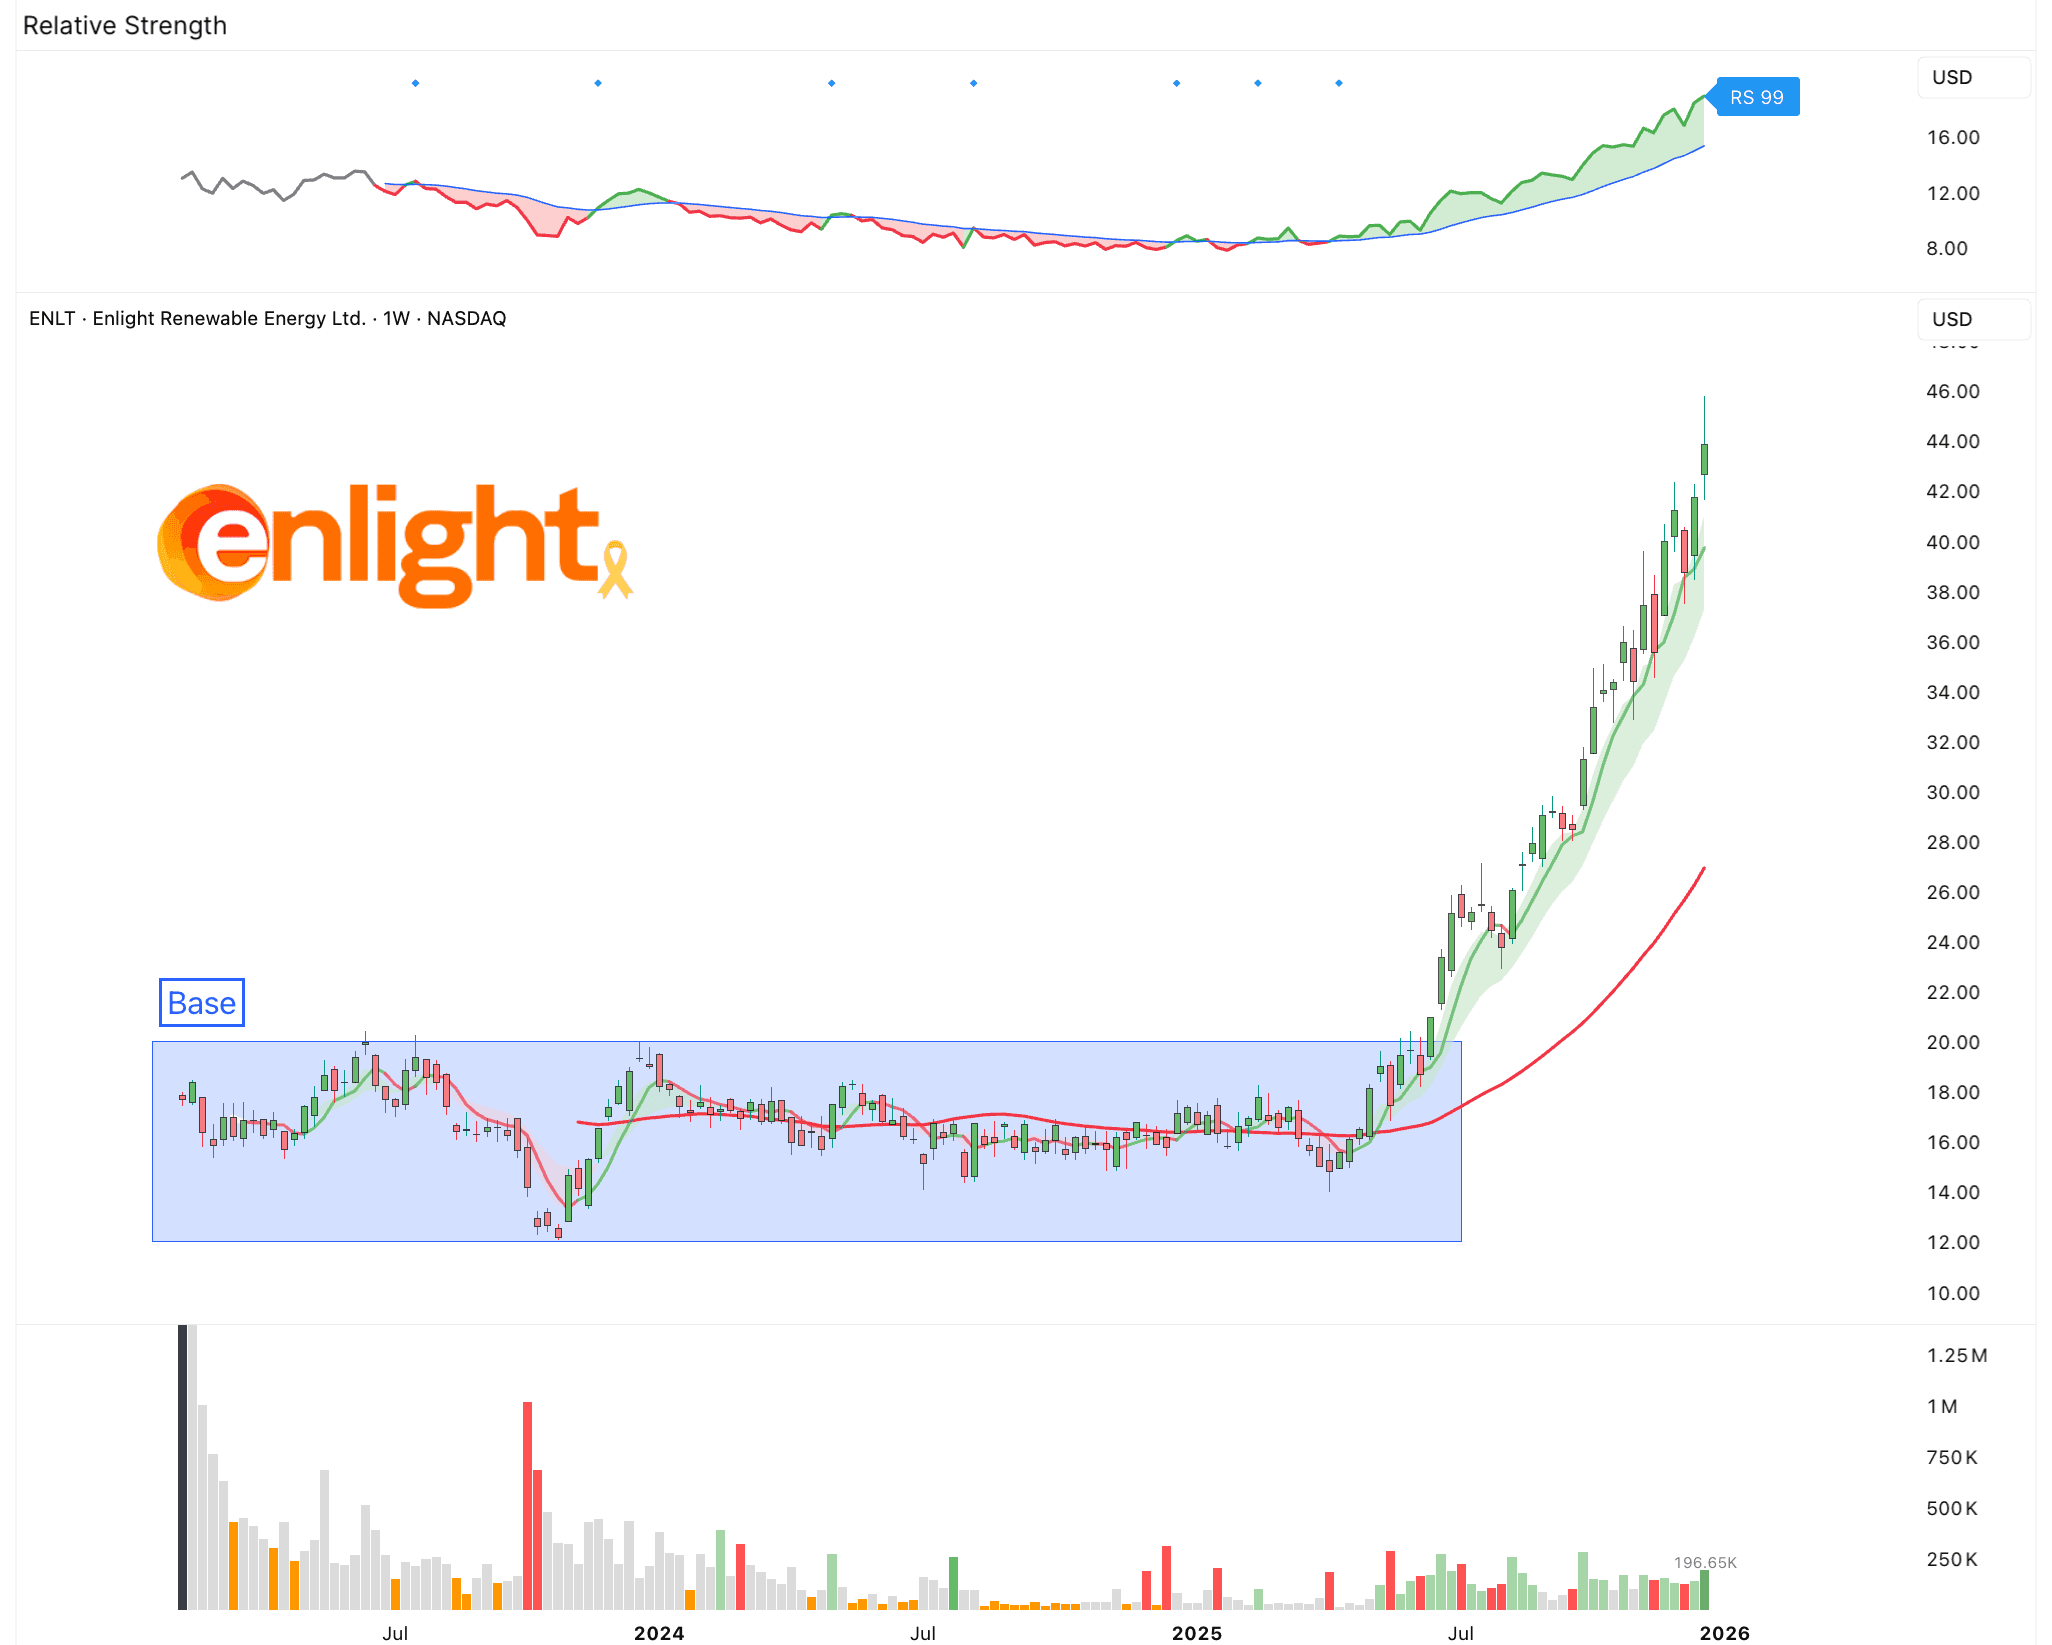
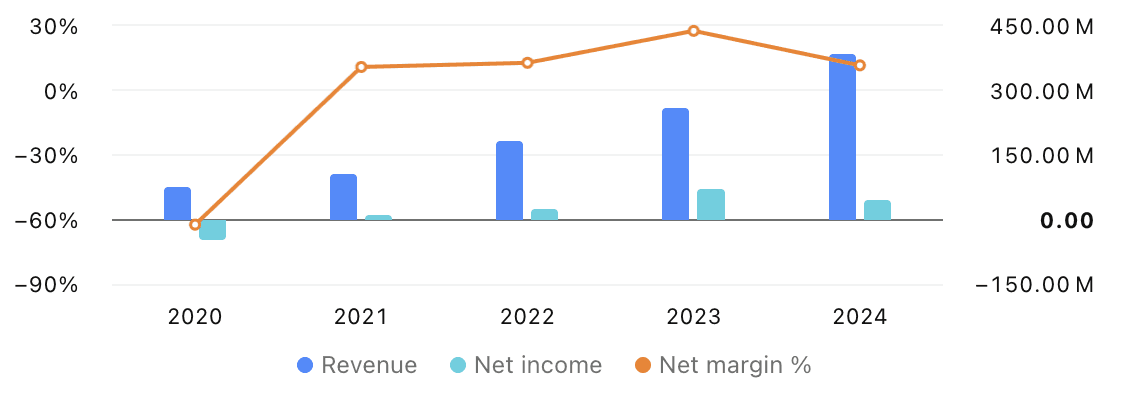
2. Spruce Power ($SPRU)
Spruce Power is a residential solar company focused on owning and operating home solar systems in the United States. Unlike many solar installers, Spruce usually does not sell systems to homeowners. Instead, it owns the panels and sells the electricity or leases the system to the homeowner. It also uses battery storage and system upgrades where it makes sense.
Spruce Power grows mainly by buying existing residential solar portfolios. These are thousands of already installed home solar systems that come with long term customer contracts. By acquiring these portfolios, Spruce gets immediate cash flow instead of waiting years for new installs to pay back.
The company’s business is built around long term recurring revenue. Homeowners sign contracts that often last 20 to 25 years. Spruce collects monthly payments while handling system monitoring, maintenance, and customer service. This makes the business more stable and predictable than pure installation companies.
Interestingly, since its IPO in 2020, Spruce lost about 99% of its value. Then, starting in August, the stock jumped more than 300%. I am not fully sure what caused that move yet. I need to dig into that. This makes the stock clearly speculative.
What makes it interesting though is its the size. Even after the big run up, the company is still valued at under $100M. That is tiny for an energy company with thousands of operating solar assets. Even more surprising, it is likely generating more than that in revenue this year and is close to being profitable. That gap between revenue and market cap is unusual and worth a closer look.
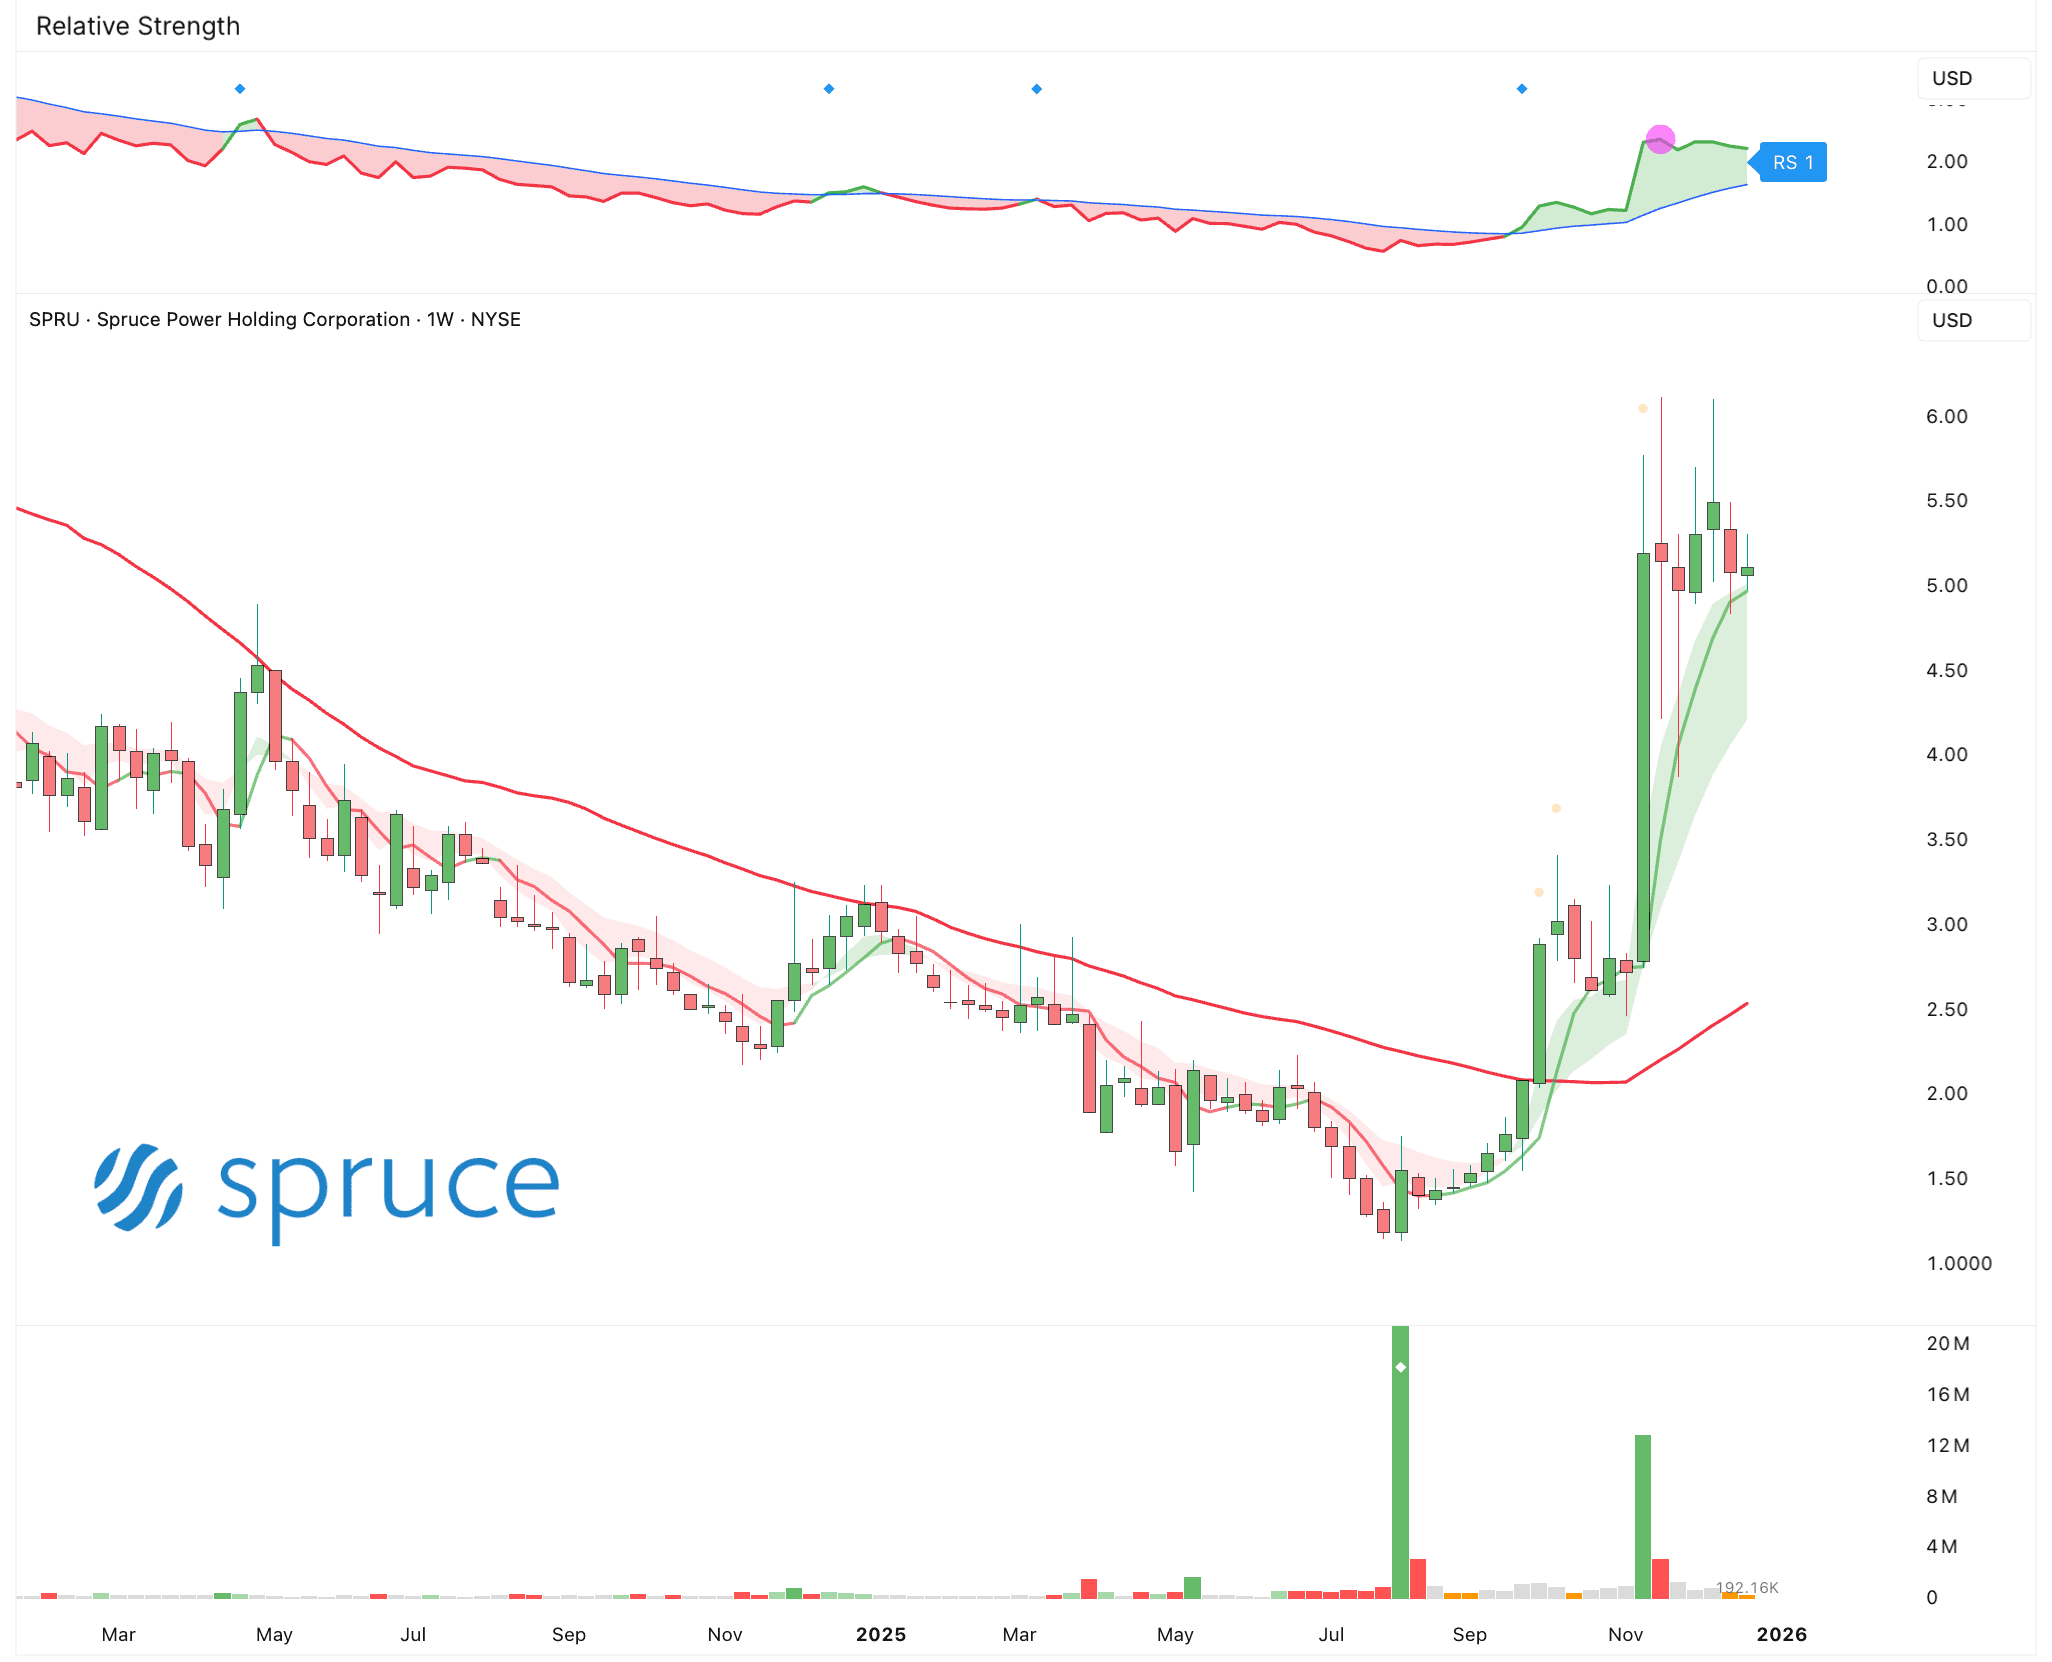
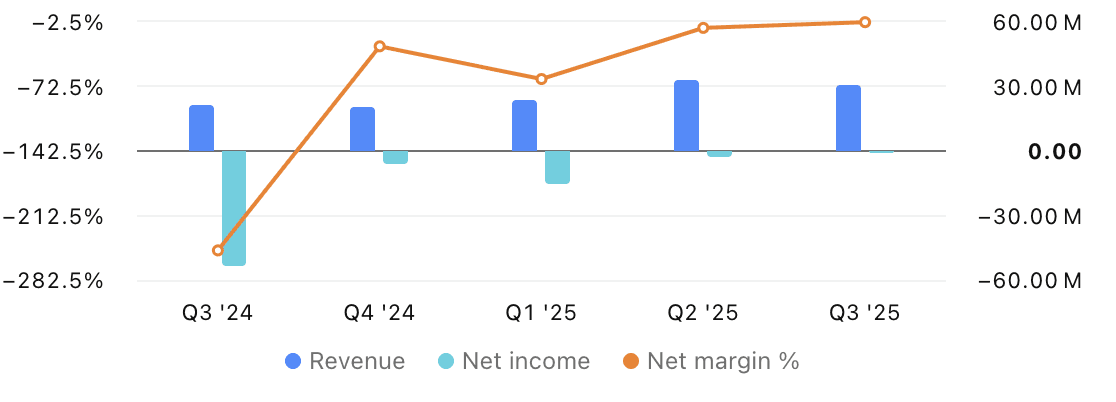
3. Nextpower ($NXT)
I highlighted Nextpower a few weeks ago, but since it fits this theme so well, it does not hurt to mention it again.
Traditional solar panels are fixed, which limits the amount of sunlight they can capture.
That’s where Nextpower comes in.
They build solar tracking systems with intelligent motors and software that make panels follow the sun throughout the day. Each tracker uses sensors, algorithms, and cloud software to adjust in real time for wind, terrain, and sunlight.
The result is up to 25% more energy output from the same panels.
Until now they’ve deployed systems on more than 90 gigawatts of solar projects across over 30 countries. And Nextpower works with many of the world’s largest renewable energy developers and utilities
They are profitable, growing steadily 20% year after year, and trade at a PE of 24.
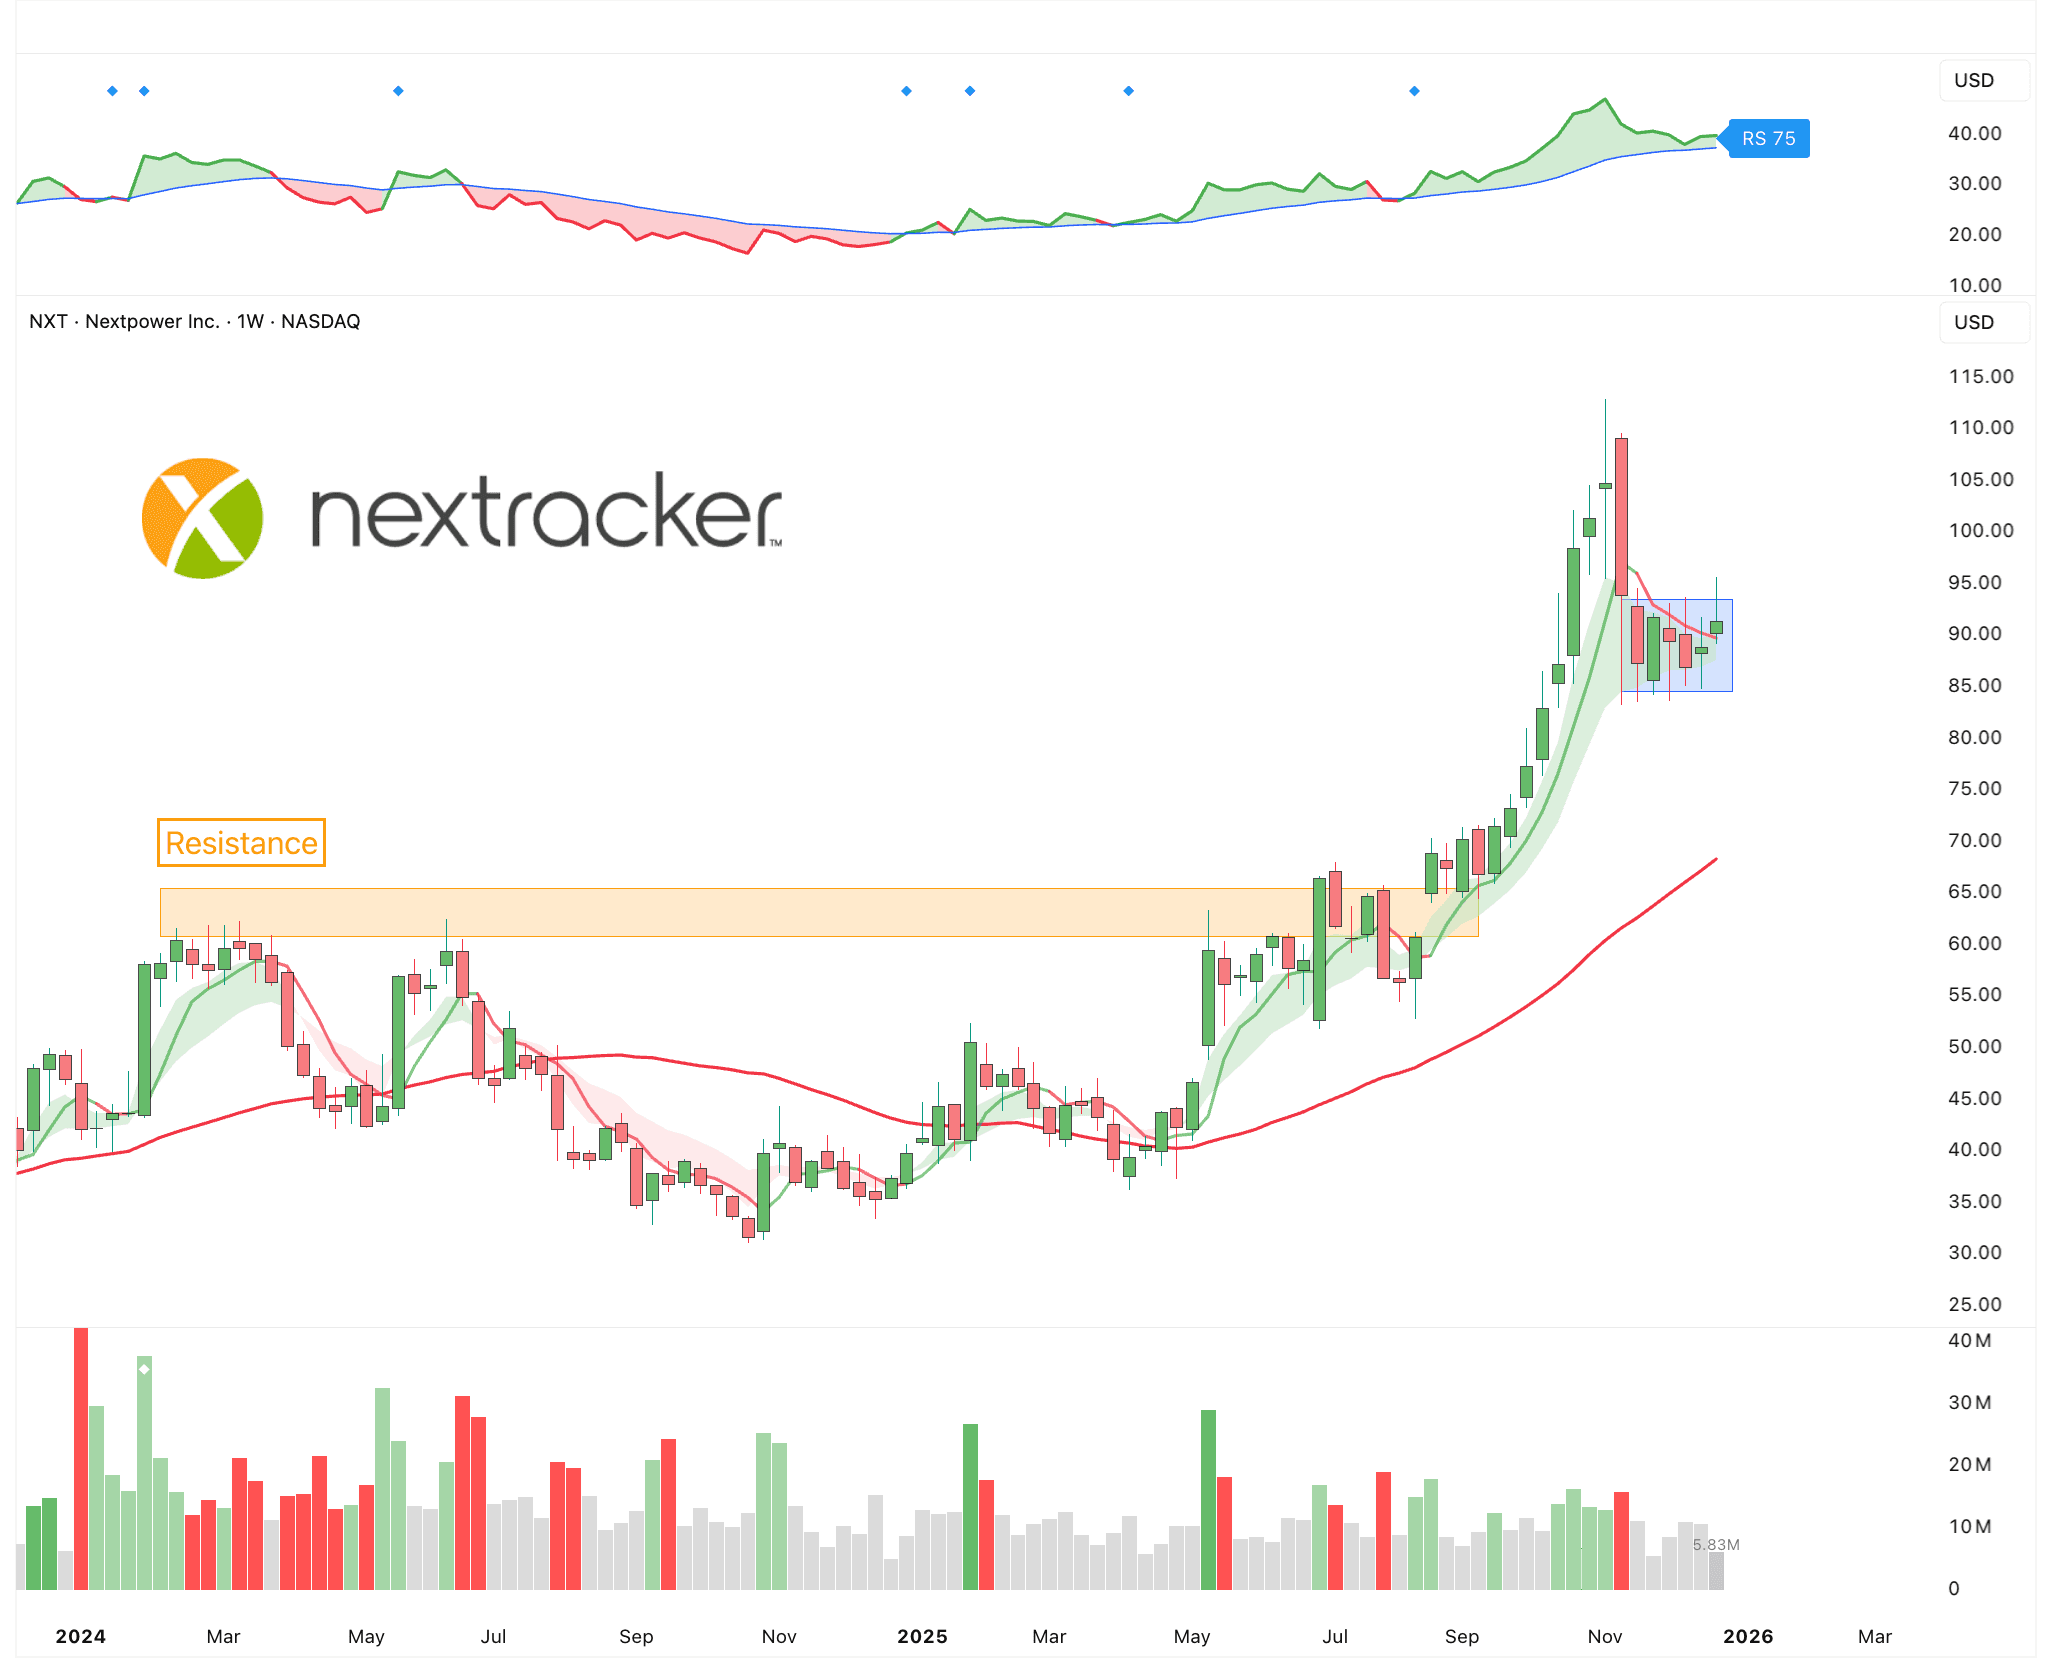
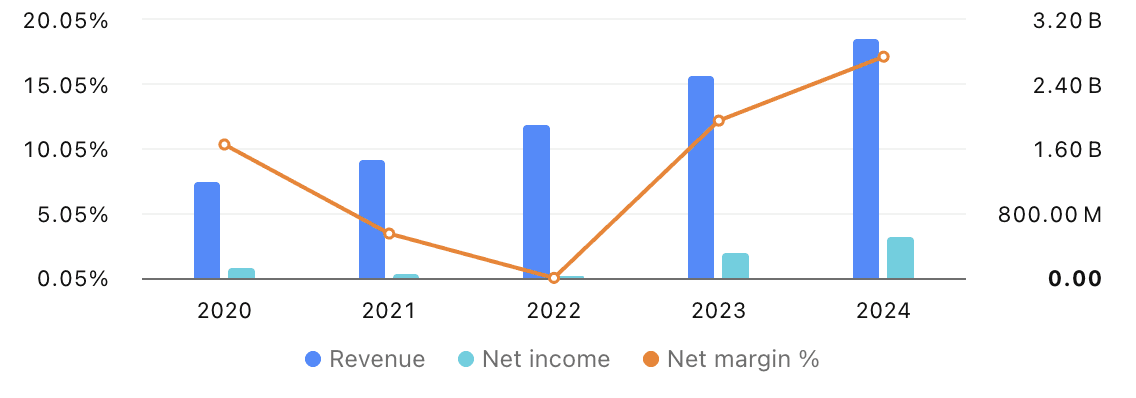
Lin
Weekly Market Update: Is Santa Coming?
This week was a whirlwind. I feel like I’m saying this every week now.
But that’s because we’re going through a period of elevated volatility.
The unwind in AI infrastructure names seemed like it was never going to end, and that peaked on Wednesday when news came out that Blue Owl was backing out of its funding to support Oracle’s new 1GW data center in Michigan. This was a big red flag because Blue Owl had been acting as a major lifeline to these AI-centric companies building data centers. When a big lender like that steps away, people start to wonder if these projects are riskier than they thought.
That fear led to more selling.
However, all of that selling came to a screeching halt on Thursday and Friday as many of the high-momentum stocks were bid relentlessly higher.
Why did this happen? There are a few reasons.
News came out that OpenAI is considering raising $100B at a monstrous $830B valuation. This would mean OpenAI will be able to fulfill its obligations to companies like Oracle and CoreWeave. This has been the biggest fear in the AI complex.
On top of that, the recent earnings report from Micron was incredible. This was arguably the biggest and most telling semiconductor quarter we’ve seen since this AI bull market began. They absolutely smashed expectations and guided much higher than what the Street was expecting.
Another signal that the AI boom is still far from over.
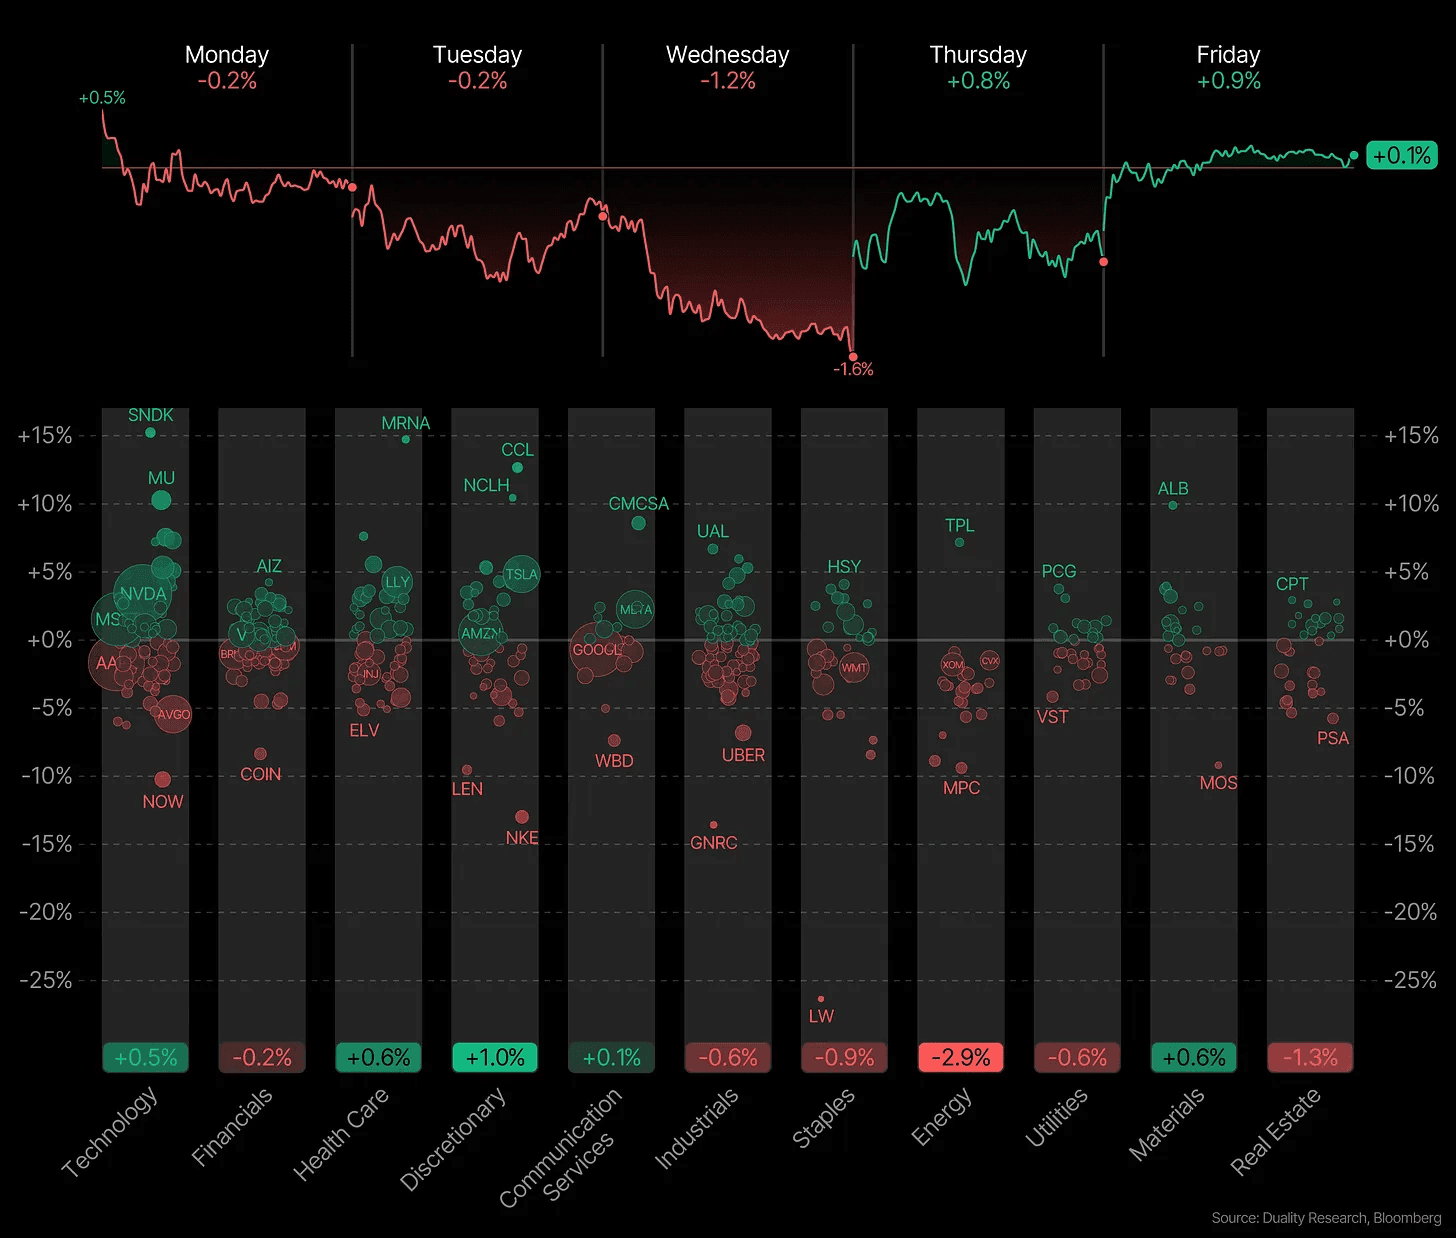
In fact, US tech companies are making massive bets on AI.
They are committing to spend a combined $569 billion on data center leases over the next several years.
This is a $197 billion increase, or a 53% jump, from Q2 2025.
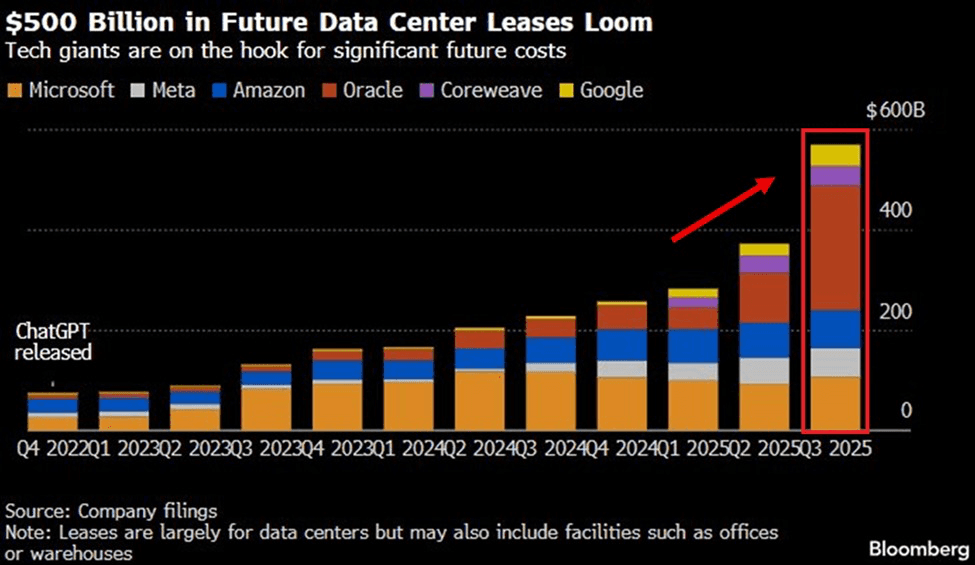
The reason for this continued volatility is simple:
First, it’s leverage.
Right now, there is about a 12.5 to 1 ratio of leveraged long ETFs versus inverse ETFs. This is the highest in over a year. That simply means far more investors are betting aggressively on prices going up than protecting against a drop.
But When the market falls just a little, these big risky bets lose fast. People panic and sell. That selling pushes prices down even more.
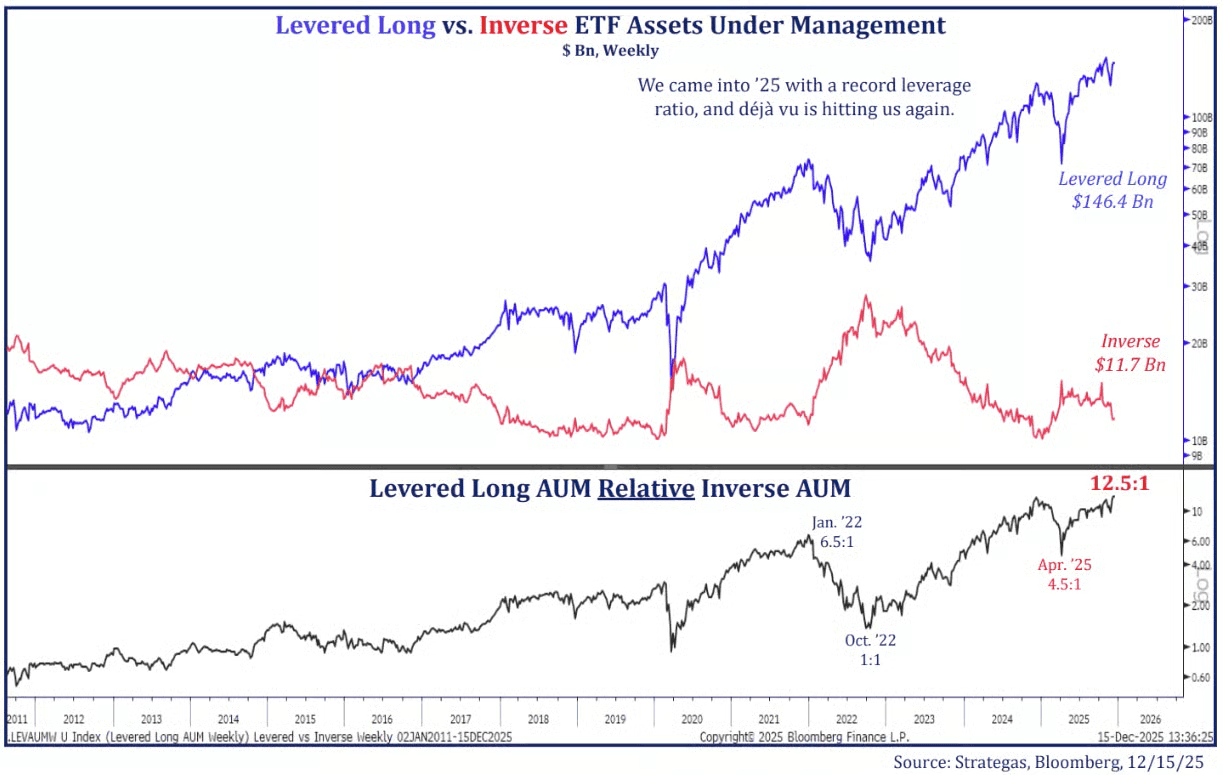
Second, margin debt is rising fast. And this matters more than most people think.
Margin debt means investors are borrowing money to buy stocks. It is leverage. You put down some of your own cash and borrow the rest, hoping prices keep going up.
Right now, margin debt compared to the total money in the system is climbing quickly. That tells us something important. Investors are optimistic. They believe stocks will be higher in the future, so they are willing to take on more risk.
The problem is that leverage only works well in low volatile markets. But when markets get choppy, leverage turns against you very fast. So leverage makes the whole system more fragile. It works great on the way up, but it increases the odds of sharp and sudden corrections.
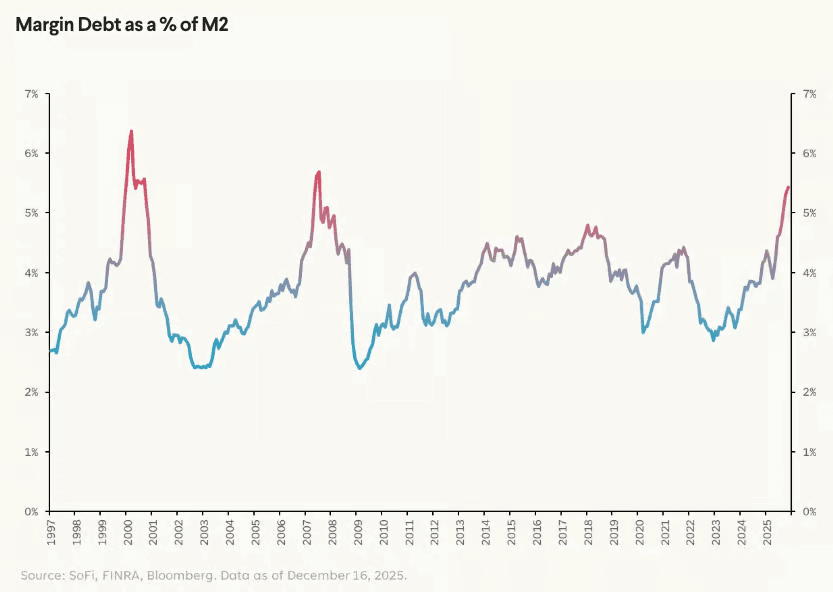
Third, Bitcoin is acting like a risky tech stock, not like a digital store of value.
Over the last 3 months, Bitcoin has been moving almost the same way as momentum names. Which is to say down.
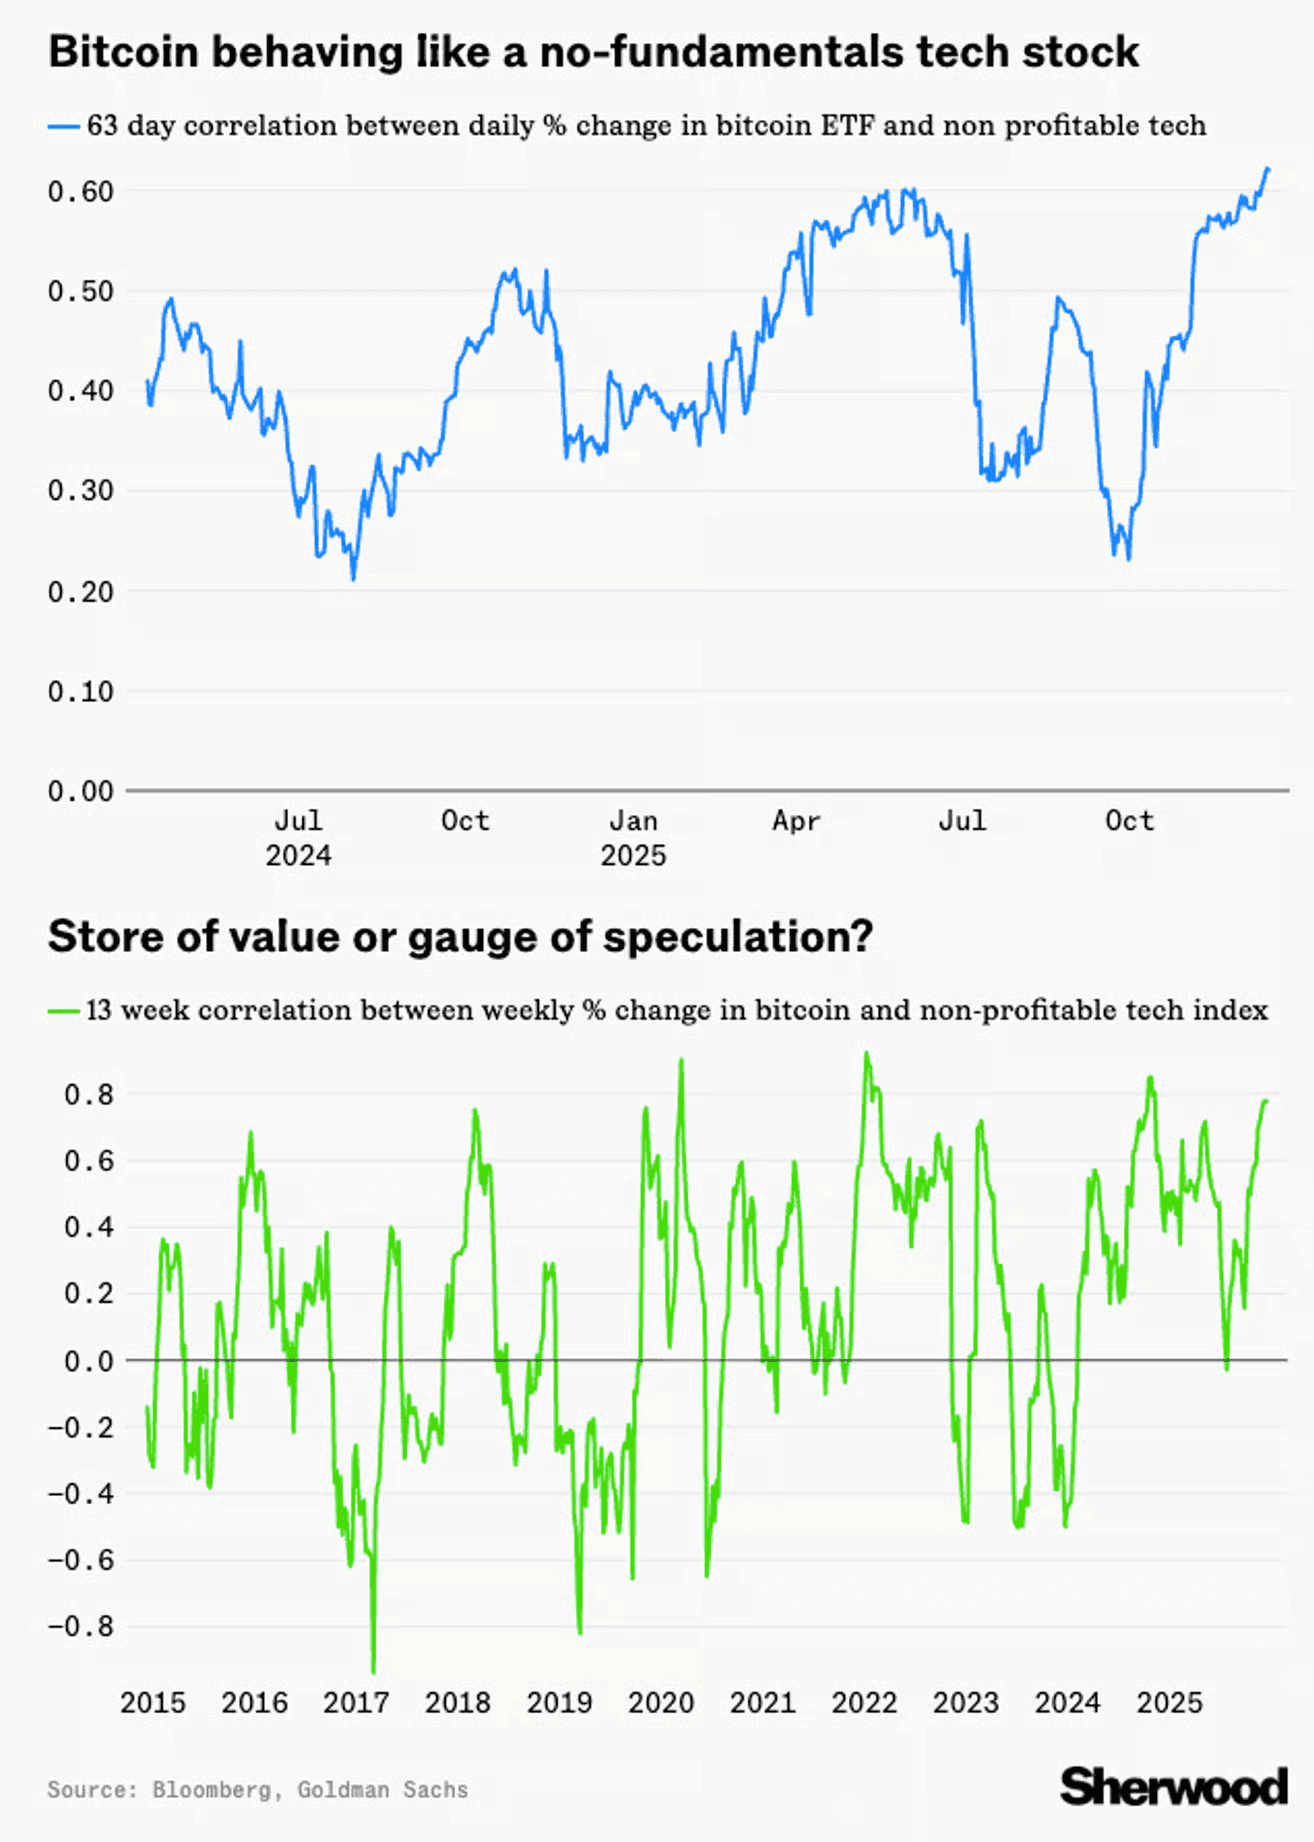
This lead to a lot of selling of long term Bitcoin holders.
Long term holders are people who bought Bitcoin and did not touch it for years. They usually believe the most in Bitcoin and sell last.
Since early 2023, about 1.6 million Bitcoin that had not moved for at least 2 years has been sold. That is around $140 billion worth. That is a huge amount.
Even more important, the last 30 days were one of the biggest selling periods by long term holders in more than 5 years.
The market loves to shakeout the few remaining holders. The bottom could be close.
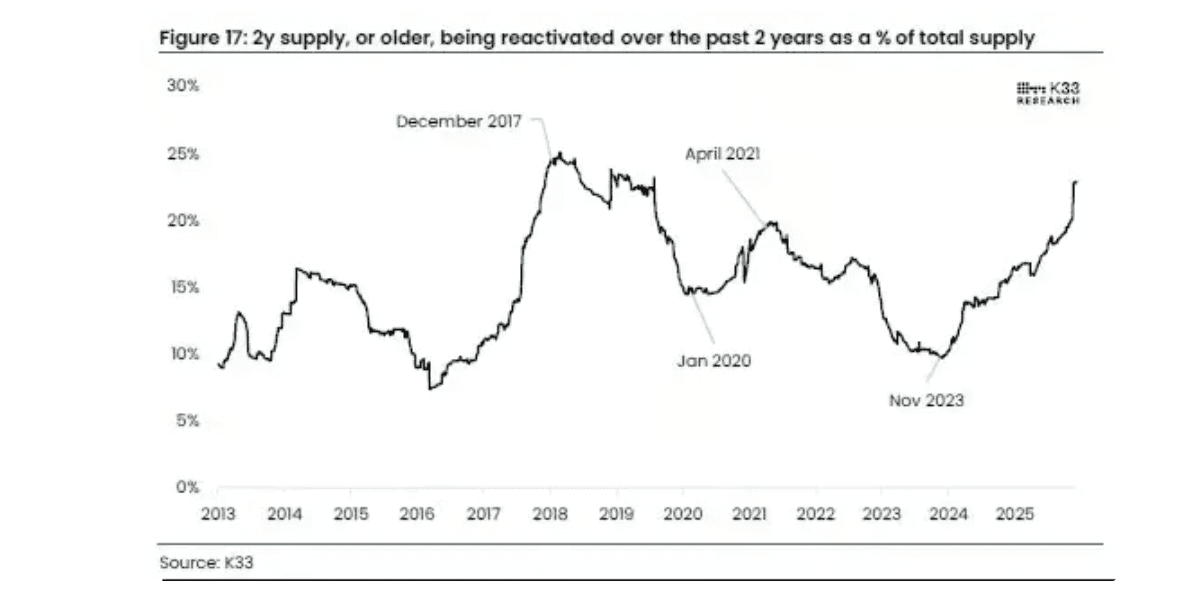
Bitcoin is very oversold.
When the RSI falls below 30, Bitcoin is considered very oversold. And this chart looks at what Bitcoin usually does after that happens.
Historically, after Bitcoin gets this oversold, prices tend to bounce. Not always right away, but often soon after. Selling pressure starts to fade because most people who wanted to sell or were forced to sell already did.
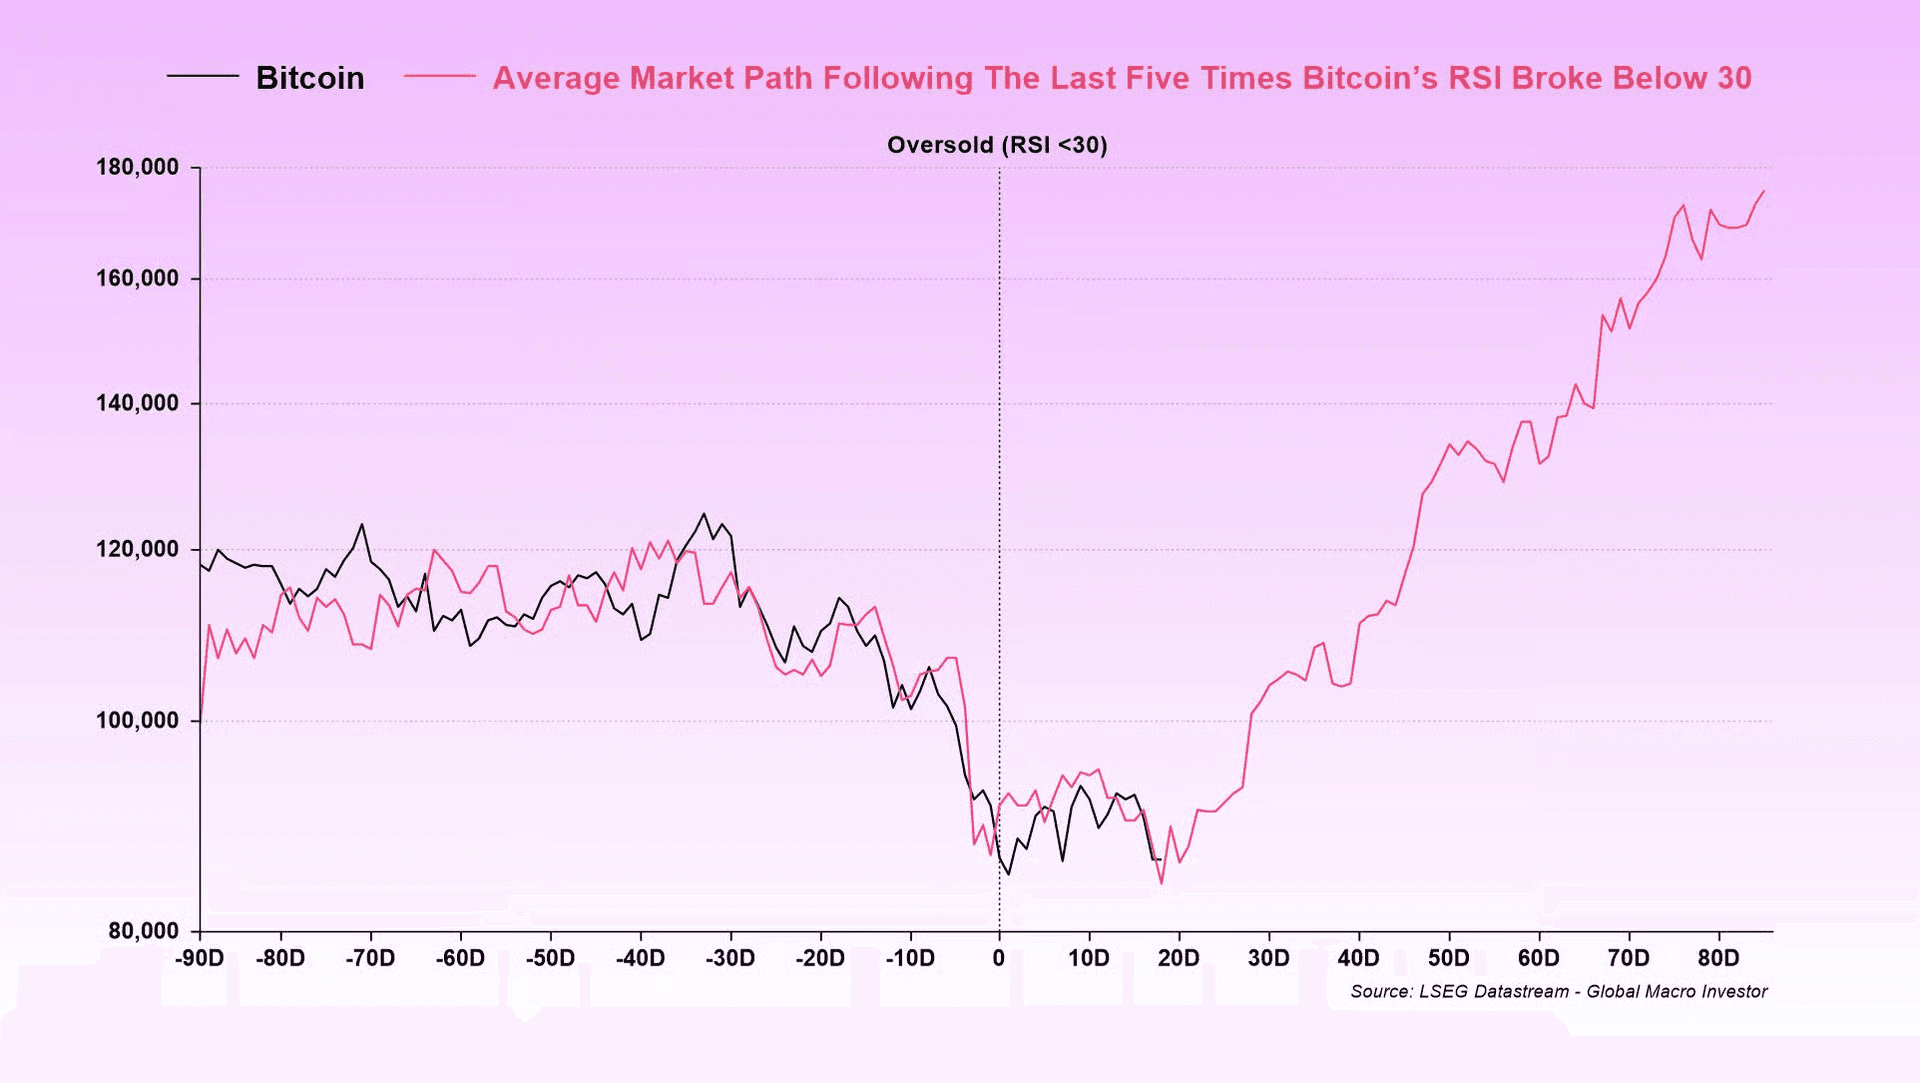
Fourth, the stock market positioning is extremely stretched right now.
Retail investors have about 70% of their money in stocks, near the highest level in 20+ years and similar to the 2021 meme stock period. Professional investment managers are also almost fully invested, with stock exposure close to 100%, which means most investors are positioned the same way.
And when everyone thinks the same, markets get fragile.
Because when something unexpected happens, there are no buyers left. Everyone tries to react at the same time. Even small changes can lead to huge moves.
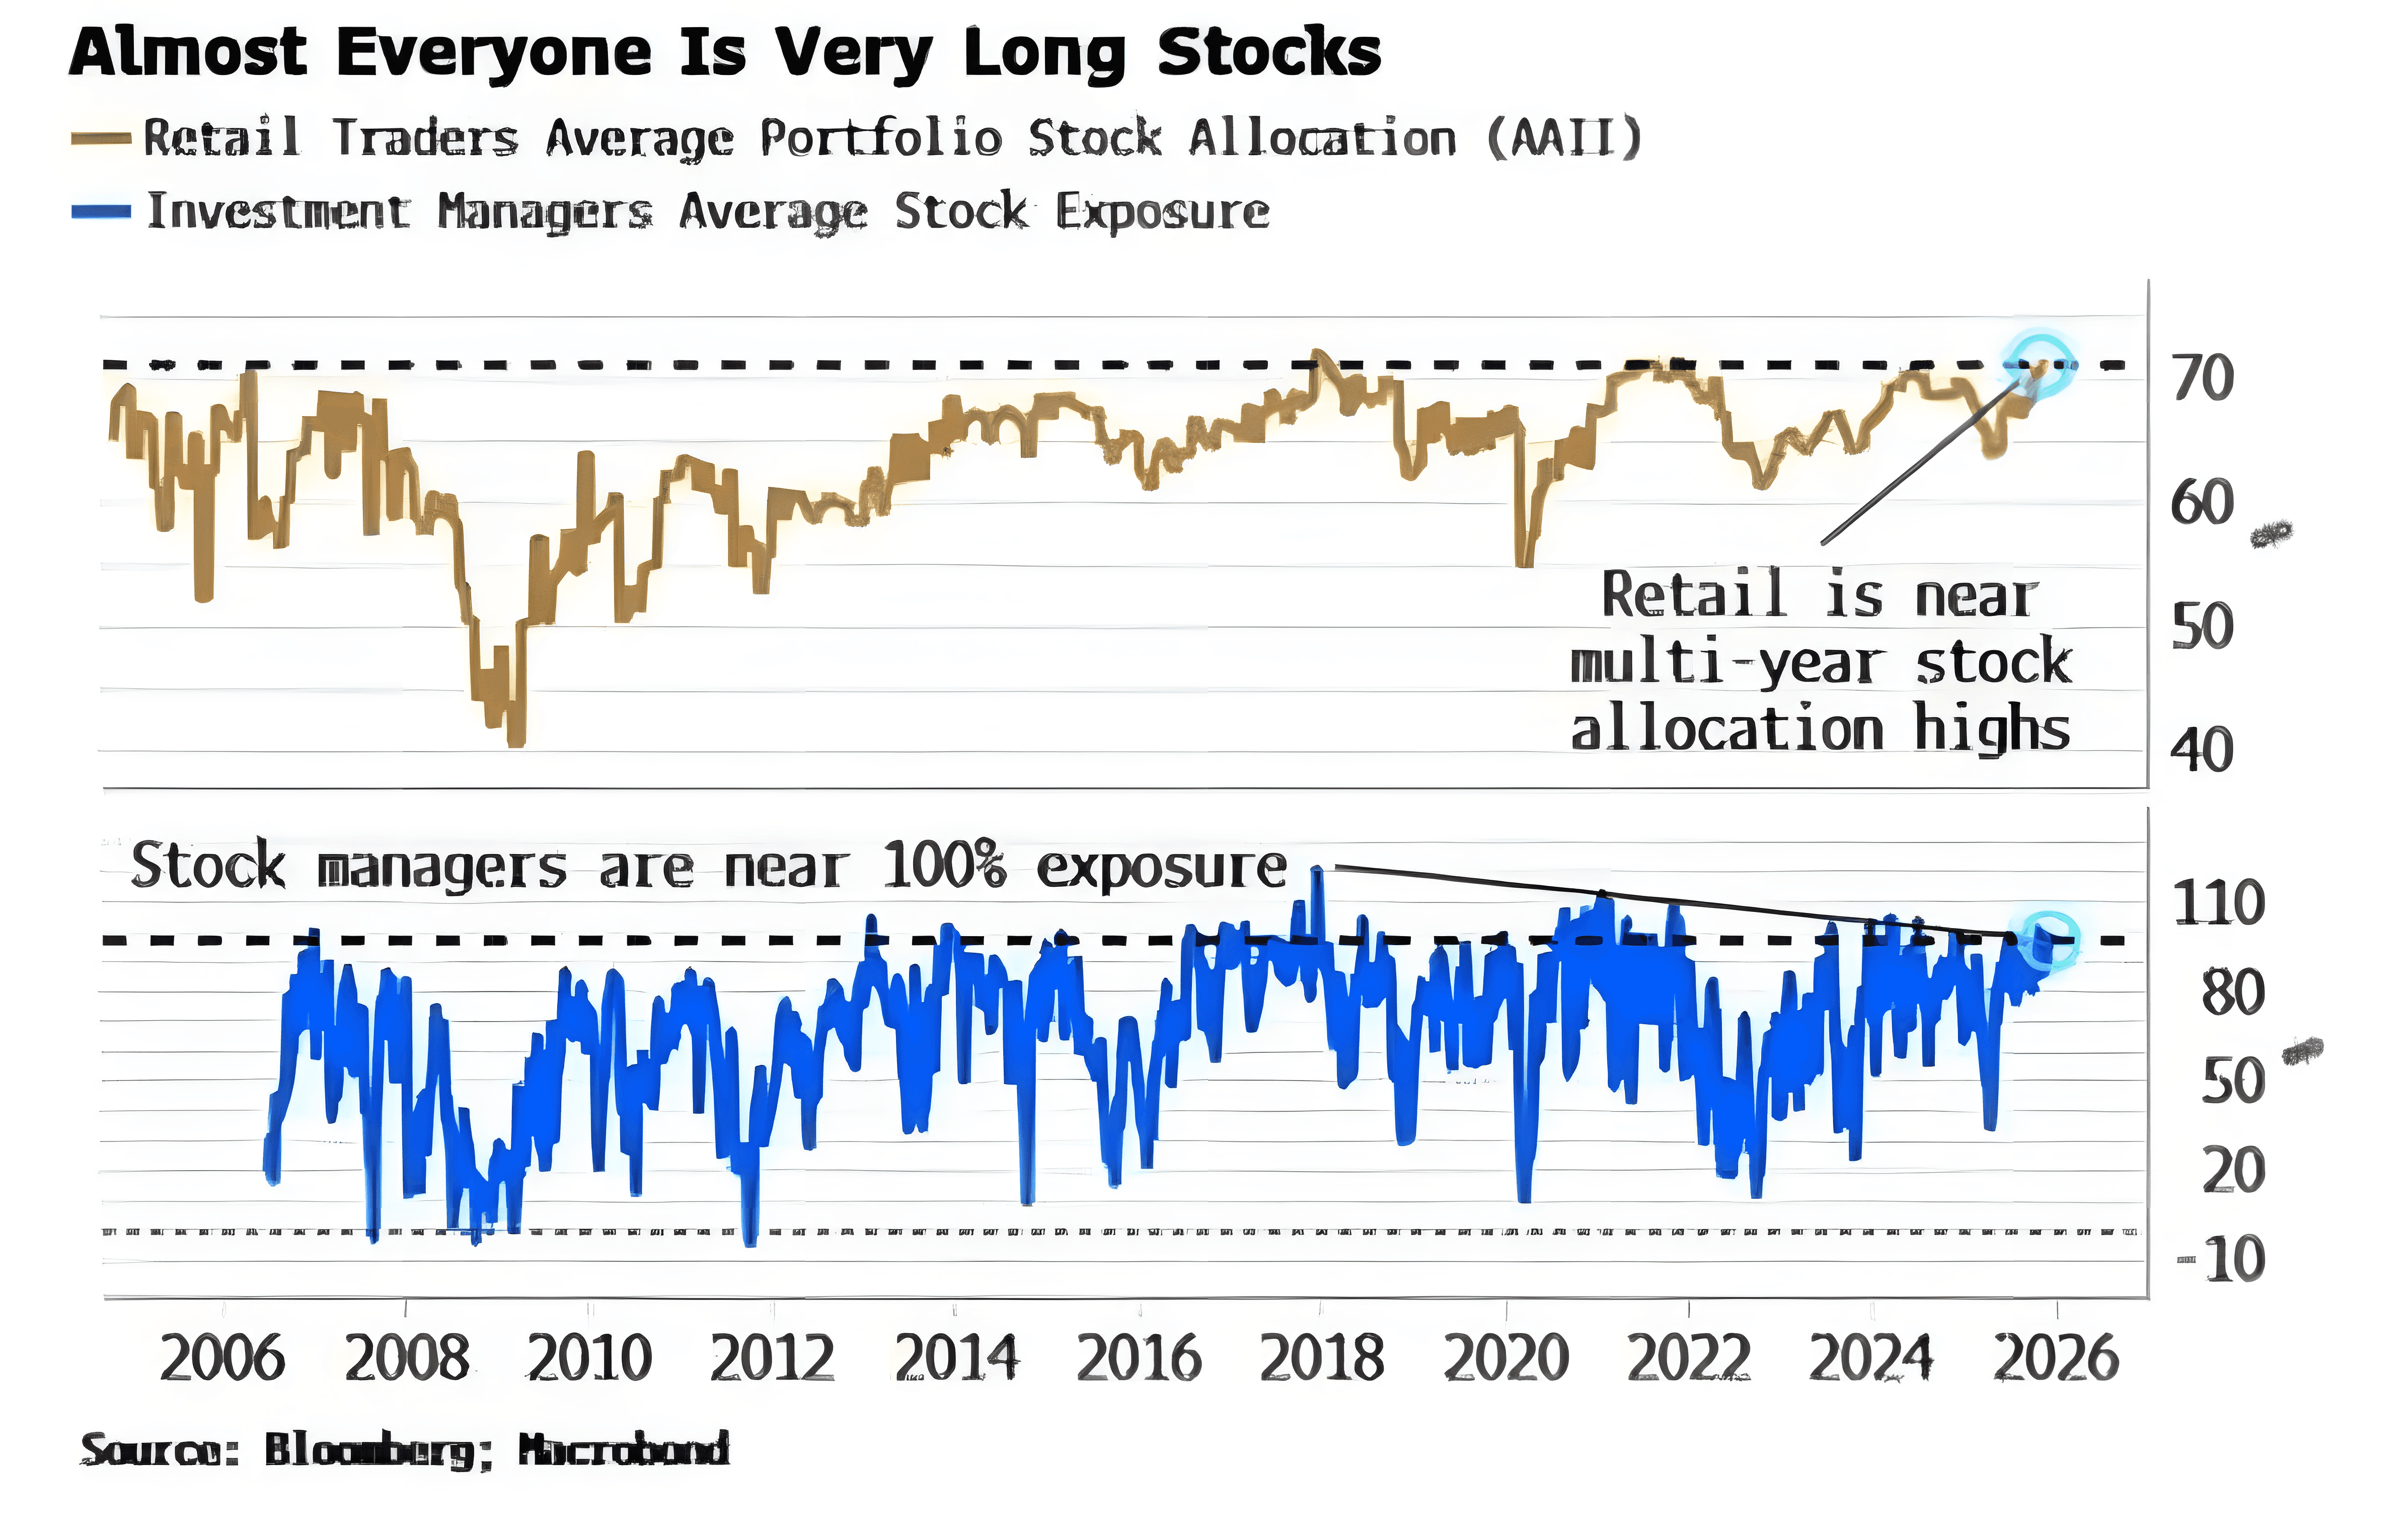
Fifth, Bank of America clients now hold about 65% of their portfolios in stocks. That is very close to a record high.
Everyone is already heavily invested. There is less new money left to push prices higher. A lot of the optimism is already priced in. This data point is not a sell signal by itself. But it’s a good temperature check.
And we know that the market loves to shake everyone out before it reverses higher for the next leg higher.
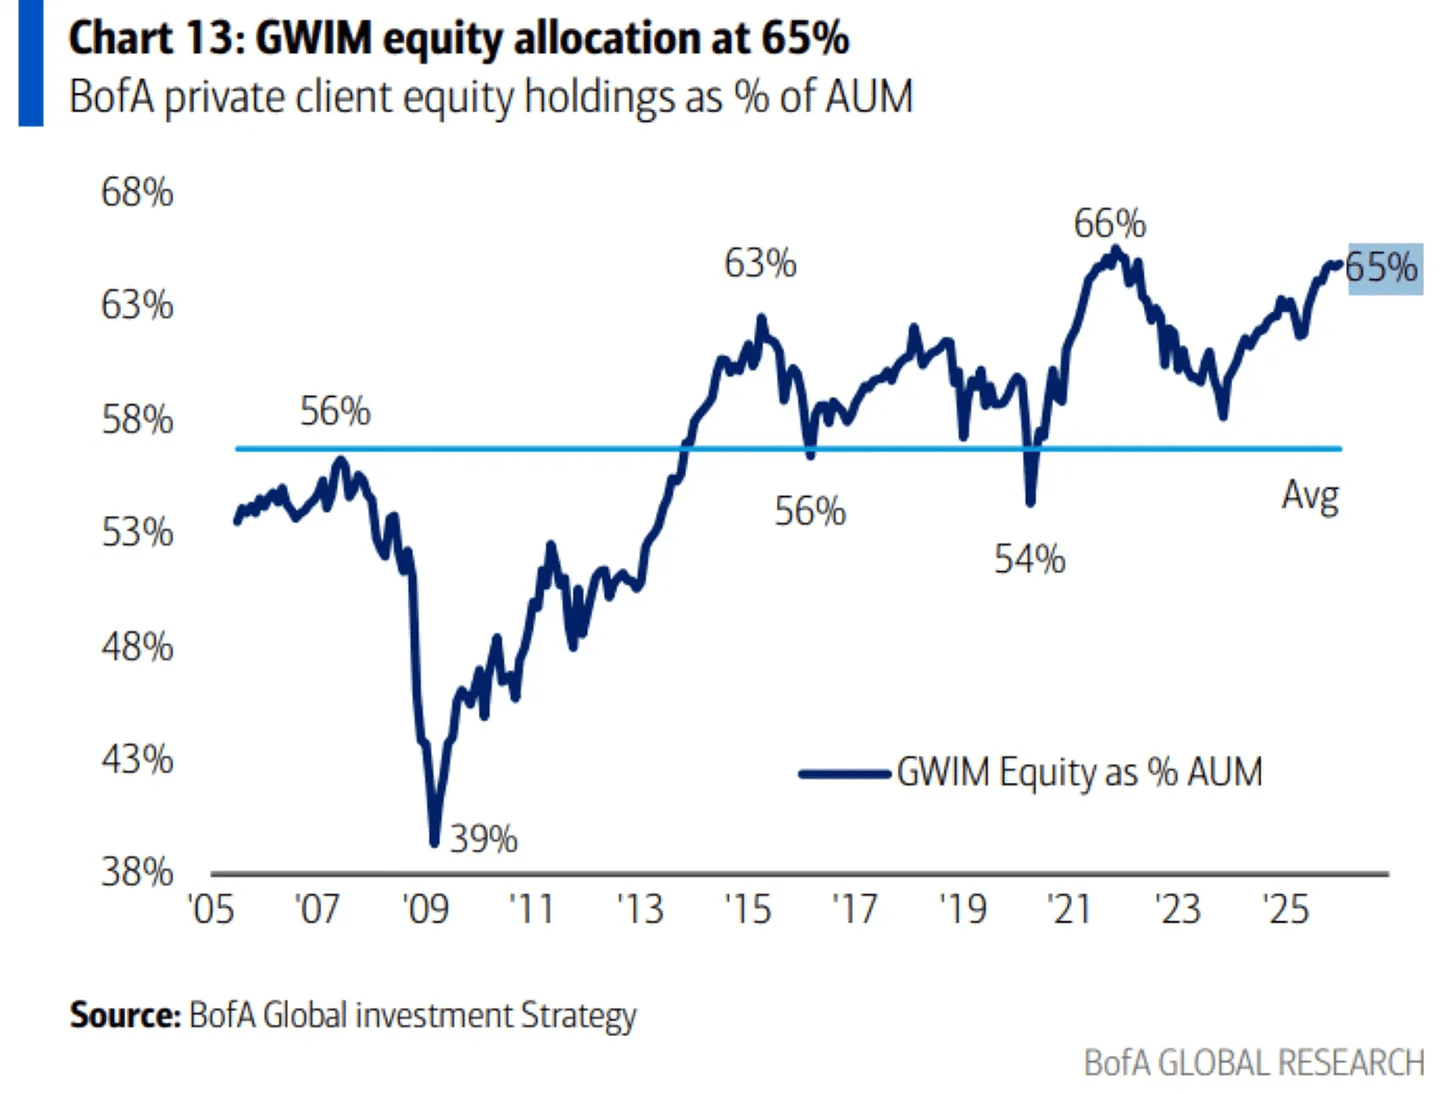
All of this is to say that there is a lot of leverage in the system right now.
Sooner or later, that has to balance out. Markets cannot function properly when leverage builds up too much, because even small price moves get amplified. Both leveraged long and leveraged short positions get whipped around or even forced to liquidate.
This is why we’re seeing this heightened volatility right now. That is the market’s way of clearing out the imbalance. Volatility flushes out excess leverage and resets the system.
But on the positive front, the overall market is holding up better than many expected. Even after recent volatility, the big indexes have not broken down. Every time the market looked like it might break down, it didn’t. Instead it recovered immediately.
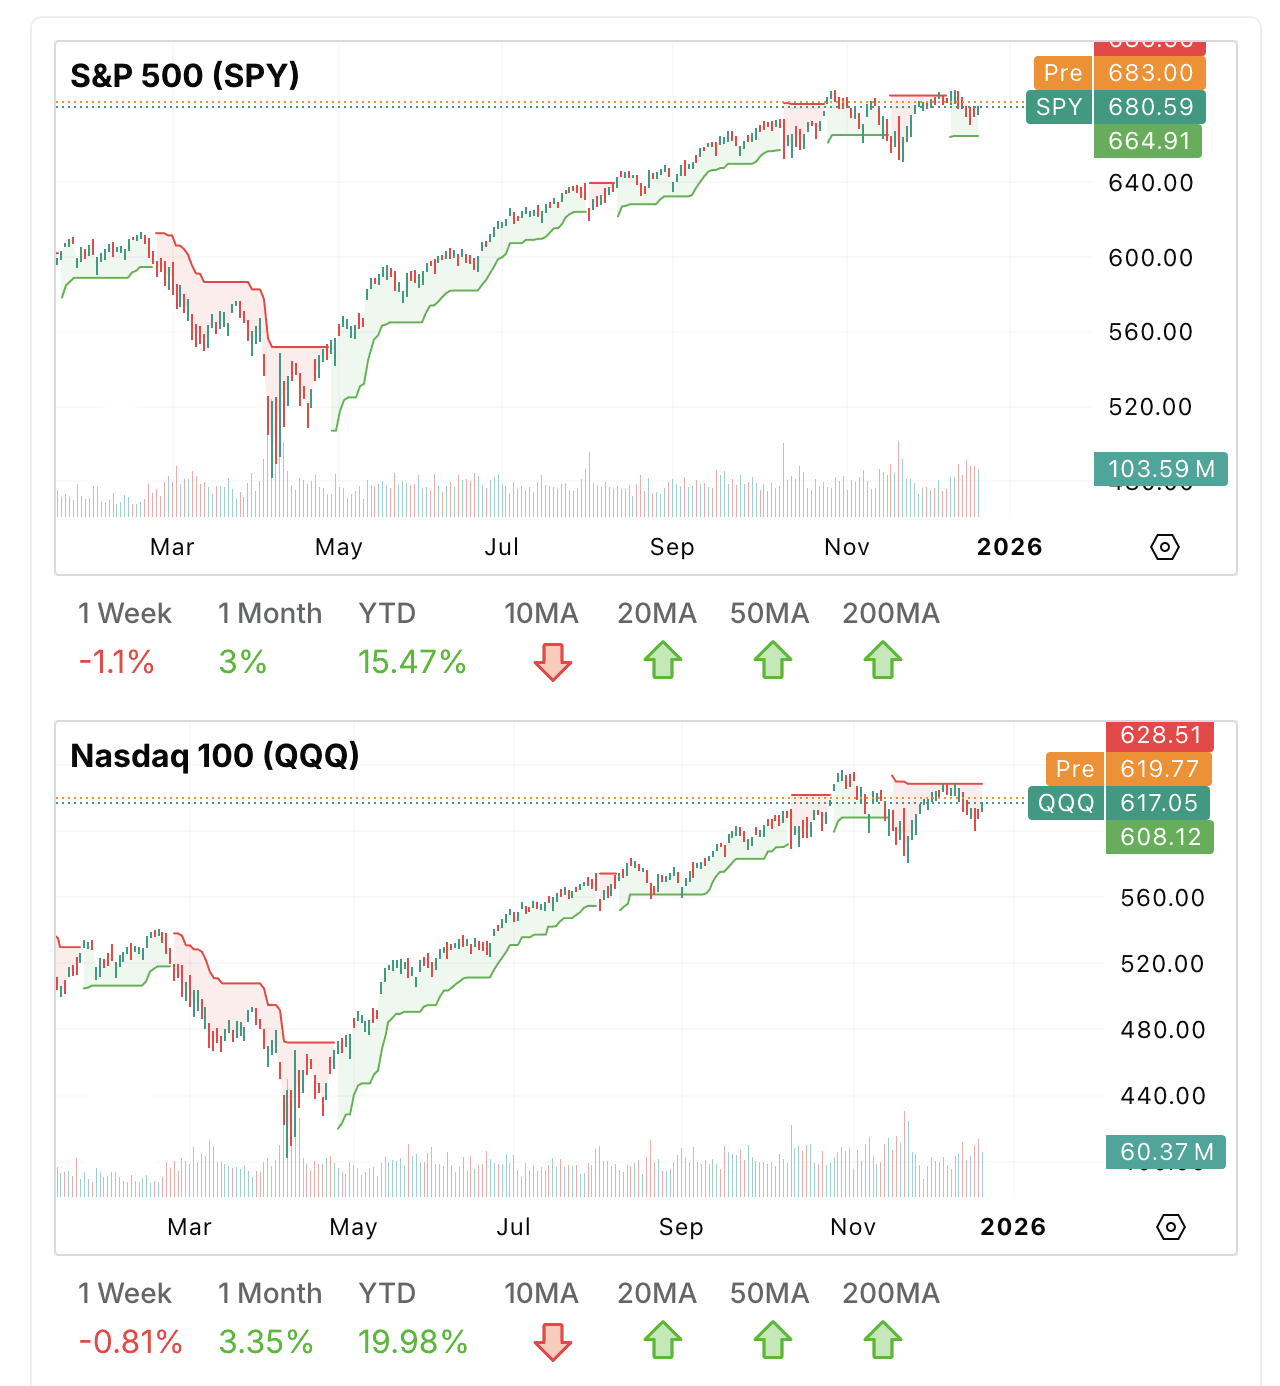
And now, we have seasonality on our side.
Going back to 1950, this is what the average December looks like.
People think the Santa Rally lasts all of December, but in reality it only covers the last few days of December and the first few days of January.
Maybe Friday marked the start of the Santa Rally.
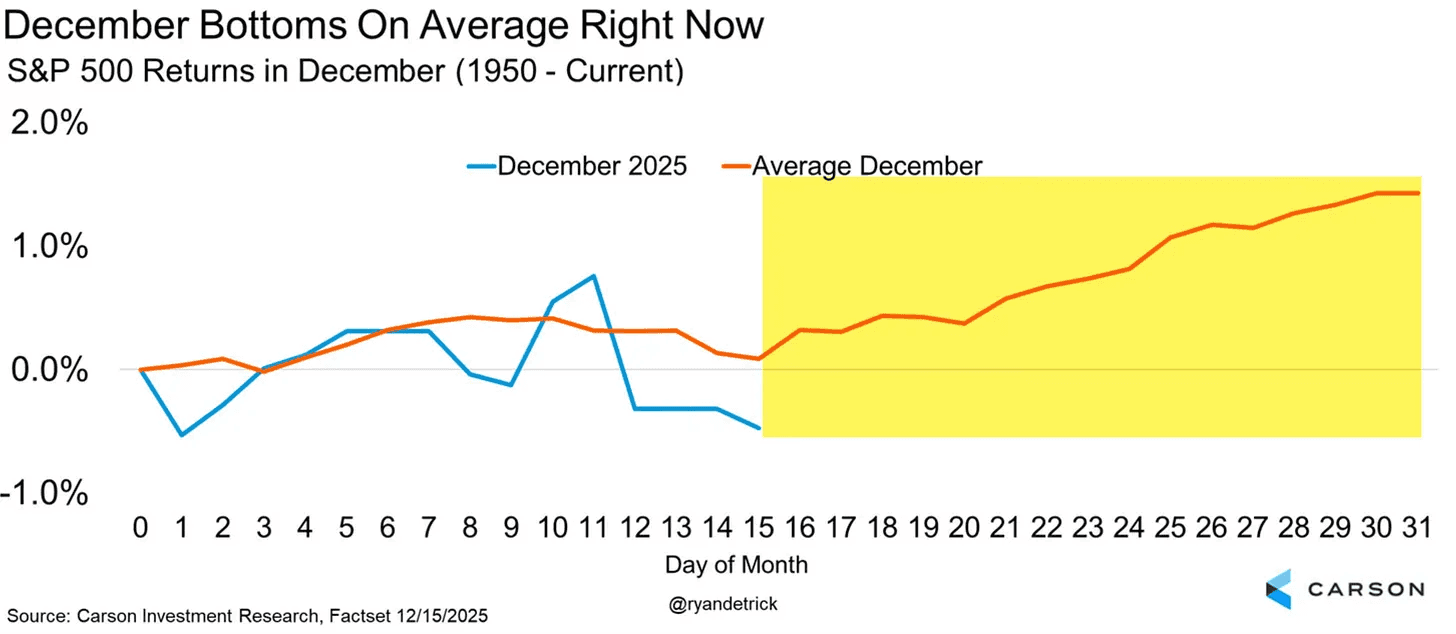
In fact, the S&P 500 is positive nearly 80% of the time during that stretch, making this one of the strongest periods of the entire year.
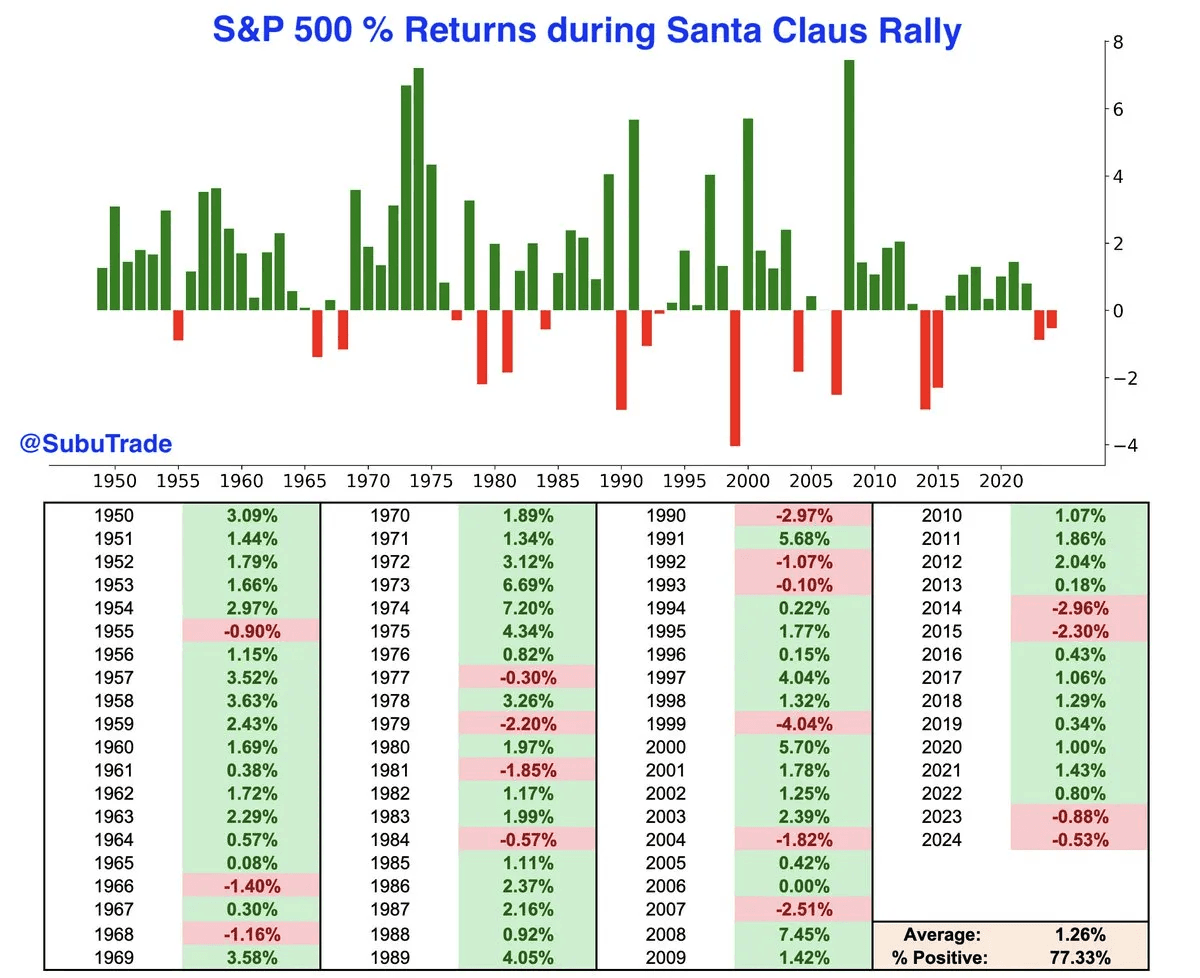
So there is no reason to be too bullish or too bearish right now. A neutral stance makes sense. It gives you flexibility, enough dry powder to deploy, and enough exposure so you don’t miss out on too much. You are not forced to make rushed decisions, and you can take advantage when good opportunities show up.
2026 will likely be another good year, but volatility is not going away. Large swings will be normal. That makes staying open-minded critical. The last 2 years showed that the biggest gains came from spotting major themes early and staying on top of them. That will matter just as much in 2026. Themes shift quickly, so you need to stay flexible and adapt. But we’ve been able to catch most of the leading themes. And we’ll do our best to do the same next year. I will share the top themes to focus on for 2026 in a separate update.
Lin
Weekly Market Update: Santa Rally?
This week looked pretty quiet, but underneath the surface the market had a lot going on.
The S&P 500 is now really close to a new all time highs. Under the surface, rate-sensitive stocks made big moves. Momentum is clearly coming back into the market as we head toward year end.
So, is this the start of the Santa rally?
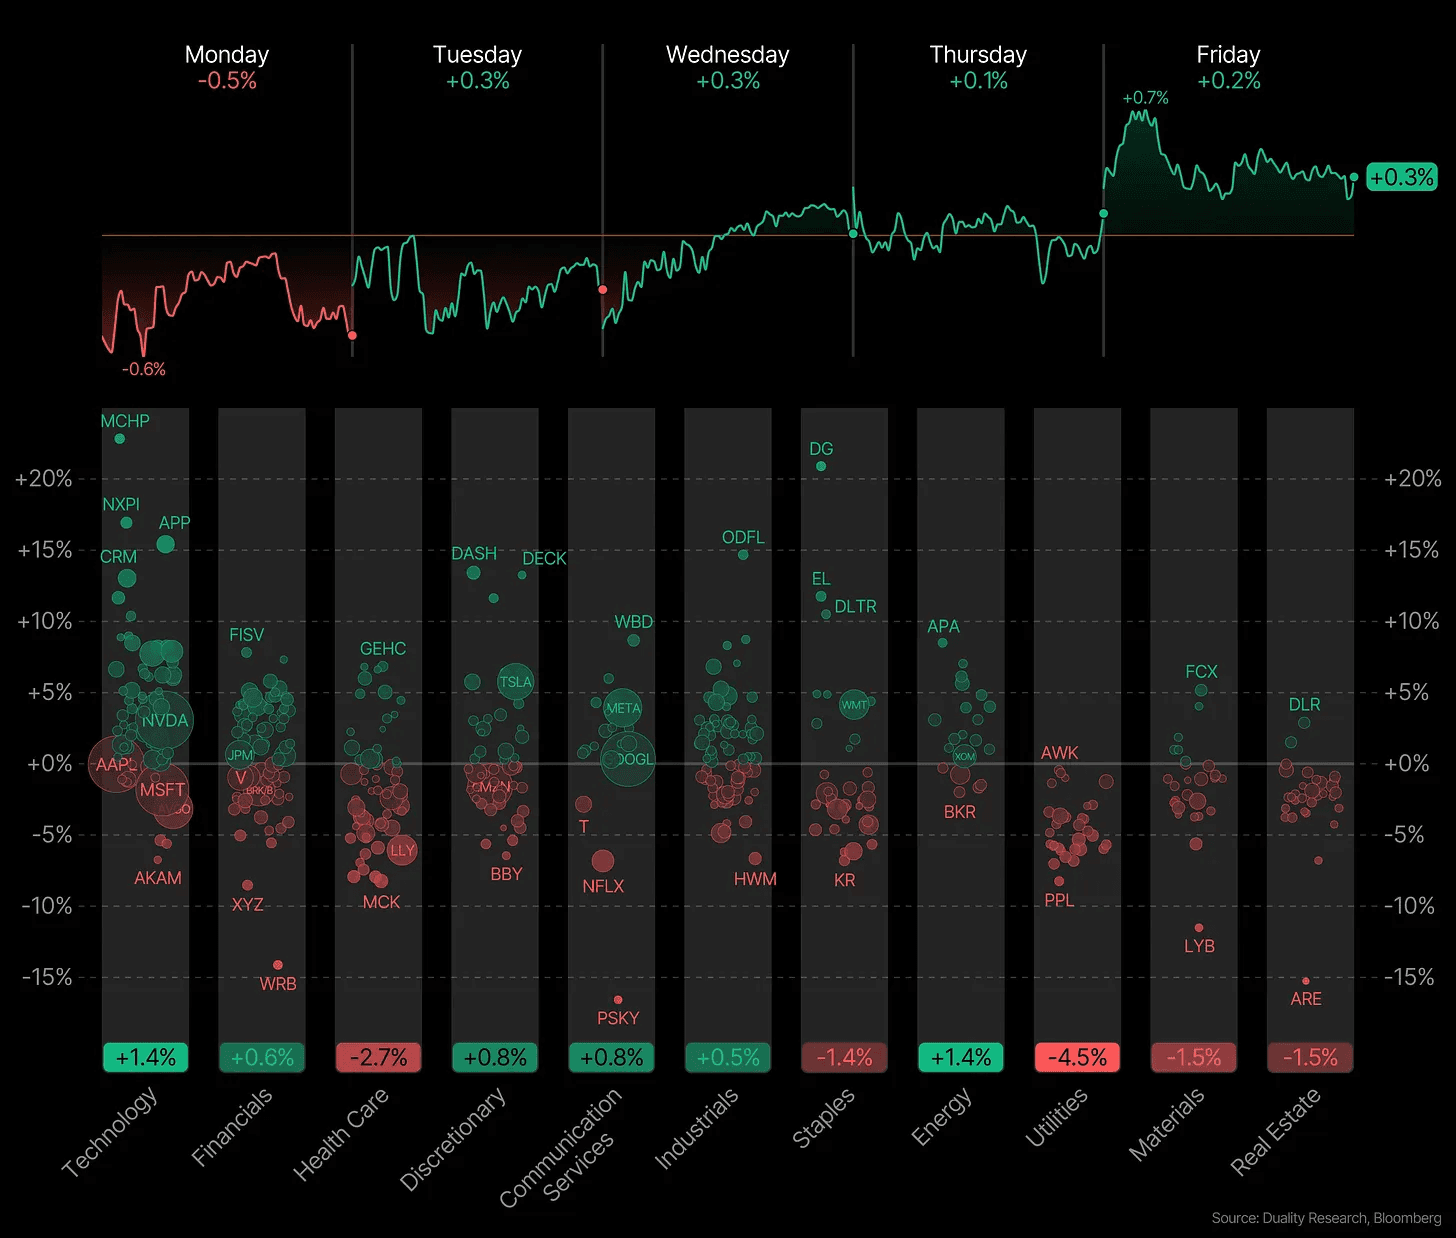
The odds of a December rate cut has jumped significantly, and the market is now pretty certain we’ll get one next week.
And if there is one thing the markets love it’s cheap money. Because it makes borrowing cheaper for companies and consumers. That usually boosts spending, earnings, and overall growth. Lower rates also make stocks more attractive compared to bonds, so money tends to flow back into equities.
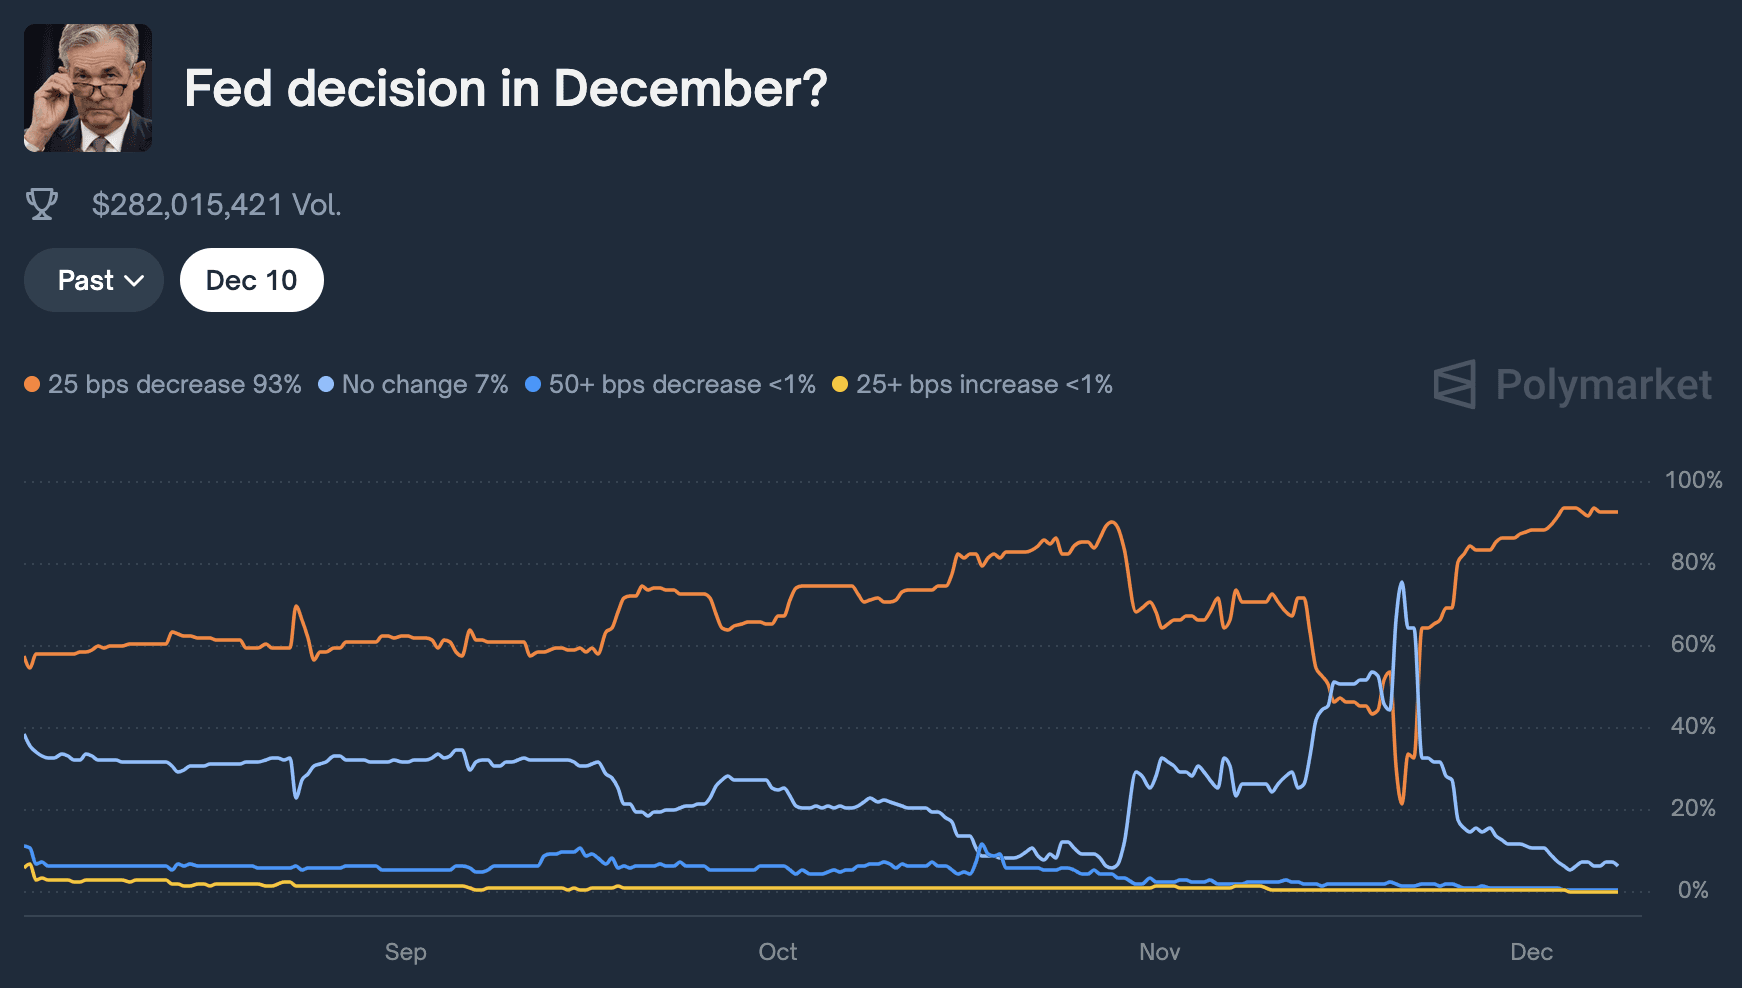
That’s why the Russell 2000 and small caps outperformed.
While rate cuts tend to lift most assets, they especially help homebuilders, small caps, industrials, and growth stocks. Seeing those groups lead tells us the rally is starting to broaden, not narrow.
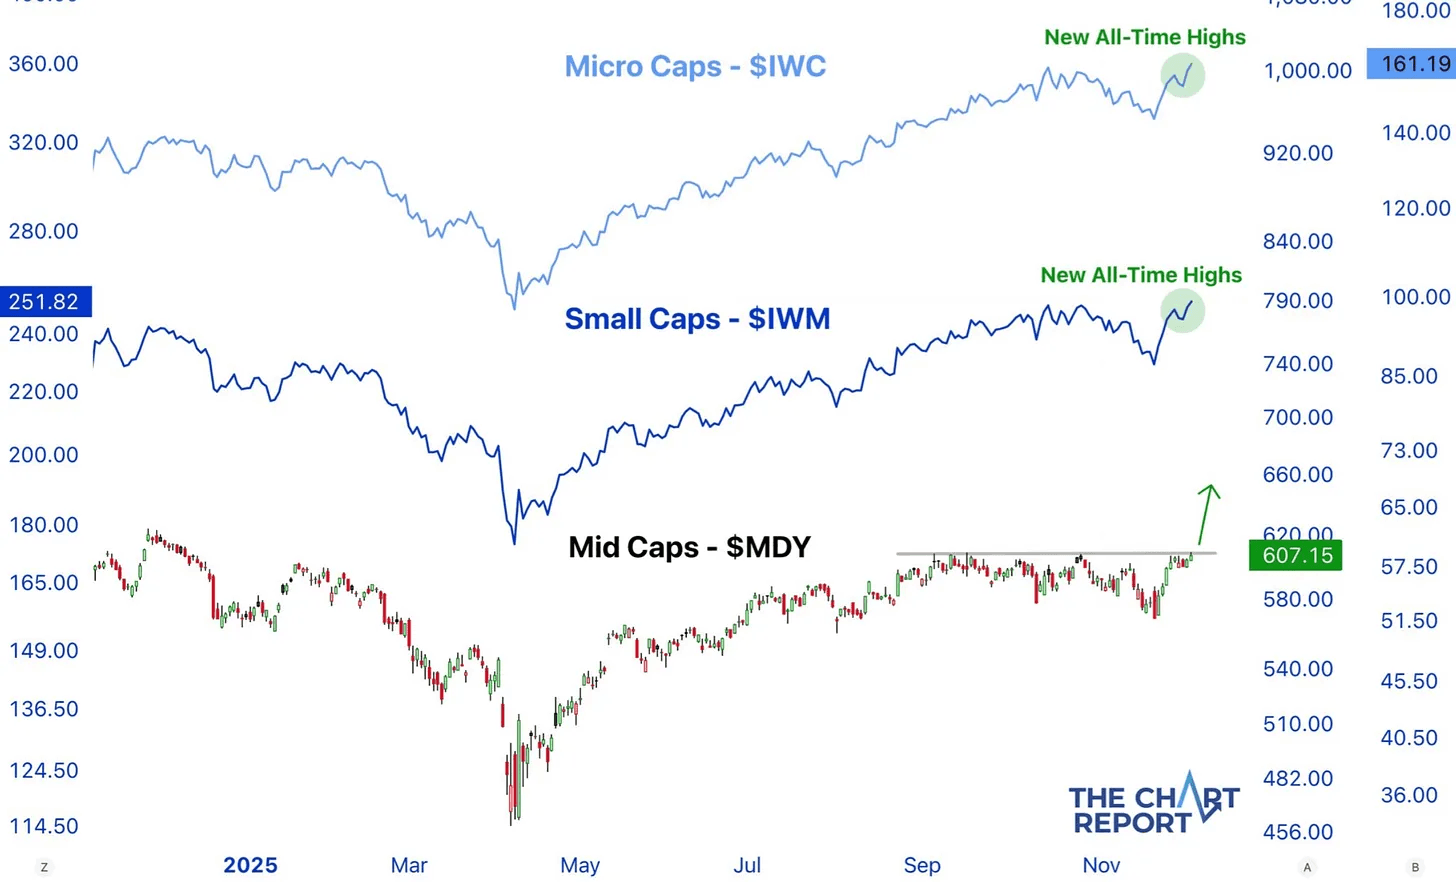
And it’s not just about Nvidia or the Magnificent 7. November already proved that the market can hold up even when those names pull back. Even though Nvidia and others corrected, the S&P barely moved and we saw some rotation into other sectors. That’s exactly what you want to see in a healthy market.
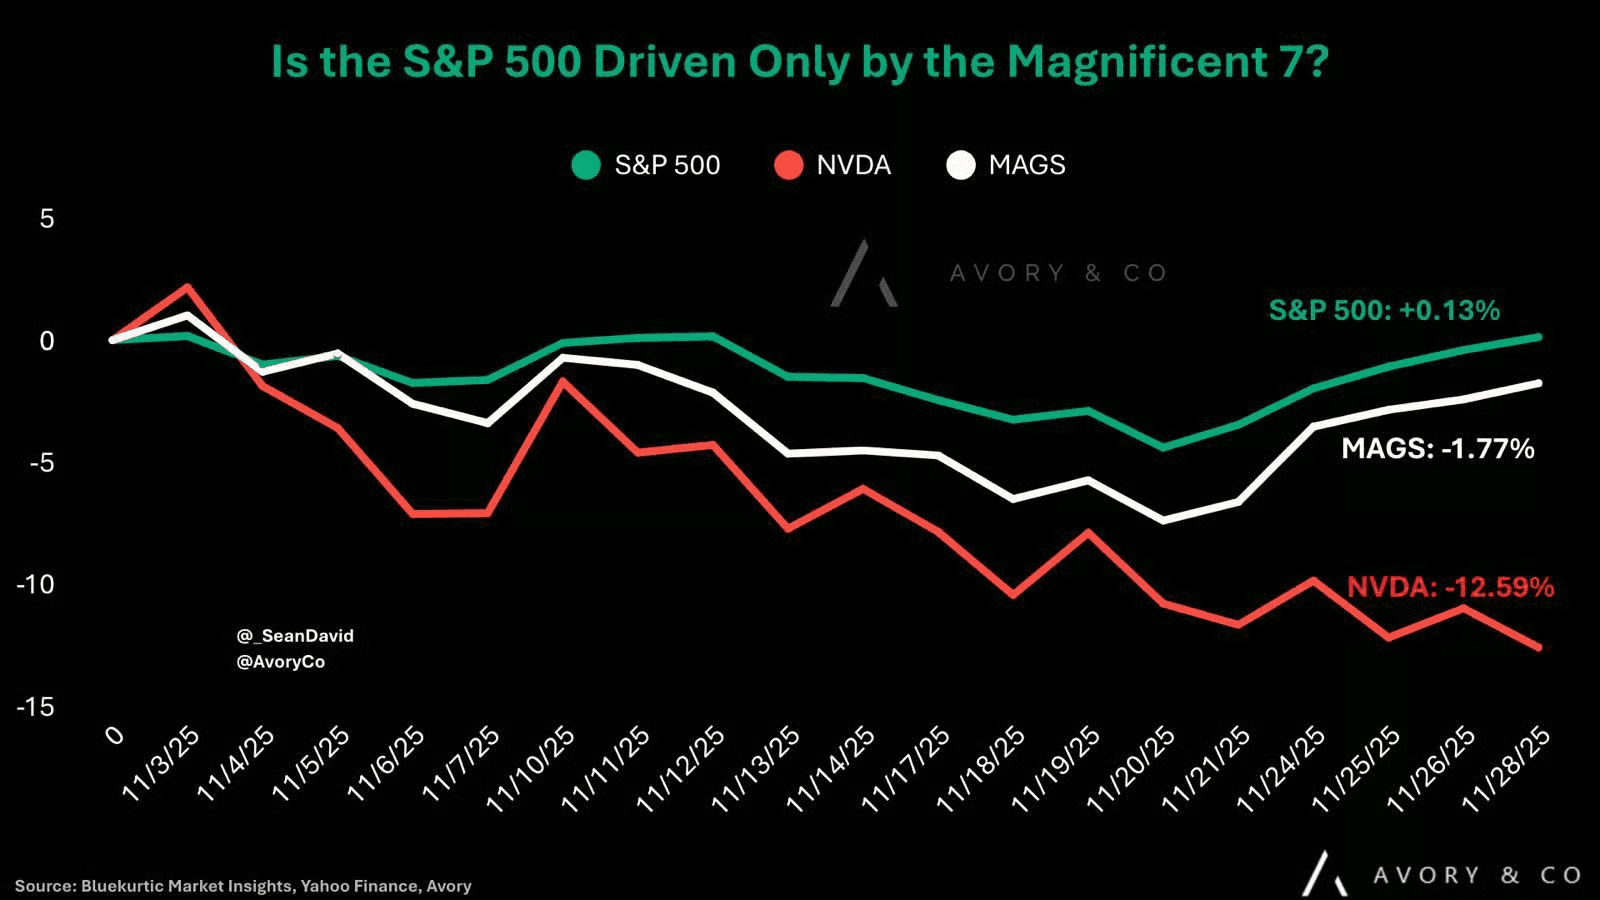
If you take out the Magnificent 7, the rest of the S&P 500 is already at a new high. That should make it clear that the rally isn’t just big tech carrying the entire market.
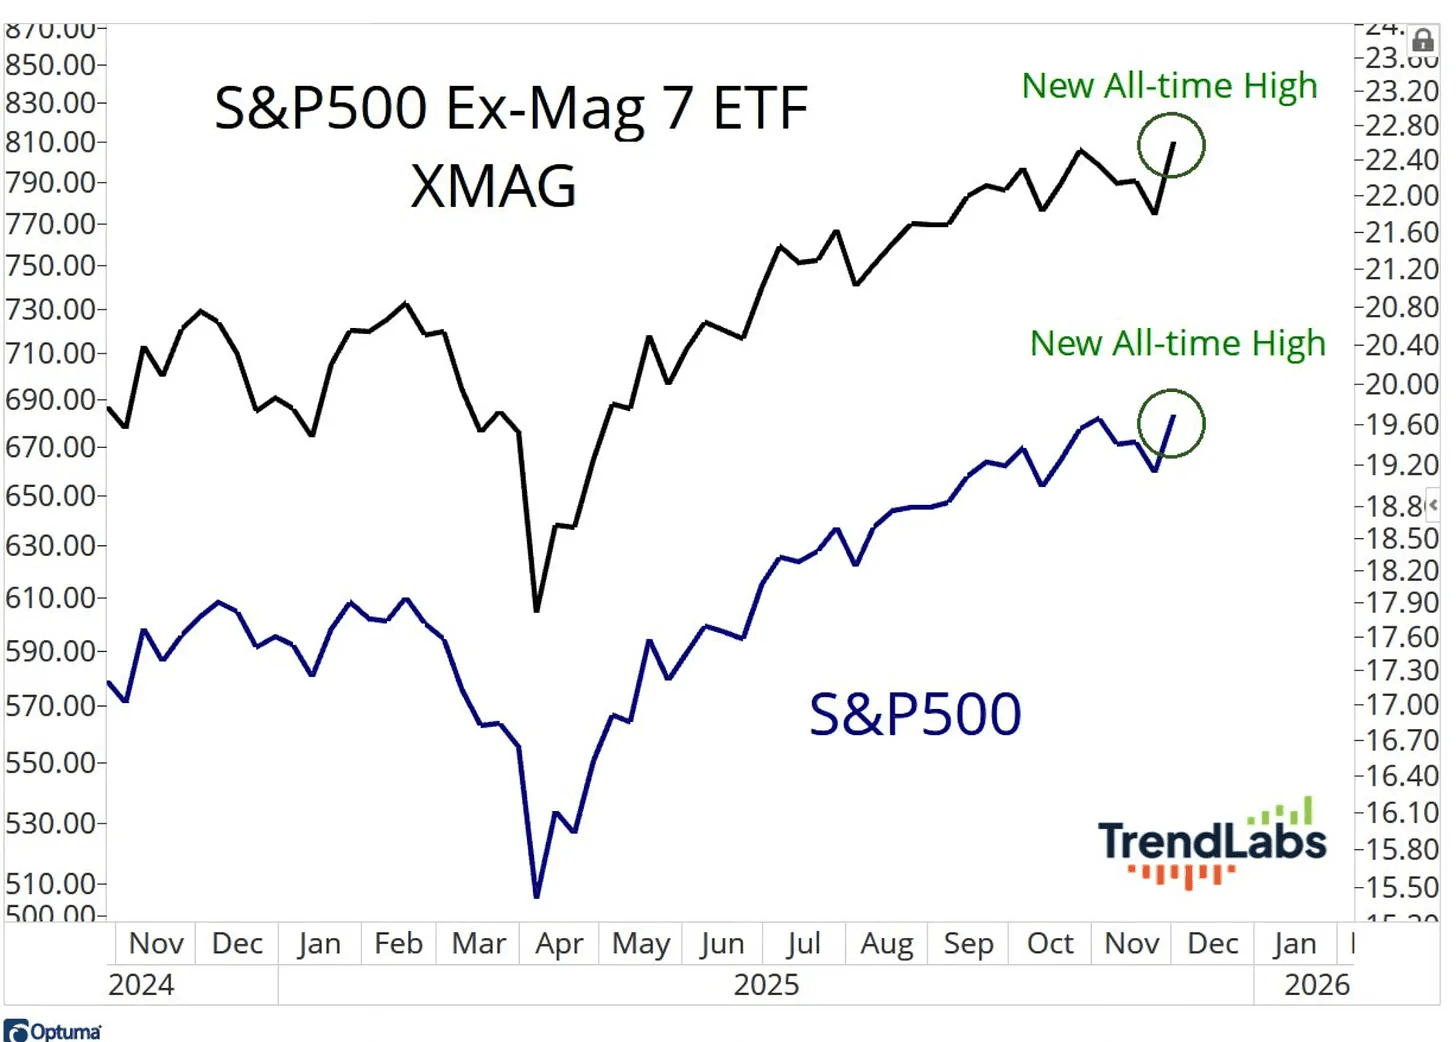
Bearish responses in the AAII survey just fell below 31% for the first time in almost a year. That’s rare. It has only happened 3 other times, and in each of those cases the market moved higher afterward. It’s a sign confidence is coming back to the markets.
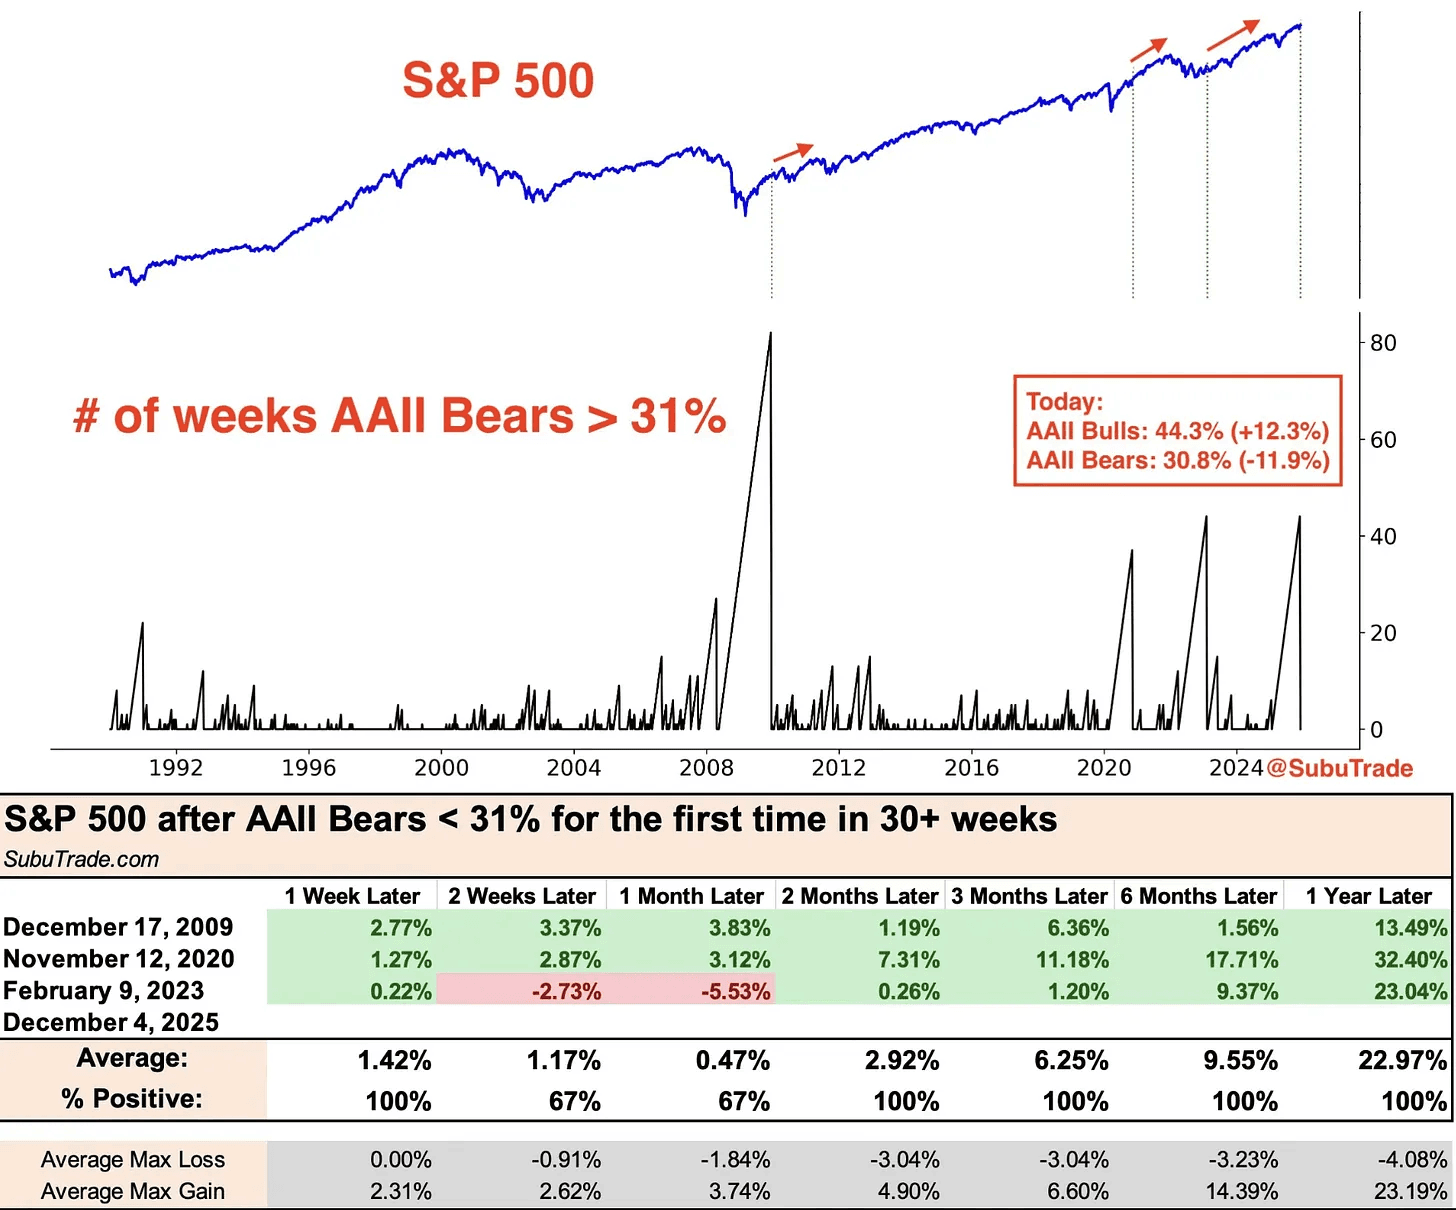
December is historically the strongest month for stocks. It has a better win rate than any other month, with the S&P finishing higher almost 3 out of every 4 years.
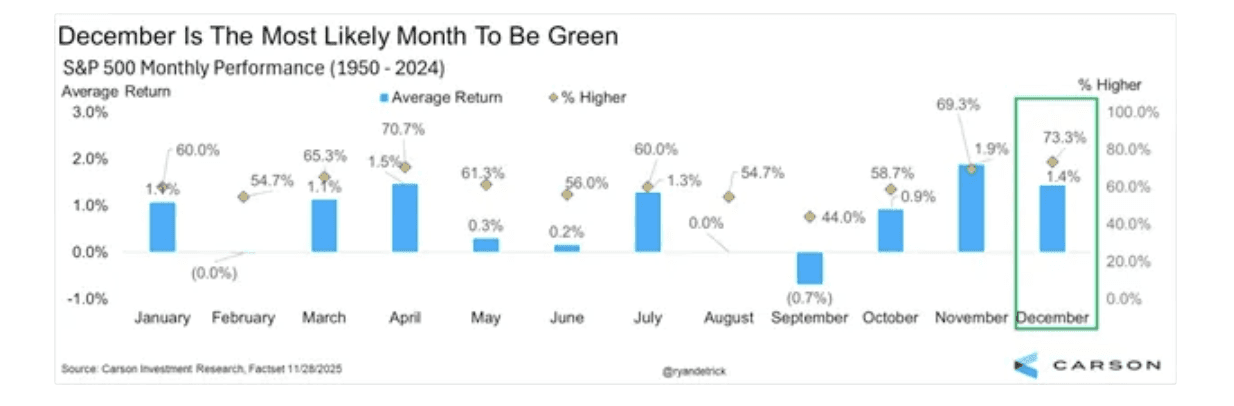
Stocks were lower last year in December. But back-to-back negative Decembers are really rare. The last time we had two in a row was 2014 and 2015, and before that you have to go all the way back to 1980 and 1981. So, the odds are in our favor for now.
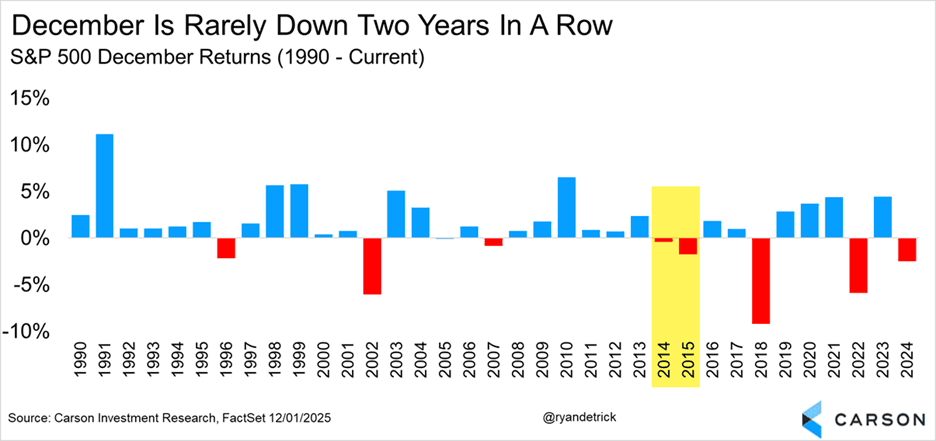
The Santa Claus Rally isn’t the whole month of December. It’s only the last few trading days of the year plus the first days of January. So, the first half of December is usually choppy, and the actual rally tends to show up near the end. Hence, near-term volatility should be expected.
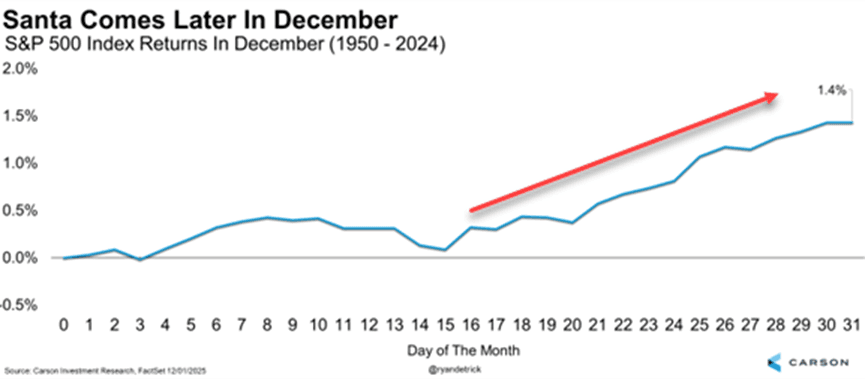
Strength begets more strength.
When the S&P is already up more than 10% by November, it usually keeps pushing higher. In fact, the last 16 times this happened, the final 2 months of the year were positive every single time.
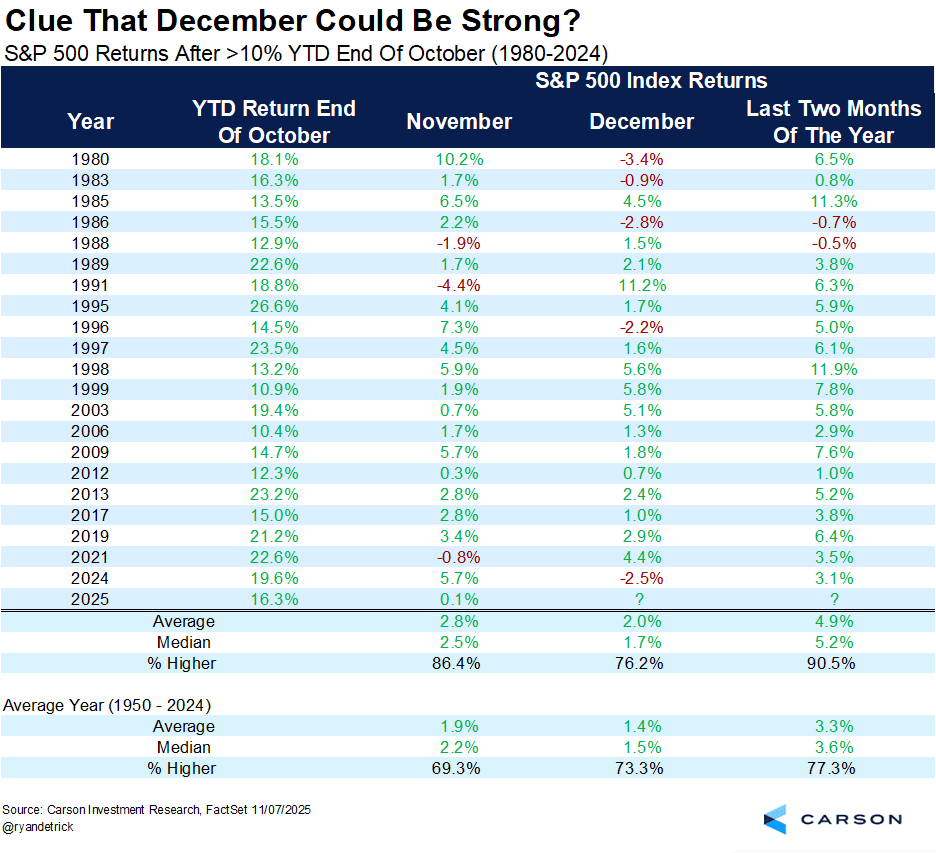
The S&P 500’s YTD return of 17.8% came from:
Earnings growth contribution: +12.2%-points
Multiple growth contribution: +4.2%-points
Dividends: +1.4%-points
Most of the gains this year actually came from earnings growth. About 76% of the S&P 500’s return came from profits and dividends, not just higher multiples. As long as the economy doesn’t fall into a recession, there is no reason to think that this won’t continue.
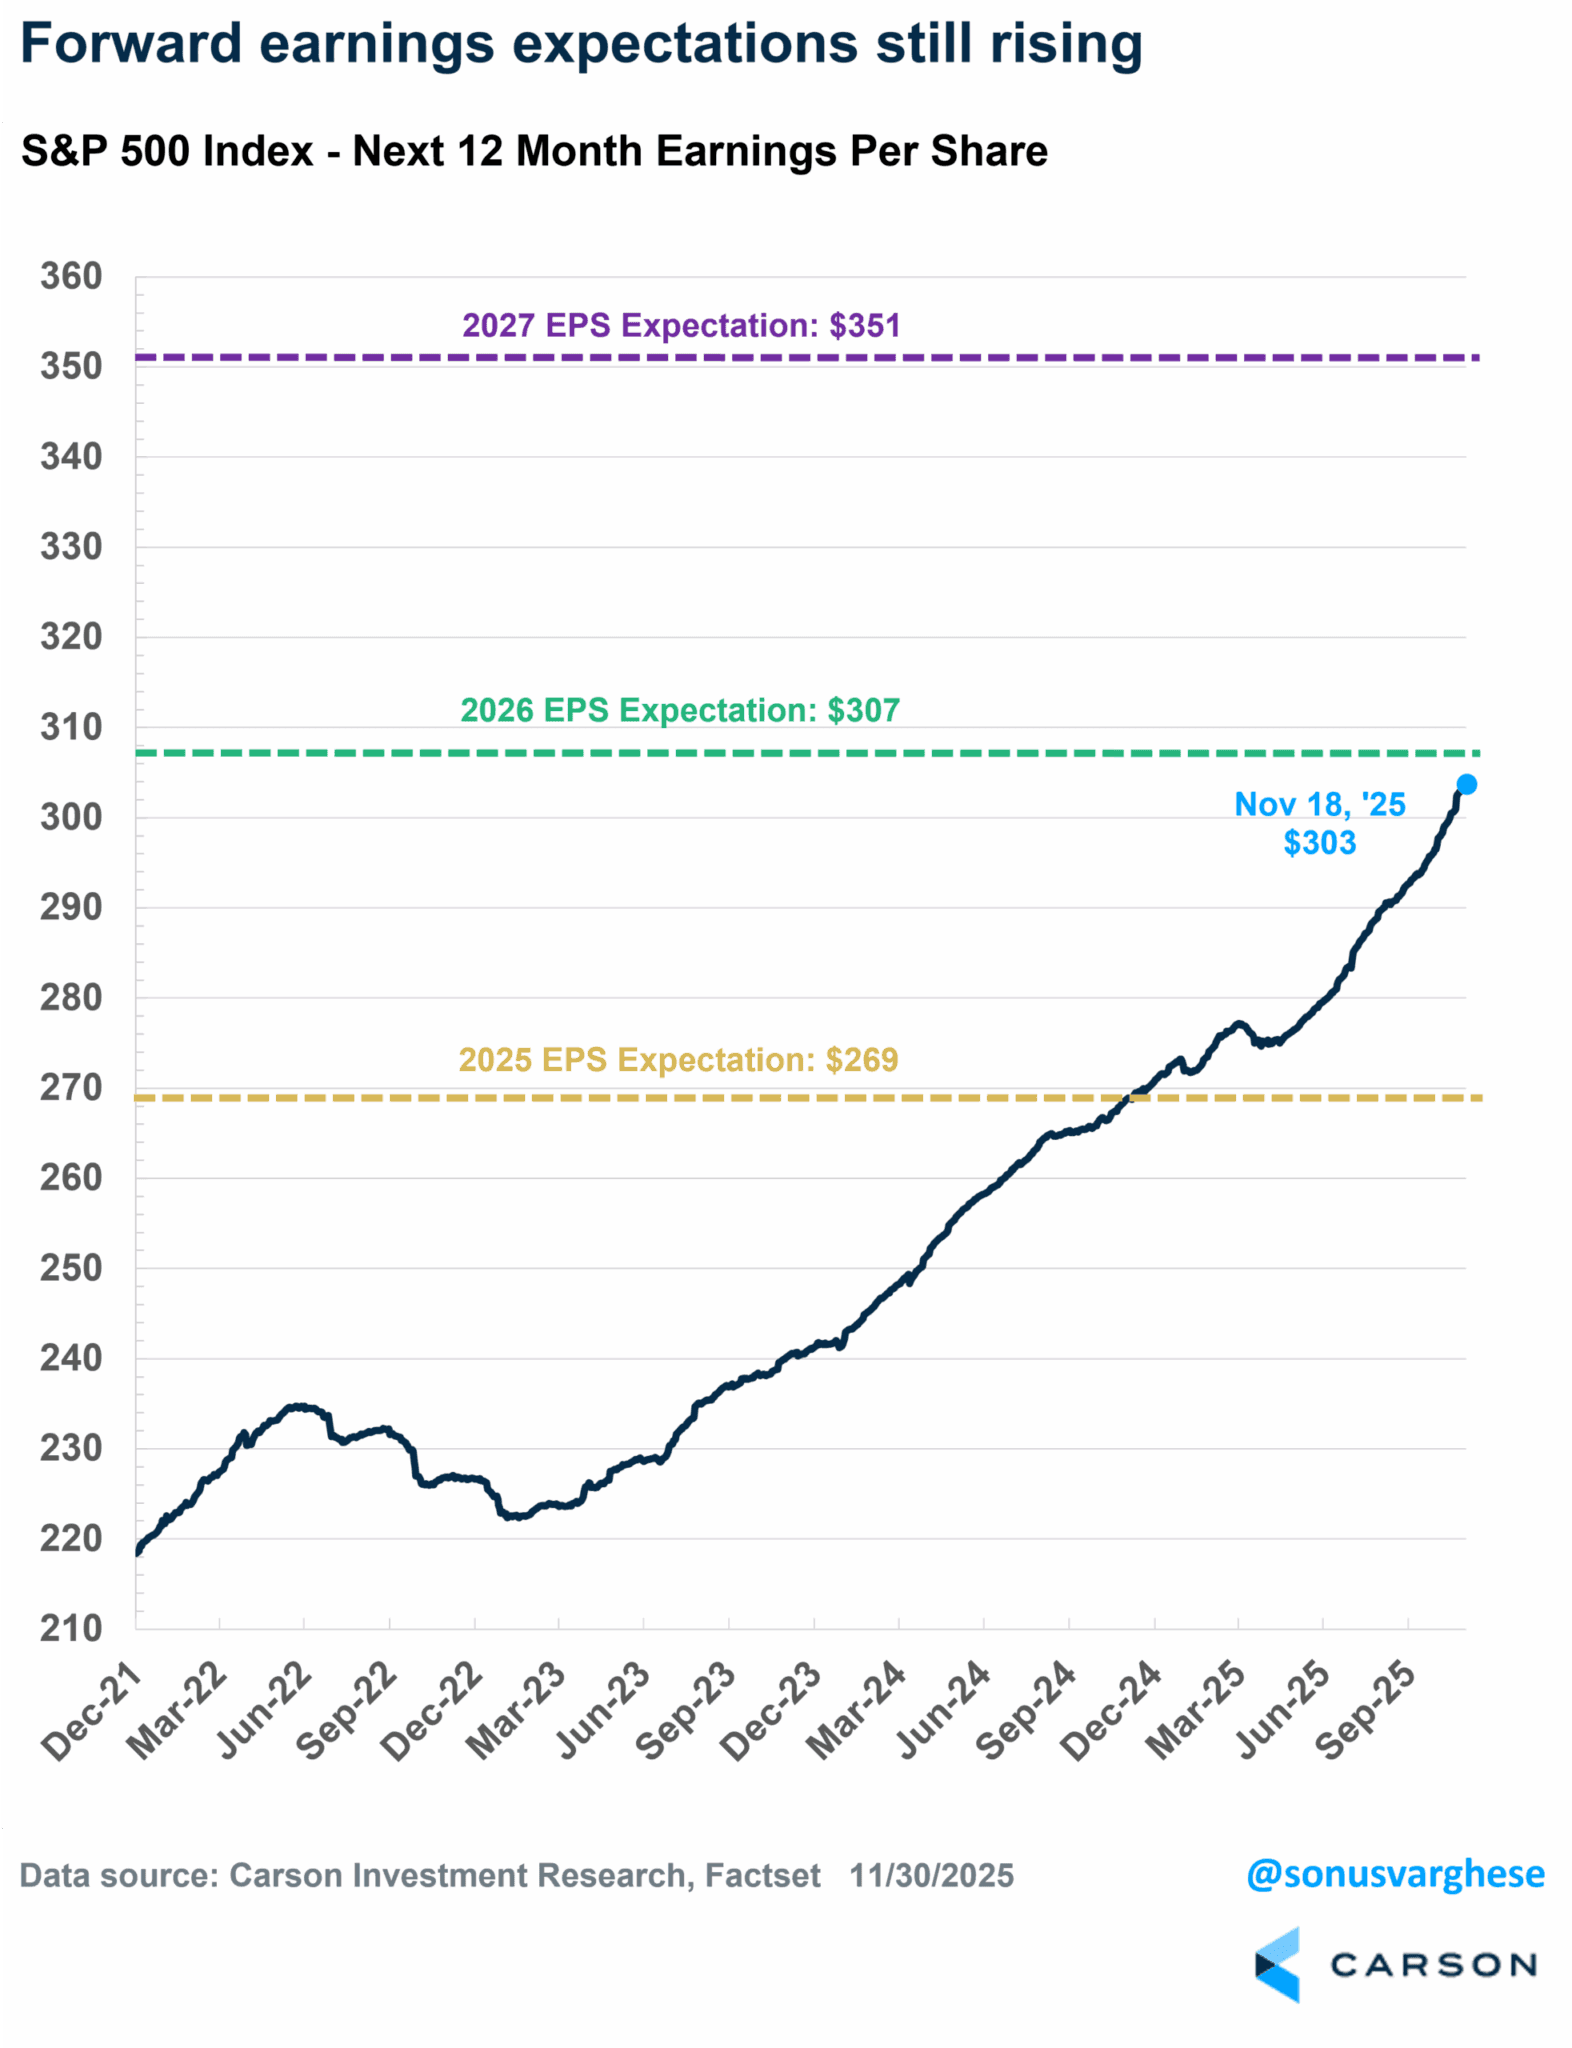
Profit growth mainly comes from 2 things: higher sales and higher…
Exposure Level
Guidance:
Neutral
0%
100%
Trend Indicator
Long-Term:
Up
Intermediate-Term:
Sideways
Short-Term:
Sideways
Risk Indicators
Volatility:
High
Sentiment:
Neutral
Momentum:
Neutral
Leading Sectors
View All
Energy
Biotech
Fintech
Cybersecurity