Go Back

Lin
Weekly Market Update: Time of War
The war in Iran has added another shock to already fragile markets.
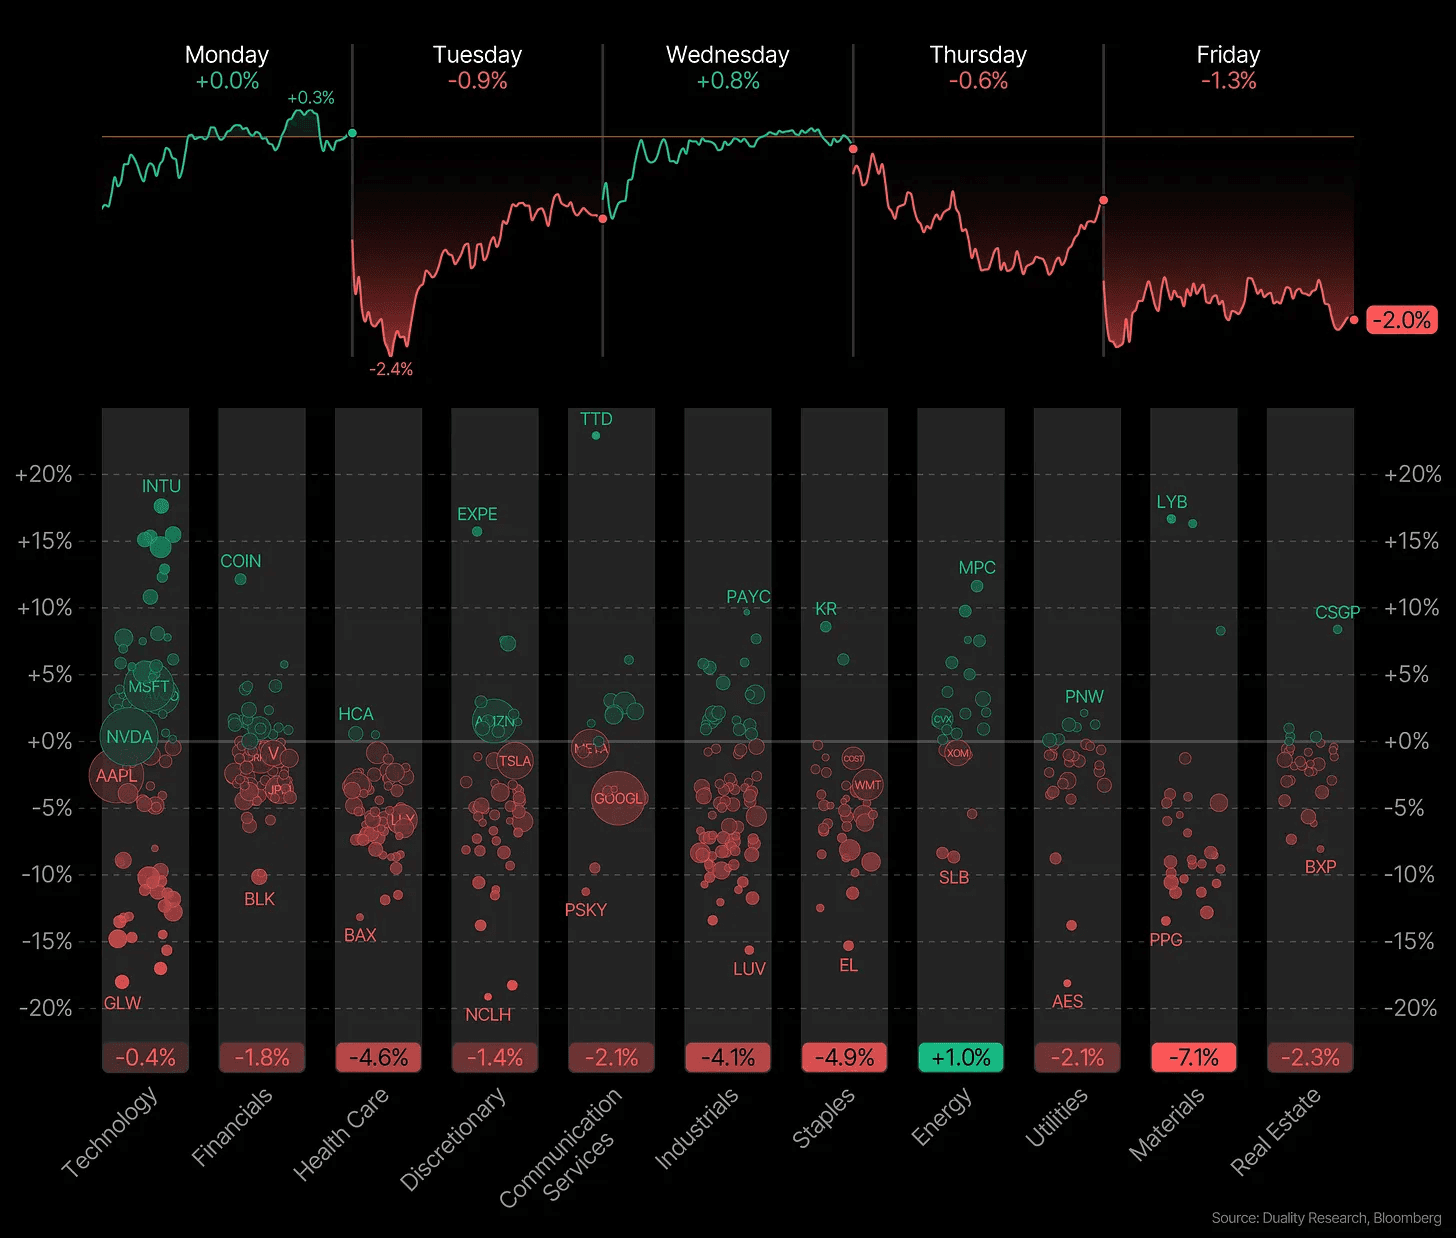
Volatility picked up across nearly every asset class. The S&P 500 fell 2.0%, marking its worst weekly performance since November. The weakness was broad. The Dow Jones dropped 3.0%, while the small cap Russell 2000 led the decline with a 4.1% loss.
In contrast, gold held up well and is up 18.6% this year despite a small pullback this week. Unsurprisingly, oil has been the biggest mover as the market prices in supply risks from the Middle East. Oil is up 36.4% this week alone.
This is the playbook that we’ve seen over and over again:
1. The initial shock
Right when conflict begins, markets usually drop. Investors hate uncertainty. Nobody knows how big the conflict will get, how long it will last, or what it will affect.
So investors reduce risk.
This often leads to short term market declines and rising volatility. Money flows out of stocks or other risk assets into safe havens like gold, government bonds, and the US dollar.
2. The commodity spike
Wars often affect energy and resources. If a conflict happens in an important region, markets worry about supply disruptions. This is why oil, energy companies, and defense related industries sometimes perform better during these periods.
3. The adjustment
After the first shock, markets usually adapt. Investors begin to understand the scale of the conflict and price in the real economic impact. And most importantly, uncertainty starts to resolve.
Historically, this happens surprisingly fast.
Because markets are forward looking. Investors do not price what is happening today. They price what they think will happen in the future. All of those expectations get priced into markets very fast.
On top of that, markets react mostly to uncertainty, not just bad news. The start of a war creates maximum uncertainty. Investors do not know how large the conflict will become, how long it will last, or what countries might get involved. But once the situation becomes clearer, even if the news is still negative, markets often start to stabilize.
We’ve seen this happen plenty of times in the past. During conflicts like the Gulf War, the Iraq War, or the invasion of Ukraine, markets panicked quickly at first. But once investors understood the scale of the conflict and its likely economic impact, markets started focusing again on growth, earnings, and interest rates.
The market always tries to price the future before it happens.
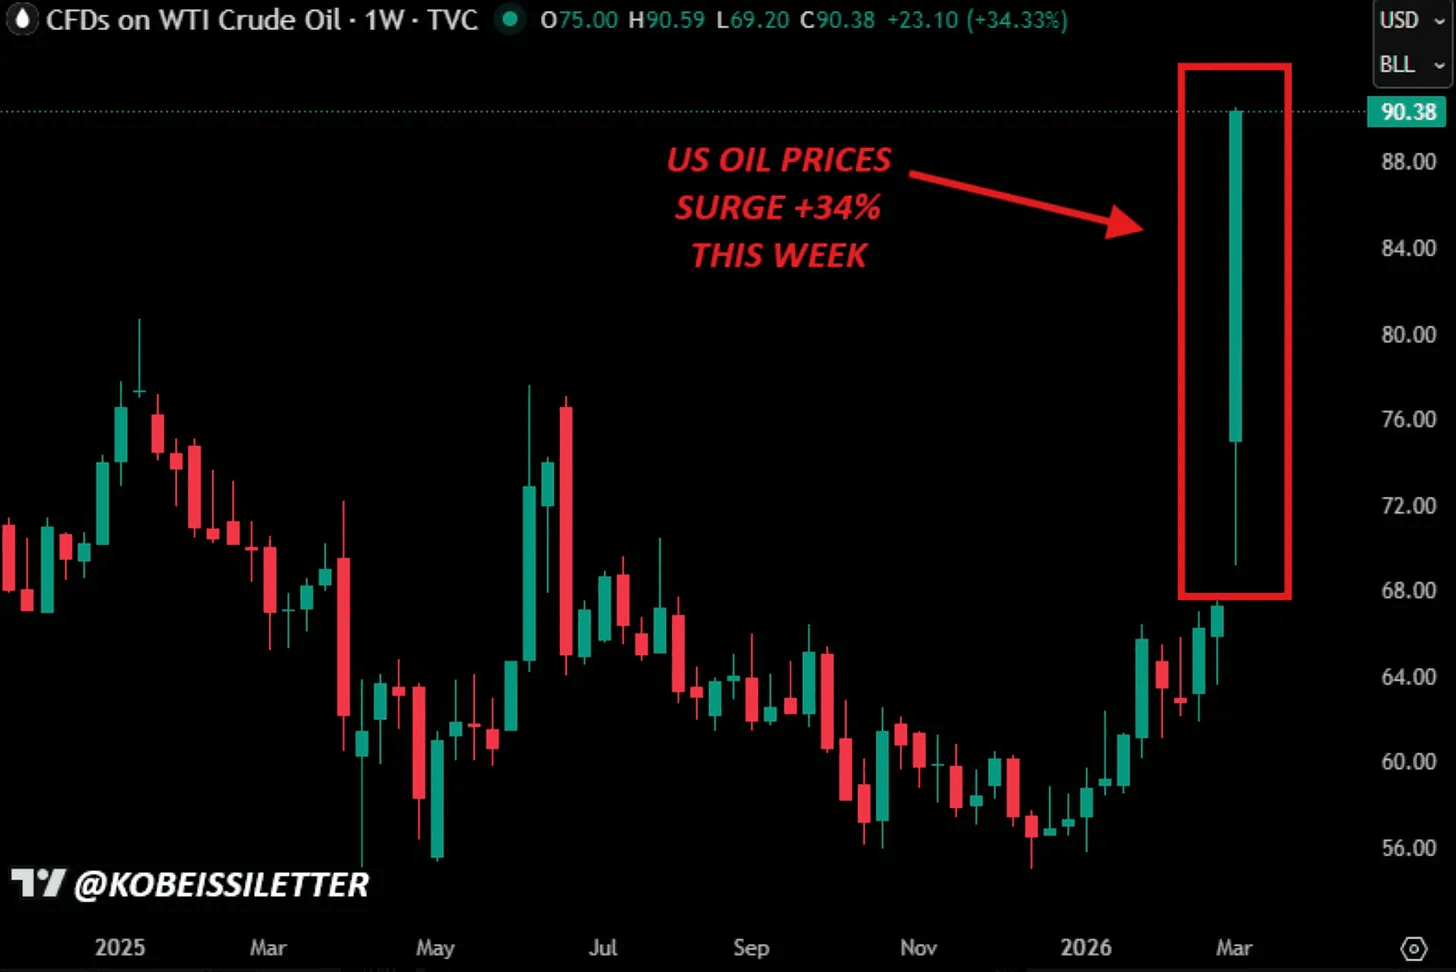
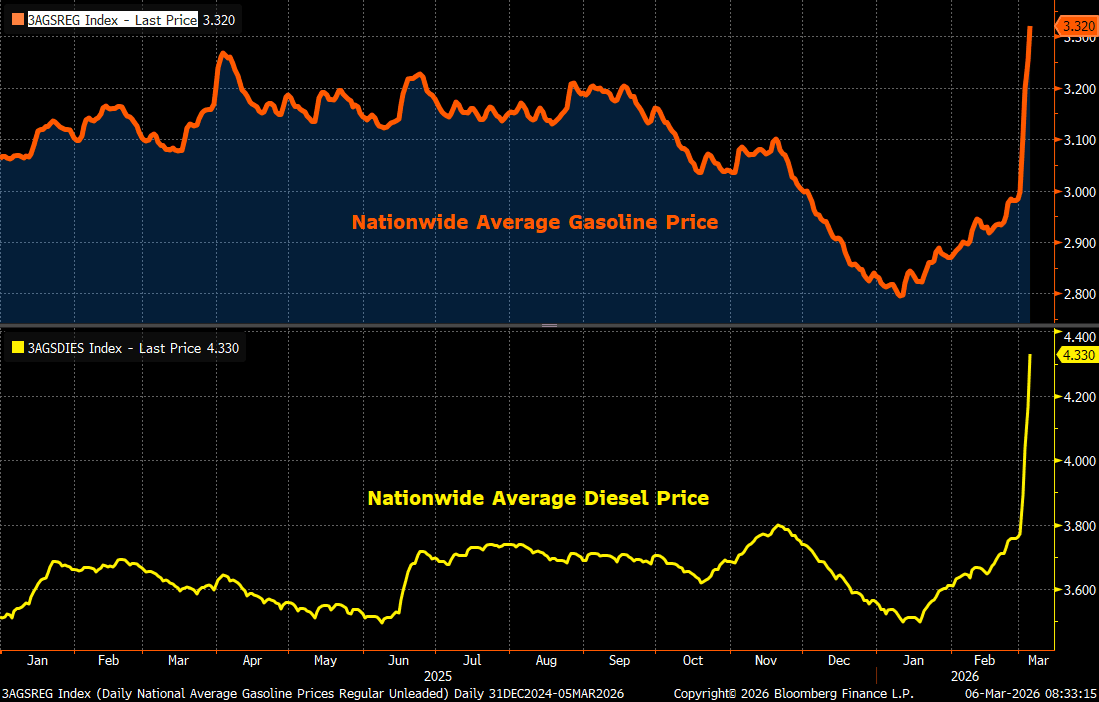
So it’s no surprise that oil is the story this week, and oil prices will ultimately determine whether this conflict becomes an economic problem or just a headline.
WTI crude started the week at $67.27 a barrel. By Friday it was trading above $90. Futures even crossed $100 overnight. That marks the largest weekly gain on record, going all the way back to 1982.
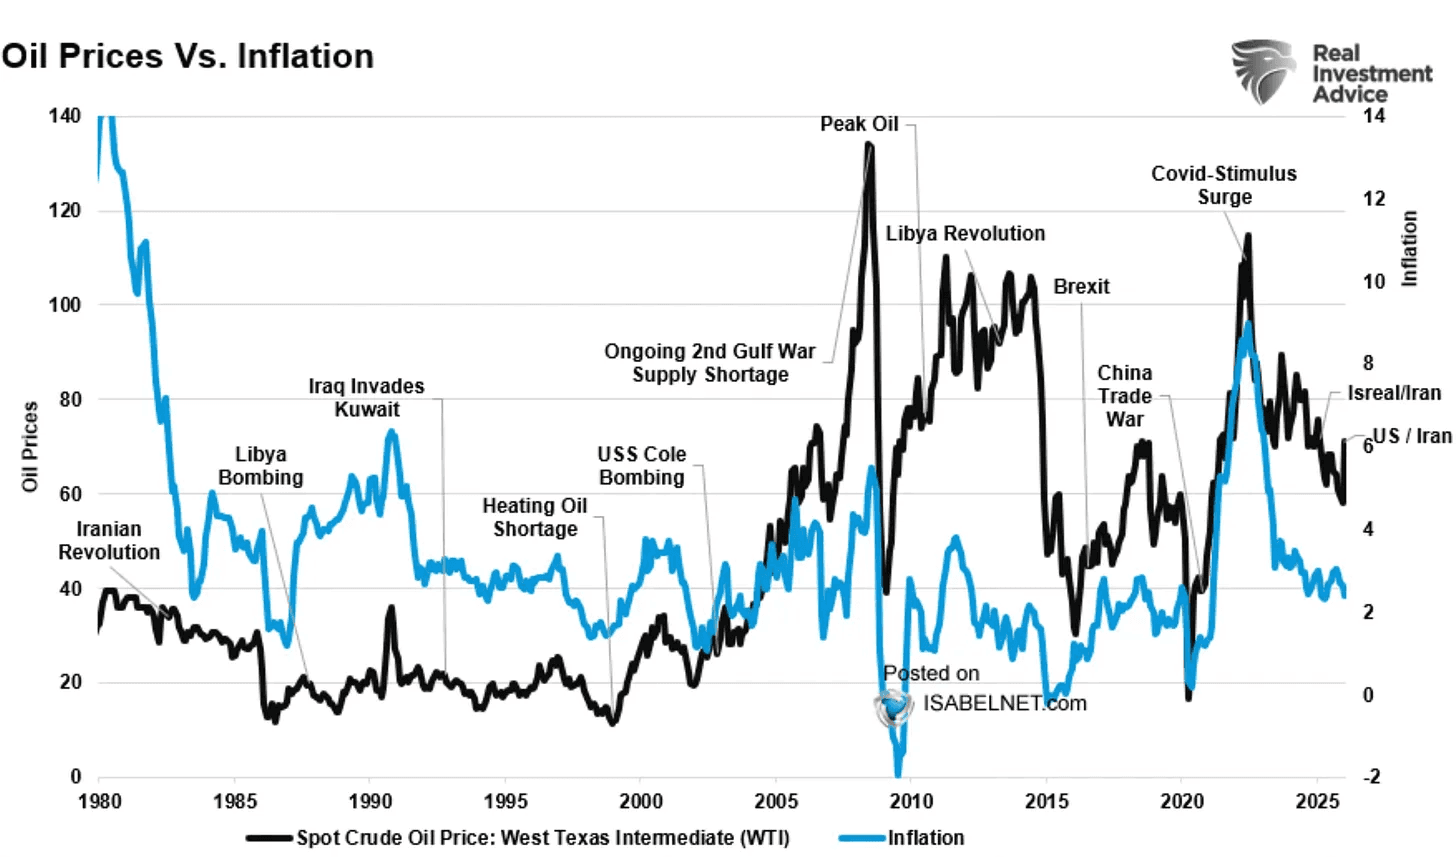
The problem is that every $10 rally in oil prices adds roughly 20 basis points of inflation pressure.
Oil has already surged from $55 to $80, implying roughly 50 basis points of inflation pressure even before this week’s additional spike. At $95 oil, inflation moves to around 3.2%. At $130, it moves closer to 3.9%.
That’s a direct threat to the rate cut timeline markets have been pricing in.
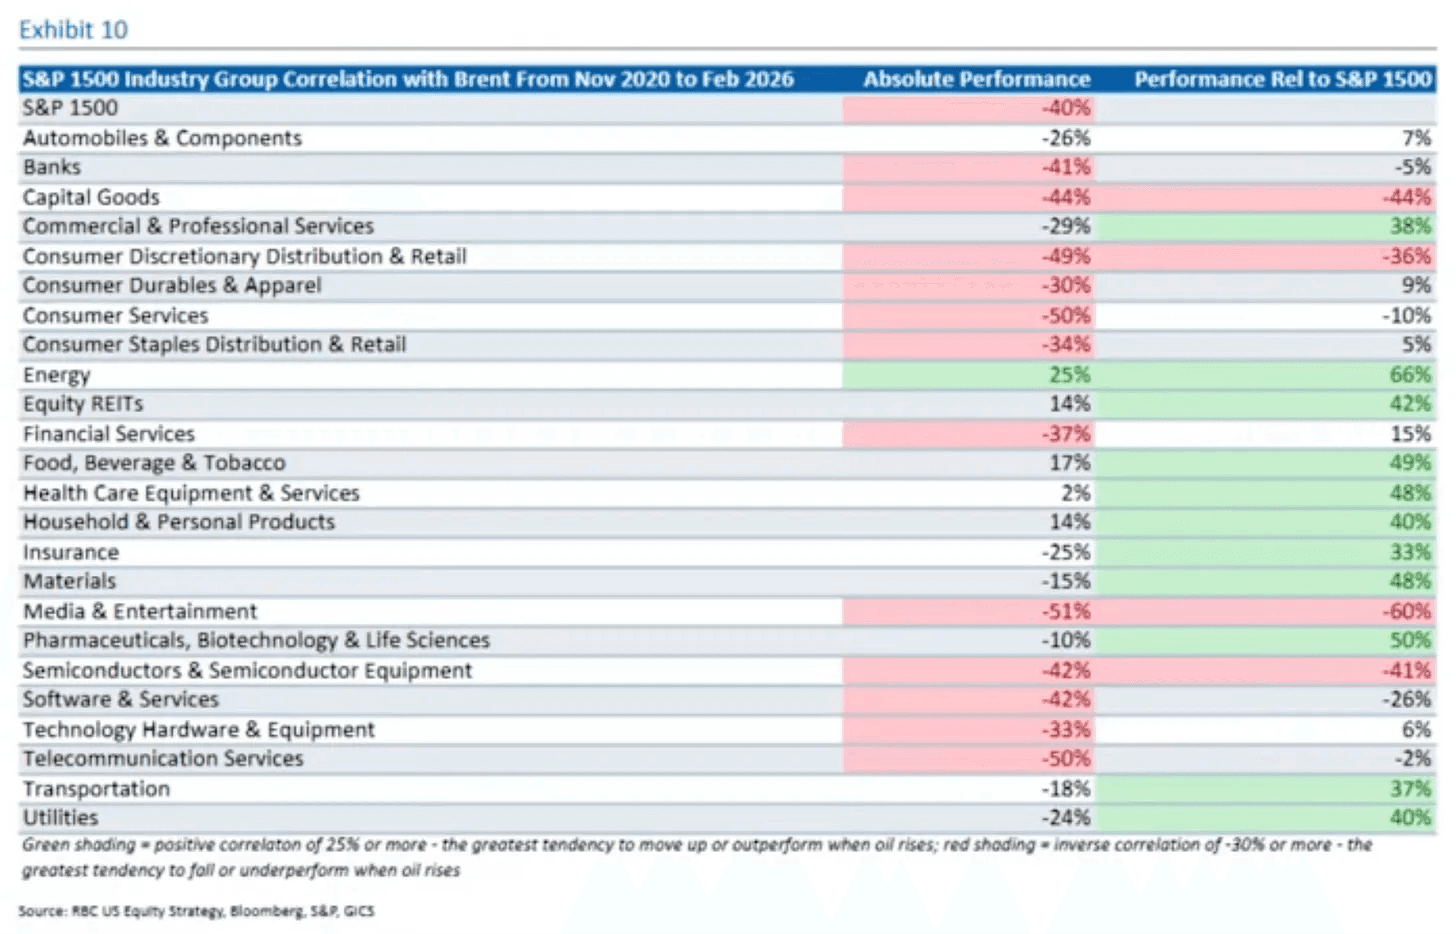
Historically, during oil supply shocks, the best performing industries have been energy, defense, steel, and healthcare. In contrast, sectors that tend to struggle during oil supply shocks are consumer discretionary, airlines and transportation, energy-intensive industrials, retail, and often growth tech stocks.
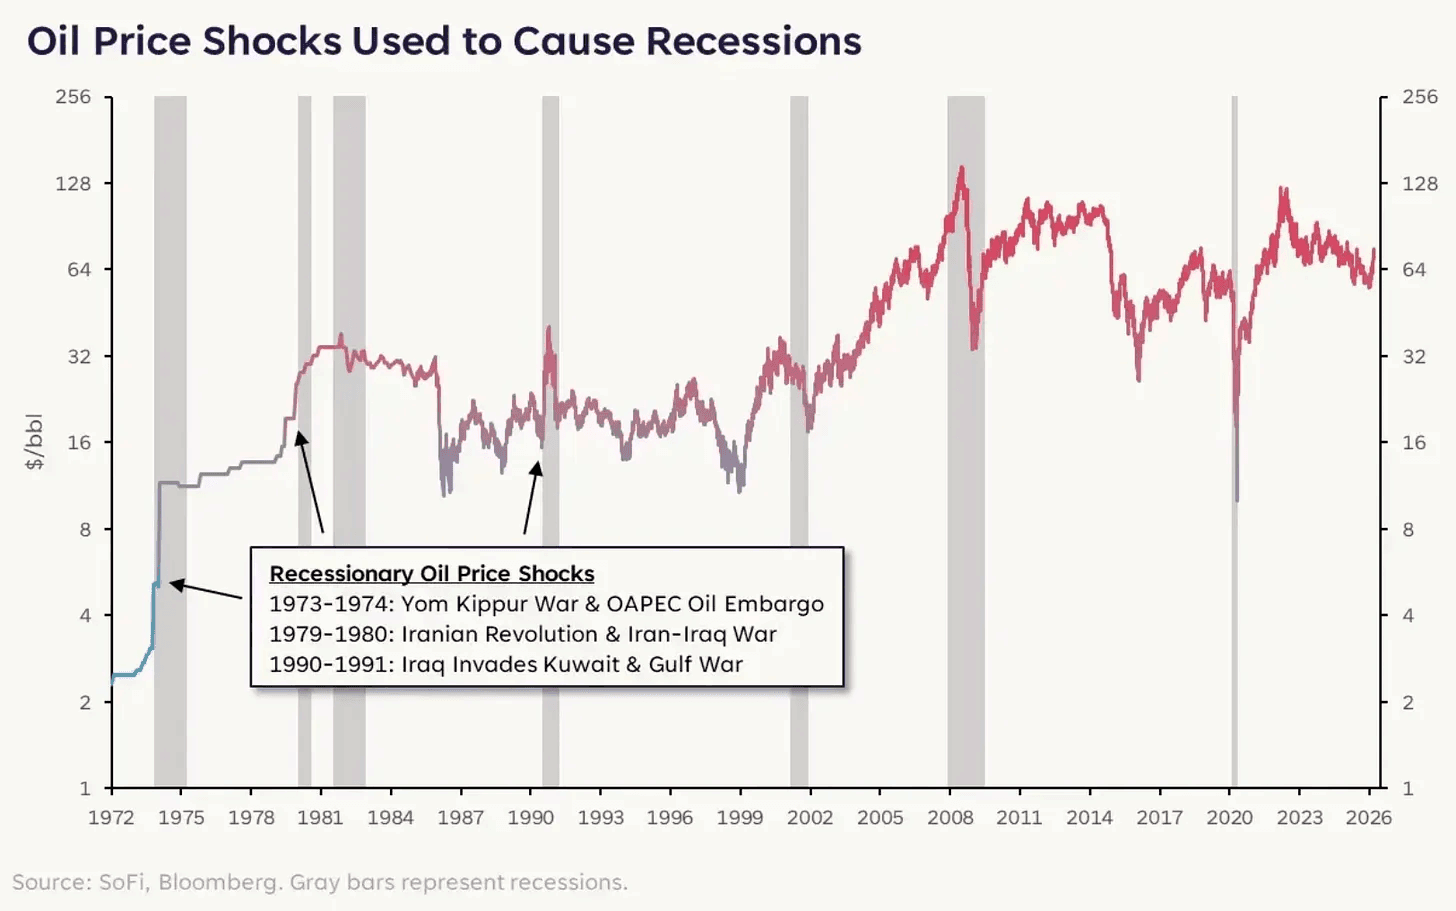
The chart of oil shocks and recessions since 1972 is interesting.
It shows that not every spike in oil leads to a recession. The key difference is how long the increase lasts. Short spikes usually create volatility, but the economy can handle them.
The oil shocks that were followed by recessions were different because prices stayed high for a long time and kept pressure on businesses and consumers. That is when higher energy costs start slowing the economy.
Right now oil has risen sharply, but it is still too early to know if it will become a sustained shock. But it is something to watch closely.
After everything that hit the market this week, it is not surprising that volatility picked up.
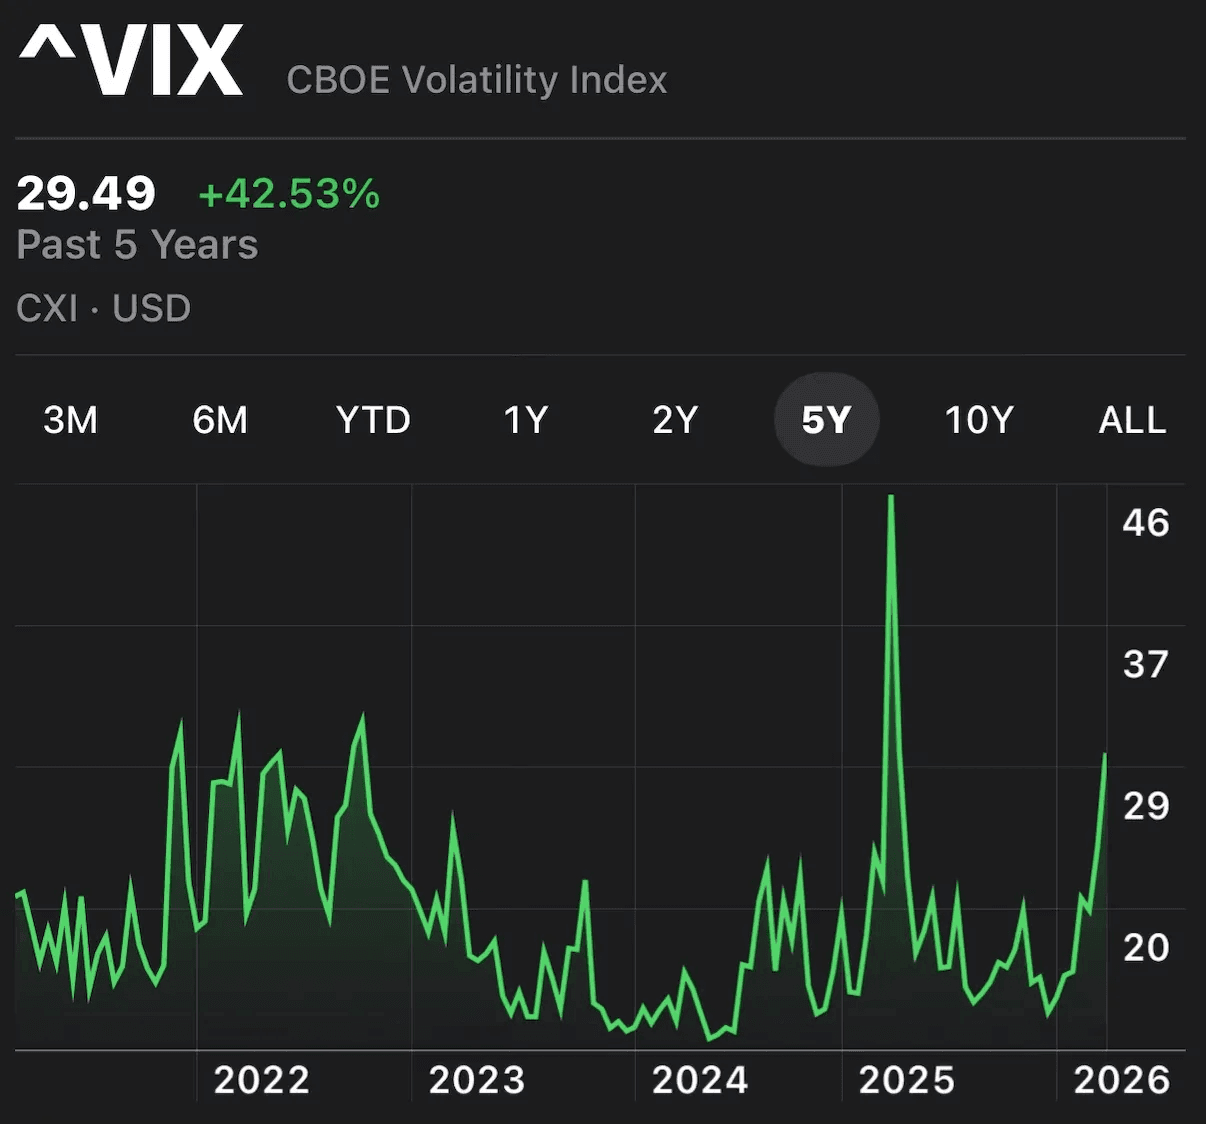
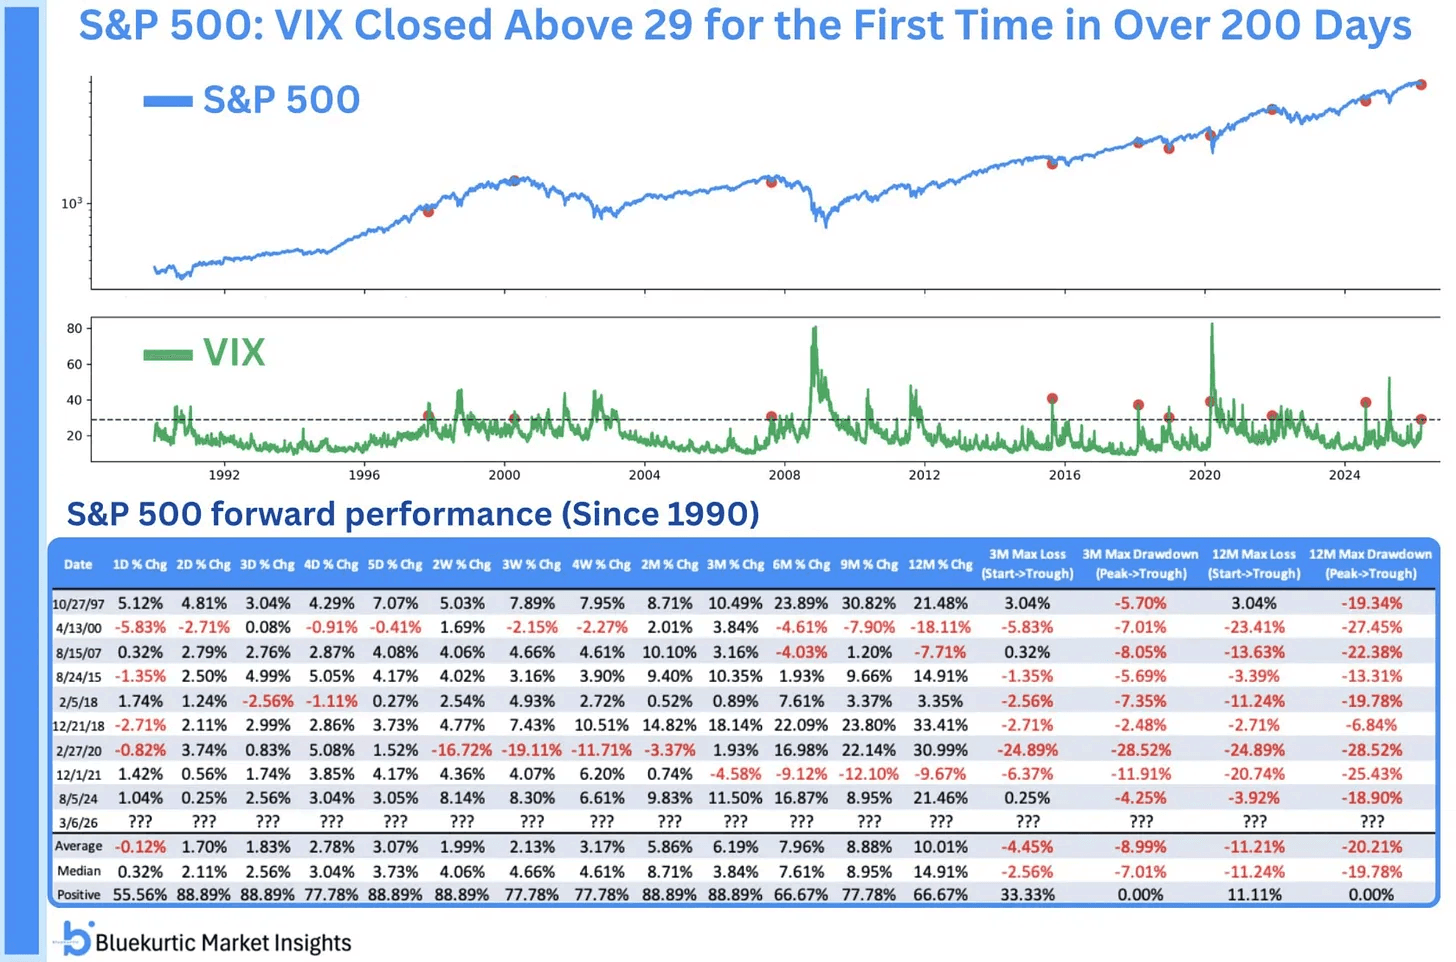
That is exactly what happened. The VIX closed above 29 for the first time in more than 200 days. This is the highest closing level since the tariff shock in April 2025 and one of the higher readings we have seen over the past five years.
A simple way to estimate expected market movement is the Rule of 16.
You take the current level of the VIX and divide it by 16. This gives an estimate of the expected daily move in the S&P 500. For example, if the VIX is around 30, you divide 30 by 16. That gives about 1.87. This means the market is pricing in roughly a 1.87% move up or down every day.
It sounds alarming at first. Past spikes where the VIX moved above 29 have often happened close to short term market lows.
Because extreme spikes in volatility often appear when fear is already very high. By that point, a lot of selling has already happened.
Of course, no signal works every time and there can definitely be more downside ahead. But it’s important to keep this in mind and to be prepared. There will eventually be great opportunities, even if it’s not today.
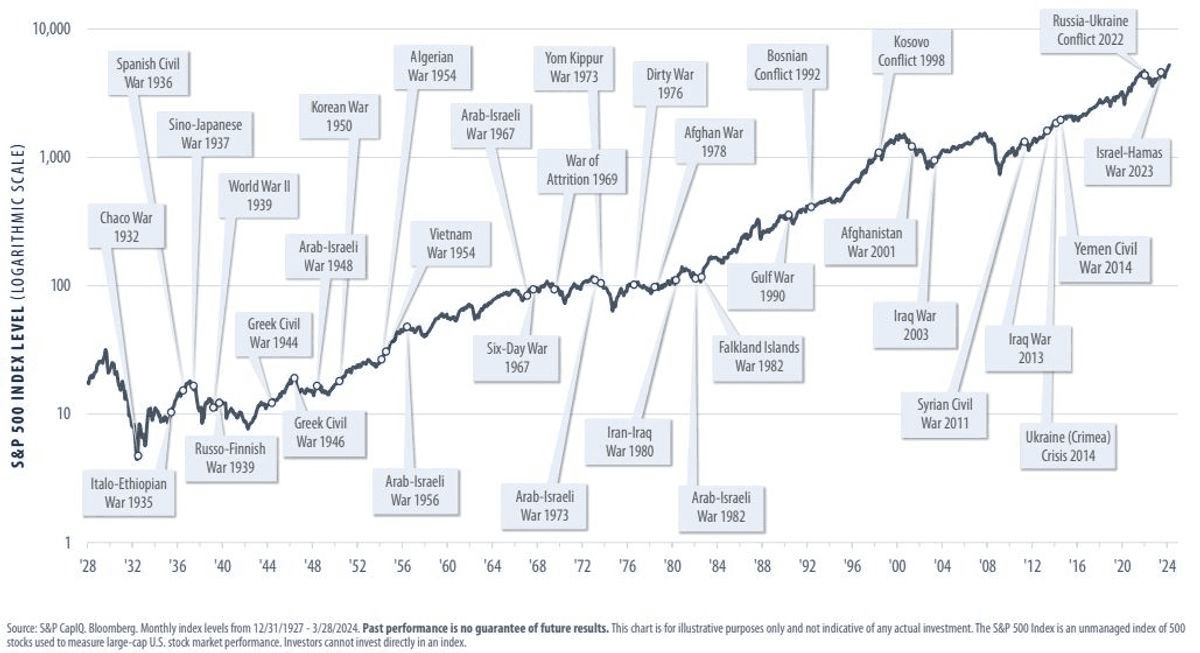
What often gets lost in moments like this is that geopolitical tension, as scary as it sounds, rarely causes a big and lasting hit to corporate earnings. And at the end of the day, that is what markets really care about. Not headlines. Earnings.
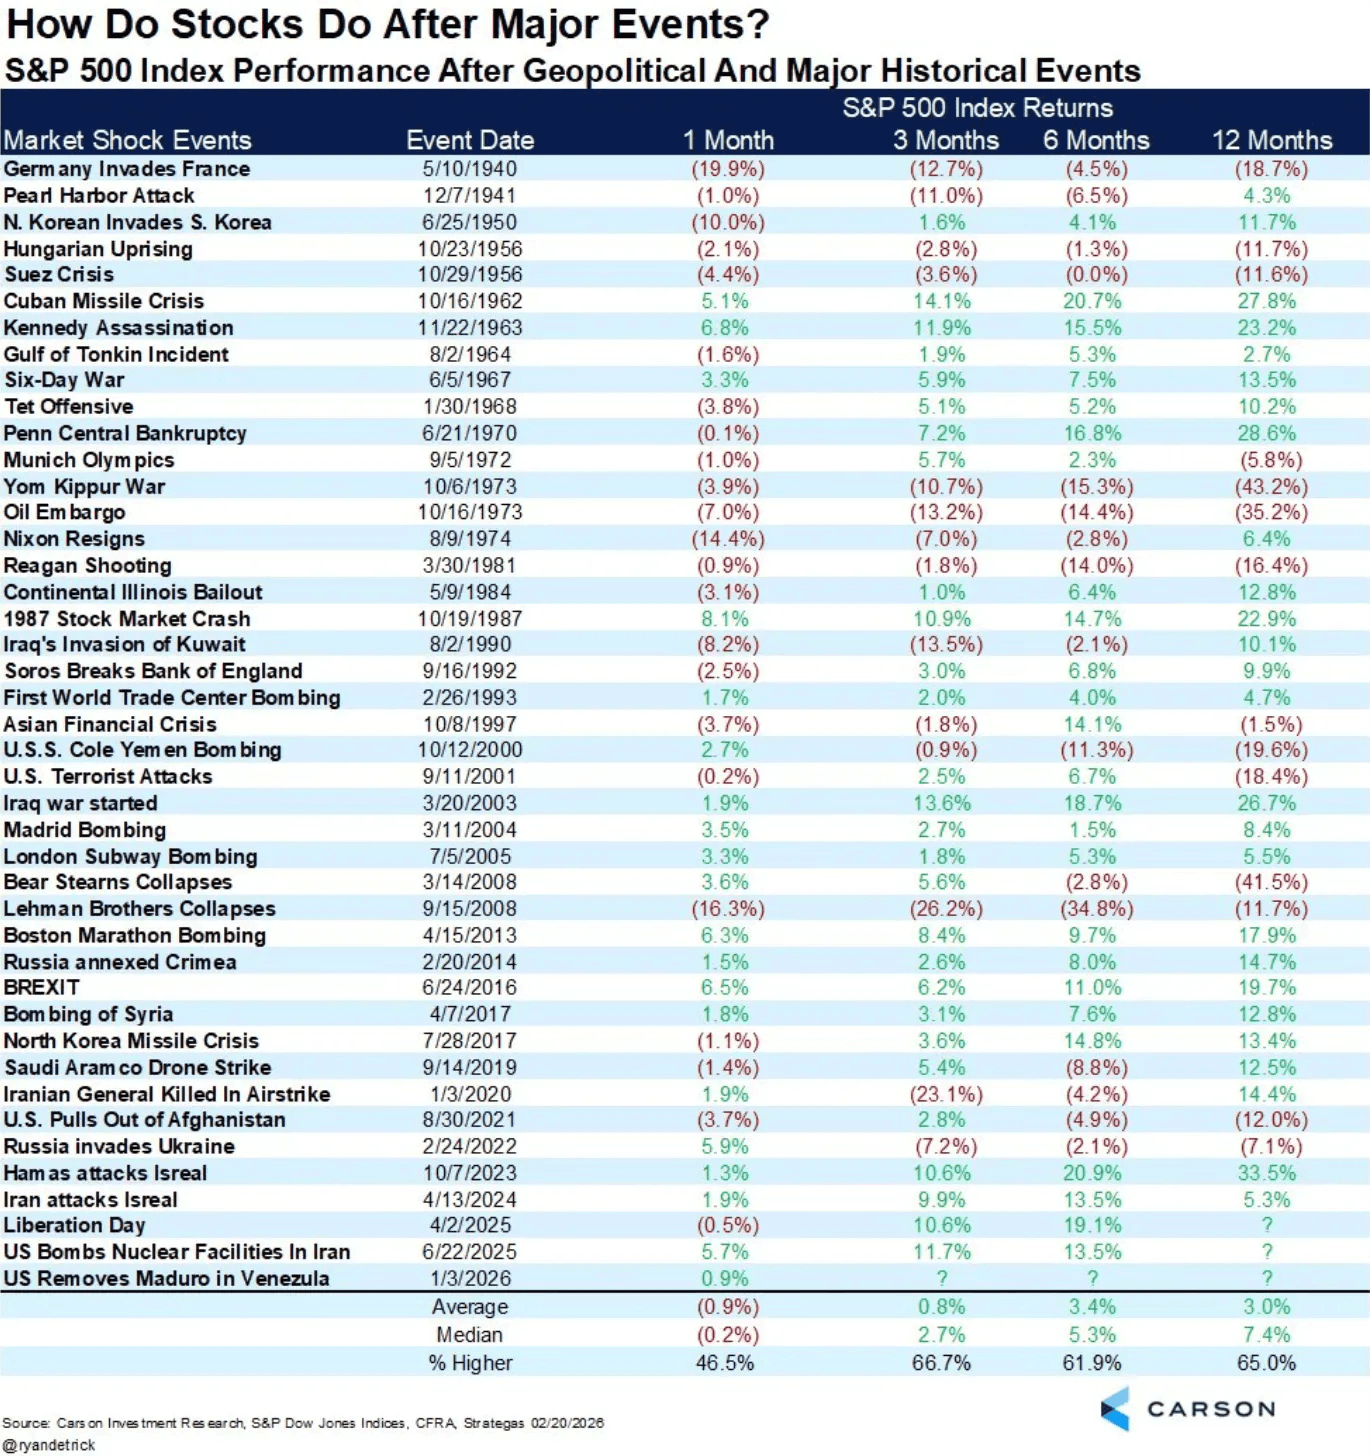
Below is how the S&P 500 performed after major geopolitical events going all the way back to 1940. The short term reaction is often a bit weak. On average, the market is slightly negative one month later.
But if you zoom out, that changes. Over 3, 6, and 12 months the market tends to recover. In fact, one year later the S&P 500 has been higher about 65% of the time, with a median 12 month return of around 7.4%.
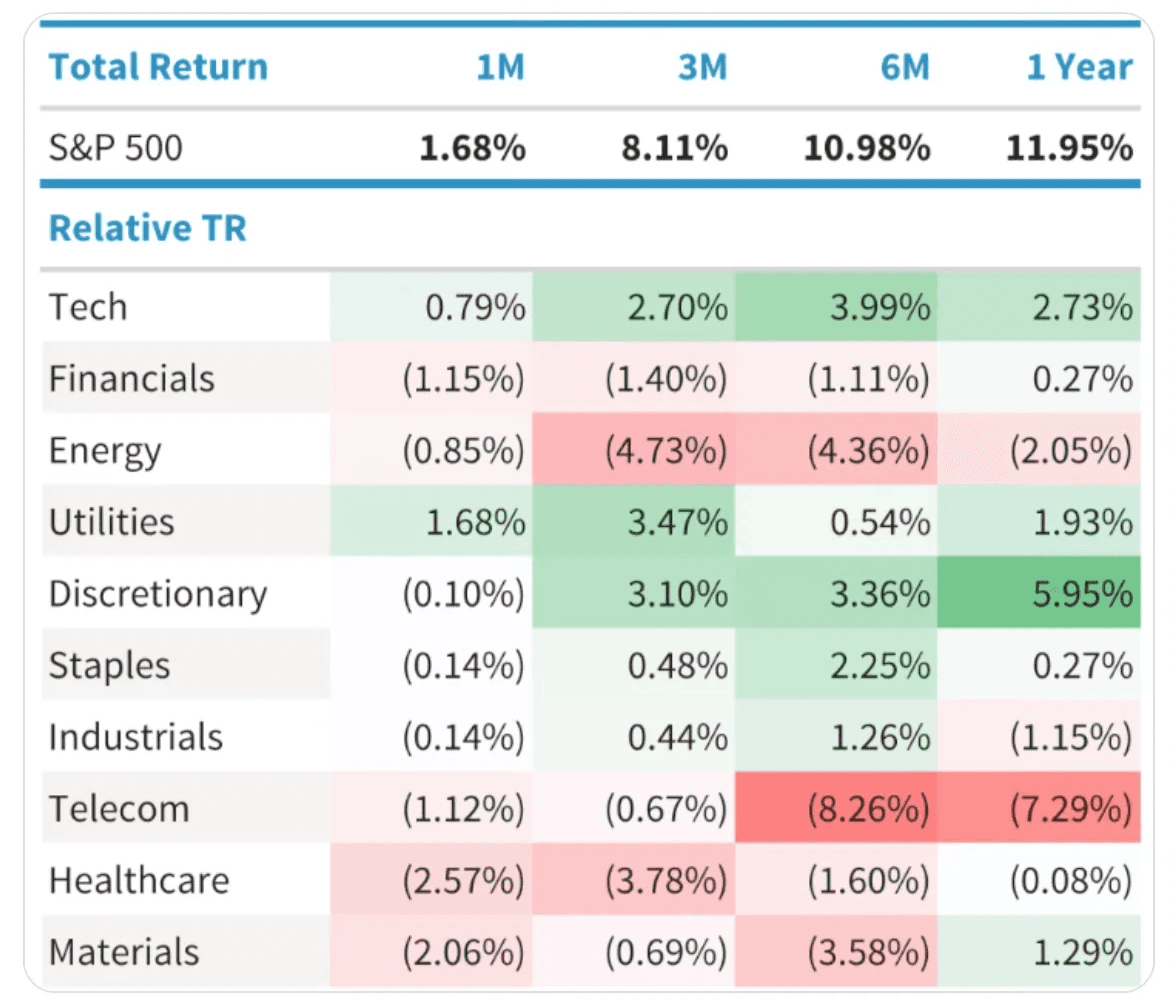
And historically, that instinct has often been right. Looking back to 1990, the sectors that performed best a year after peaks in geopolitical risk were consumer discretionary, tech, and utilities.
That might sound surprising at first. If the world was truly falling apart, you would expect more defensive sectors to lead. But the data often shows the opposite.
Once the initial fear fades, markets tend to refocus on growth, spending, and normal economic activity. That is why sectors tied to consumer demand and technology have often bounced back the strongest after periods of geopolitical stress.
Inflation pressures are also starting to pick up again. The January Core Personal Consumption Expenditures Price Index, one of the Federal Reserve’s key inflation gauges, is already expected to come in hot based on the data released so far. Estimates suggest the year over year pace could reach around 3.2%, which would be the fastest since November 2023. And that number does not yet reflect the recent developments in the Middle East.
Of course, higher inflation and higher interest rates also create challenges for households. This becomes even more important when the labor market looks a bit uncertain and finding a new job is not easy if someone loses their current one. That kind of environment can weigh on consumer sentiment and make people feel less confident about the economy.
Even without the recent tensions in the Middle East, the macro picture for 2026 was already somewhat complicated. Inflation is still running above 3%, which is higher than the Federal Reserve would prefer. At the same time, the rapid buildout of AI infrastructure is creating supply bottlenecks in areas like memory chips. Shortages could add pressure to prices for everything from computers and electronics to cars.
Taken together, those factors alone would already make it harder for the Fed to justify cutting interest rates aggressively this year. The labor market remains an important variable. It weakened during the middle of 2025 but has stabilized more recently. That said, stabilization does not necessarily mean strength. It is also worth remembering that the Fed already cut rates by 0.75 percentage points in the fourth quarter of last year to support employment.
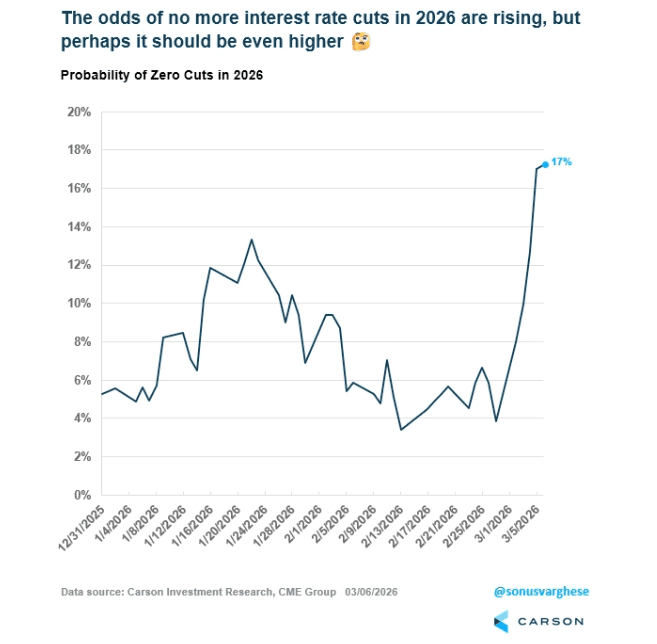
The chance that the Fed makes no additional cuts at all this year has risen from below 5% last week to more than 17% now. And the odds could be even higher depending on how inflation and energy prices evolve.
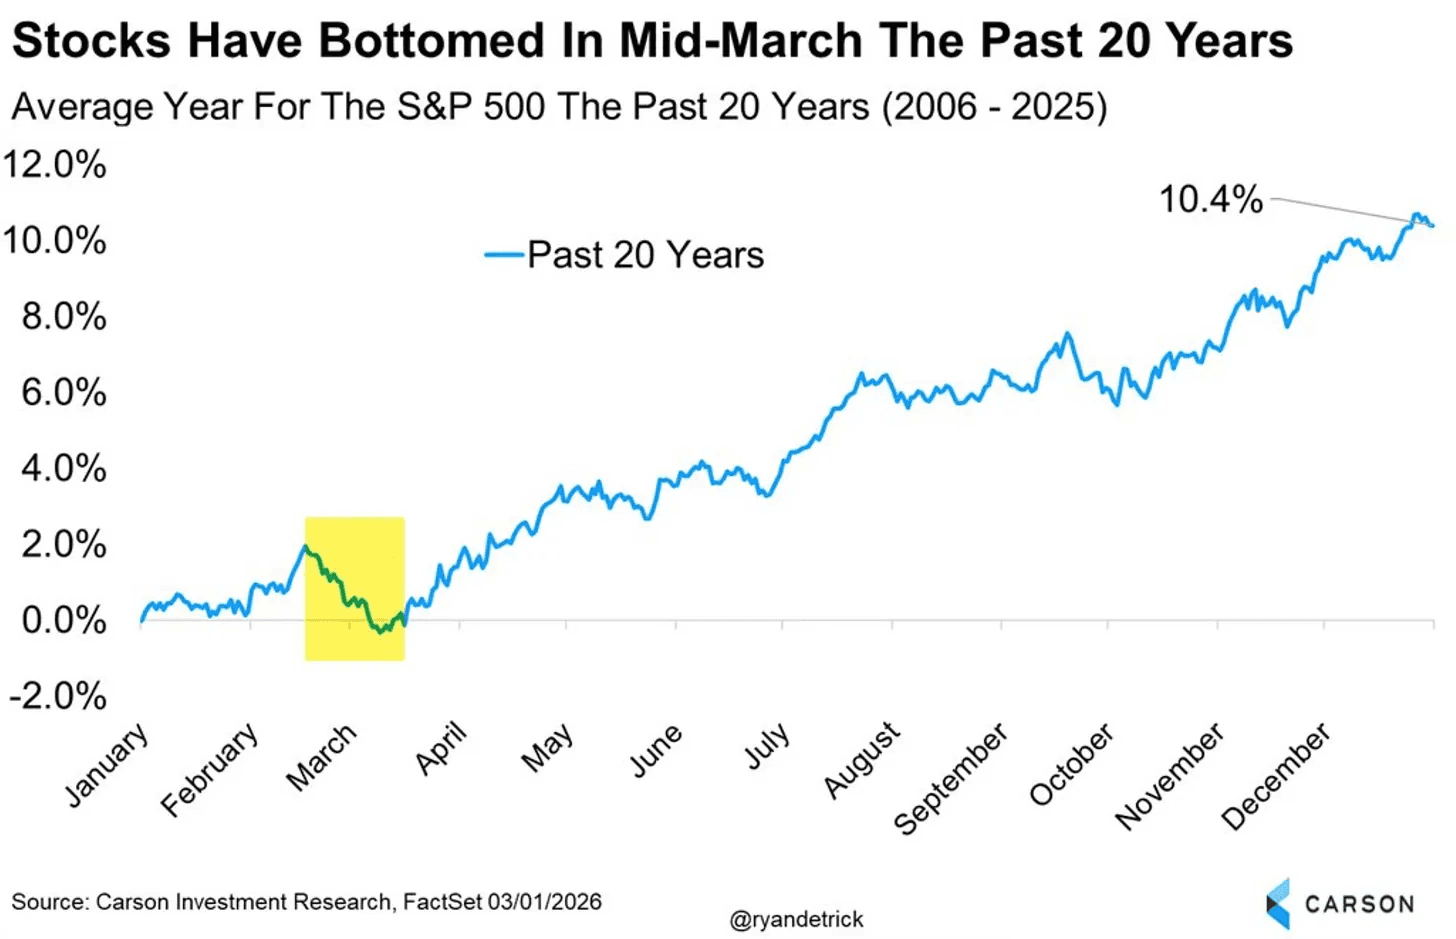
And to top things off, over the past 20 years, late February into late March has not been favorable. In many years the market tends to form a short term low around that time before stabilizing again.
Mid March has frequently marked the bottom of the average year going back to 2006. While years like 2009 and 2020 are included in that data, the pattern shows up often enough to at least keep in mind.
Right now the market is dealing with a lot at once. War. Inflation. AI fears. Volatility. There is a reason why being defensive has been the main priority over the last few weeks and months.
You do not need to predict the exact bottom. Nobody can do that consistently. What you can do is manage your risk and adjust your exposure according to the market condition.
There is no doubt in my mind that there will be tremendous opportunities coming out of this. But nobody knows how far it will go or how long it will last.
The key is to be prepared and keep drawdowns and risk exposure contained.
That means staying calm and not doing anything stupid when markets get messy. In times like these, it is easy to panic, fall for FOMO, or make emotional decisions. Most mistakes happen exactly in those moments.
Markets always go through phases like this. TBut those periods are also when the next big opportunities start to evolve.
Previous Updates
View All
- Weekly Market Update: Earnings Season Is Here
- Market Update: The FinTech Comeback
- Weekly Market Update: Halftime
- Market Update: The Robots Are Coming
- Weekly Market Update: The Broadening
- Market Update: The Break Point
- Weekly Market Update: Patience
- Market Update: The Memory Crunch
- Weekly Market Update: The First Trillionaire
- Market Update: In Focus
- Weekly Market Update: Deleveraging
- Market Update: A Change of Character
- Market Update: The Next Quantum Leap