Go Back

Lin
The Magic of Moving Averages
Moving averages are the foundation for almost every investment decision I make. They have been part of my core process for more than a decade. They are one of the most common indicators in the world for a reason. They are an incredible simple, reliable, and effective guide through all kinds of market conditions. That’s why you’re seeing them everywhere on here.
I use moving averages to decide how aggressive to be with my portfolio, which stocks to buy or short, how strong a trend really is, and even which news events are worth paying attention to. They carry more importance than headlines, economic data, or even earnings reports. If I were starting over as a beginner looking to build my net worth, learning how to use moving averages would be my number one priority. They simplify the noise of the market and turn complex price action into something you can actually understand and act on.
Moving averages are valuable for every investment style, whether you are a day trader, swing trader, or a long-term investor. They help you see whether buyers or sellers are in control, whether a pullback is healthy or a sign that the trend is breaking, and whether a breakout is sustainable or extended. I always want to own stocks that are “surfing” their moving averages because it means they are in sync with the trend.
My personal setup includes four moving averages:
10 SMA/EMA: very short-term trend
20 SMA/EMA: short term trend
50 SMA: intermediate trend
200 SMA: long-term trend
The 10-day and 20-day SMAs react quickly to price movements and help me track short- to medium-term momentum. They change direction fast enough to alert me early when the character of a trend begins to shift, which is useful for entries, exits, and managing risk.
The 50-day and 200-day SMAs represent the bigger picture. These are levels that institutions watch closely. They often act as major areas of support or resistance. A stock trading above both of these rising averages is usually in a strong structural trend, while a break below them often signals deeper weakness. Together, these four averages help me see both the short-term momentum and the long-term foundation of a stock’s move.
The difference between an EMA and an SMA is in how they treat recent prices. The EMA gives more weight to the most recent data, so it reacts faster to changes. The SMA treats all past prices equally, creating a smoother picture of the overall trend. EMAs are more sensitive to recent price action, giving me an earlier read on near-term momentum while preserving perspective on long-term trends. That is why I use EMAs for short-term movement and SMAs for the broader structure.
Moving averages are also a key part of risk management.
No matter if you’re a long-term or short-term investor, you should only take new long positions when a stock is trading above its 200-day SMA. That way you automatically filter out weak names and limit exposure to downtrends. If a bullish breakout forms while the stock is below its 200-day SMA, I usually skip it because the odds are against me. This simple rule will save you a lot of money and headaches. Conversely, if the breakout occurs above the 200-day SMA, that often signals a potential turnaround and a shift in the long-term trend.
So, to make this more visual here are few current examples:
Netflix ($NFLX)

Hims & Hers ($HIMS)

ServiceNow ($NOW)

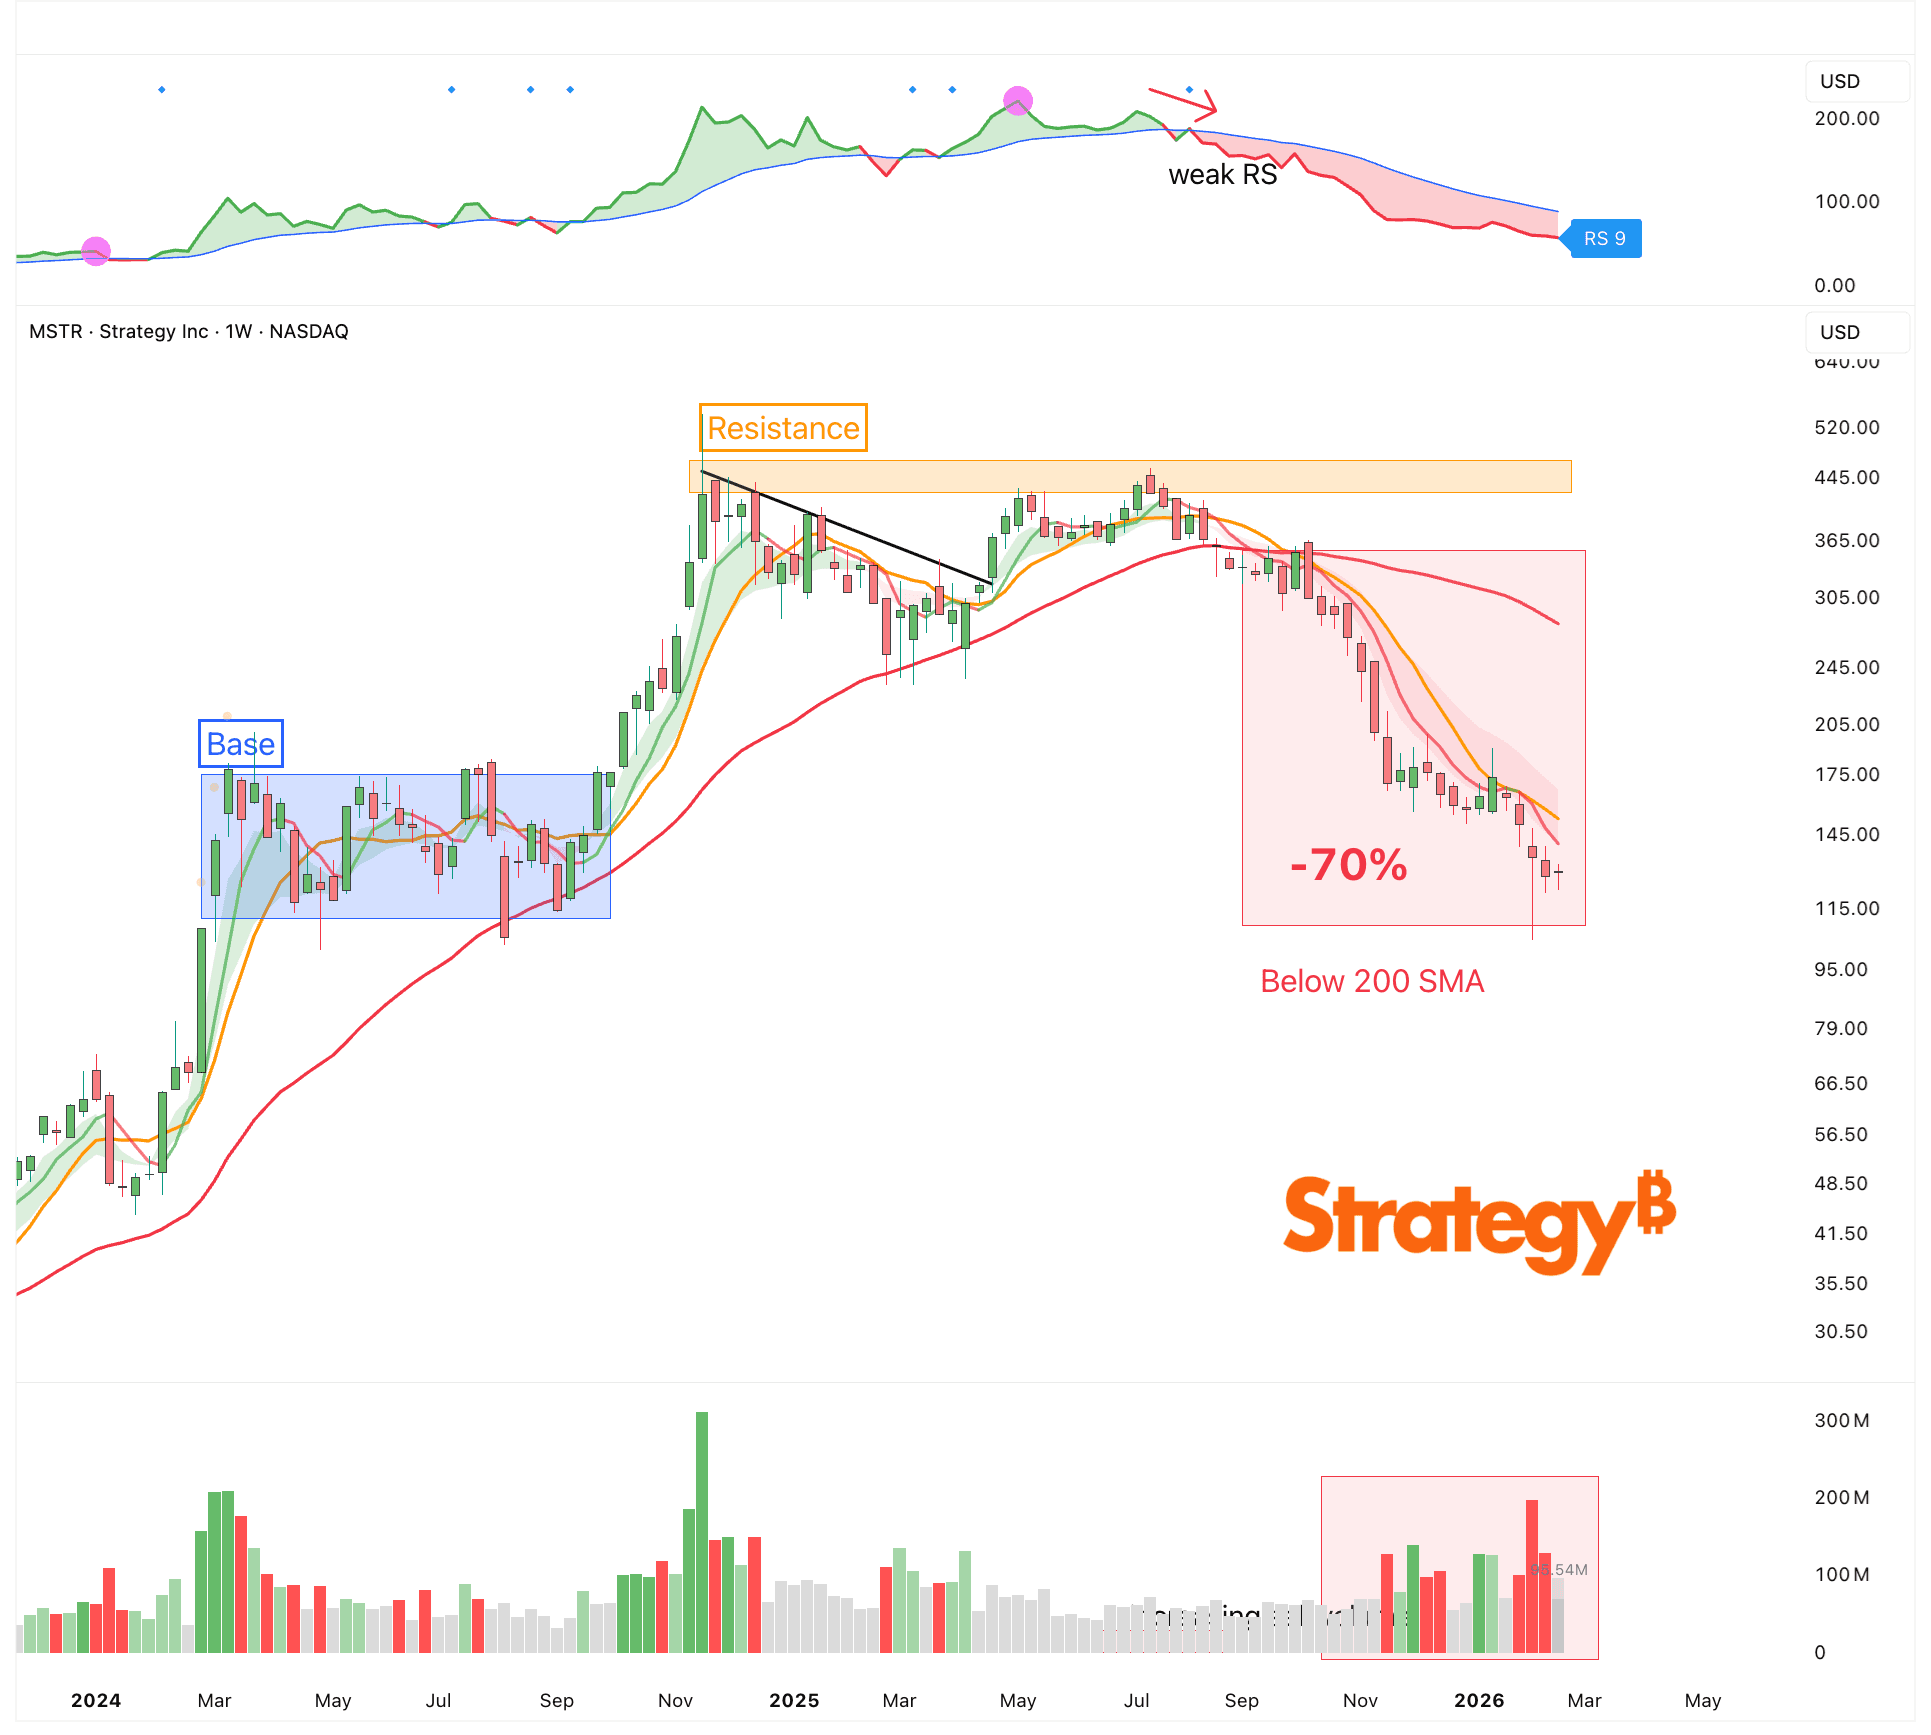
Strategy ($MSTR)
Bitcoin
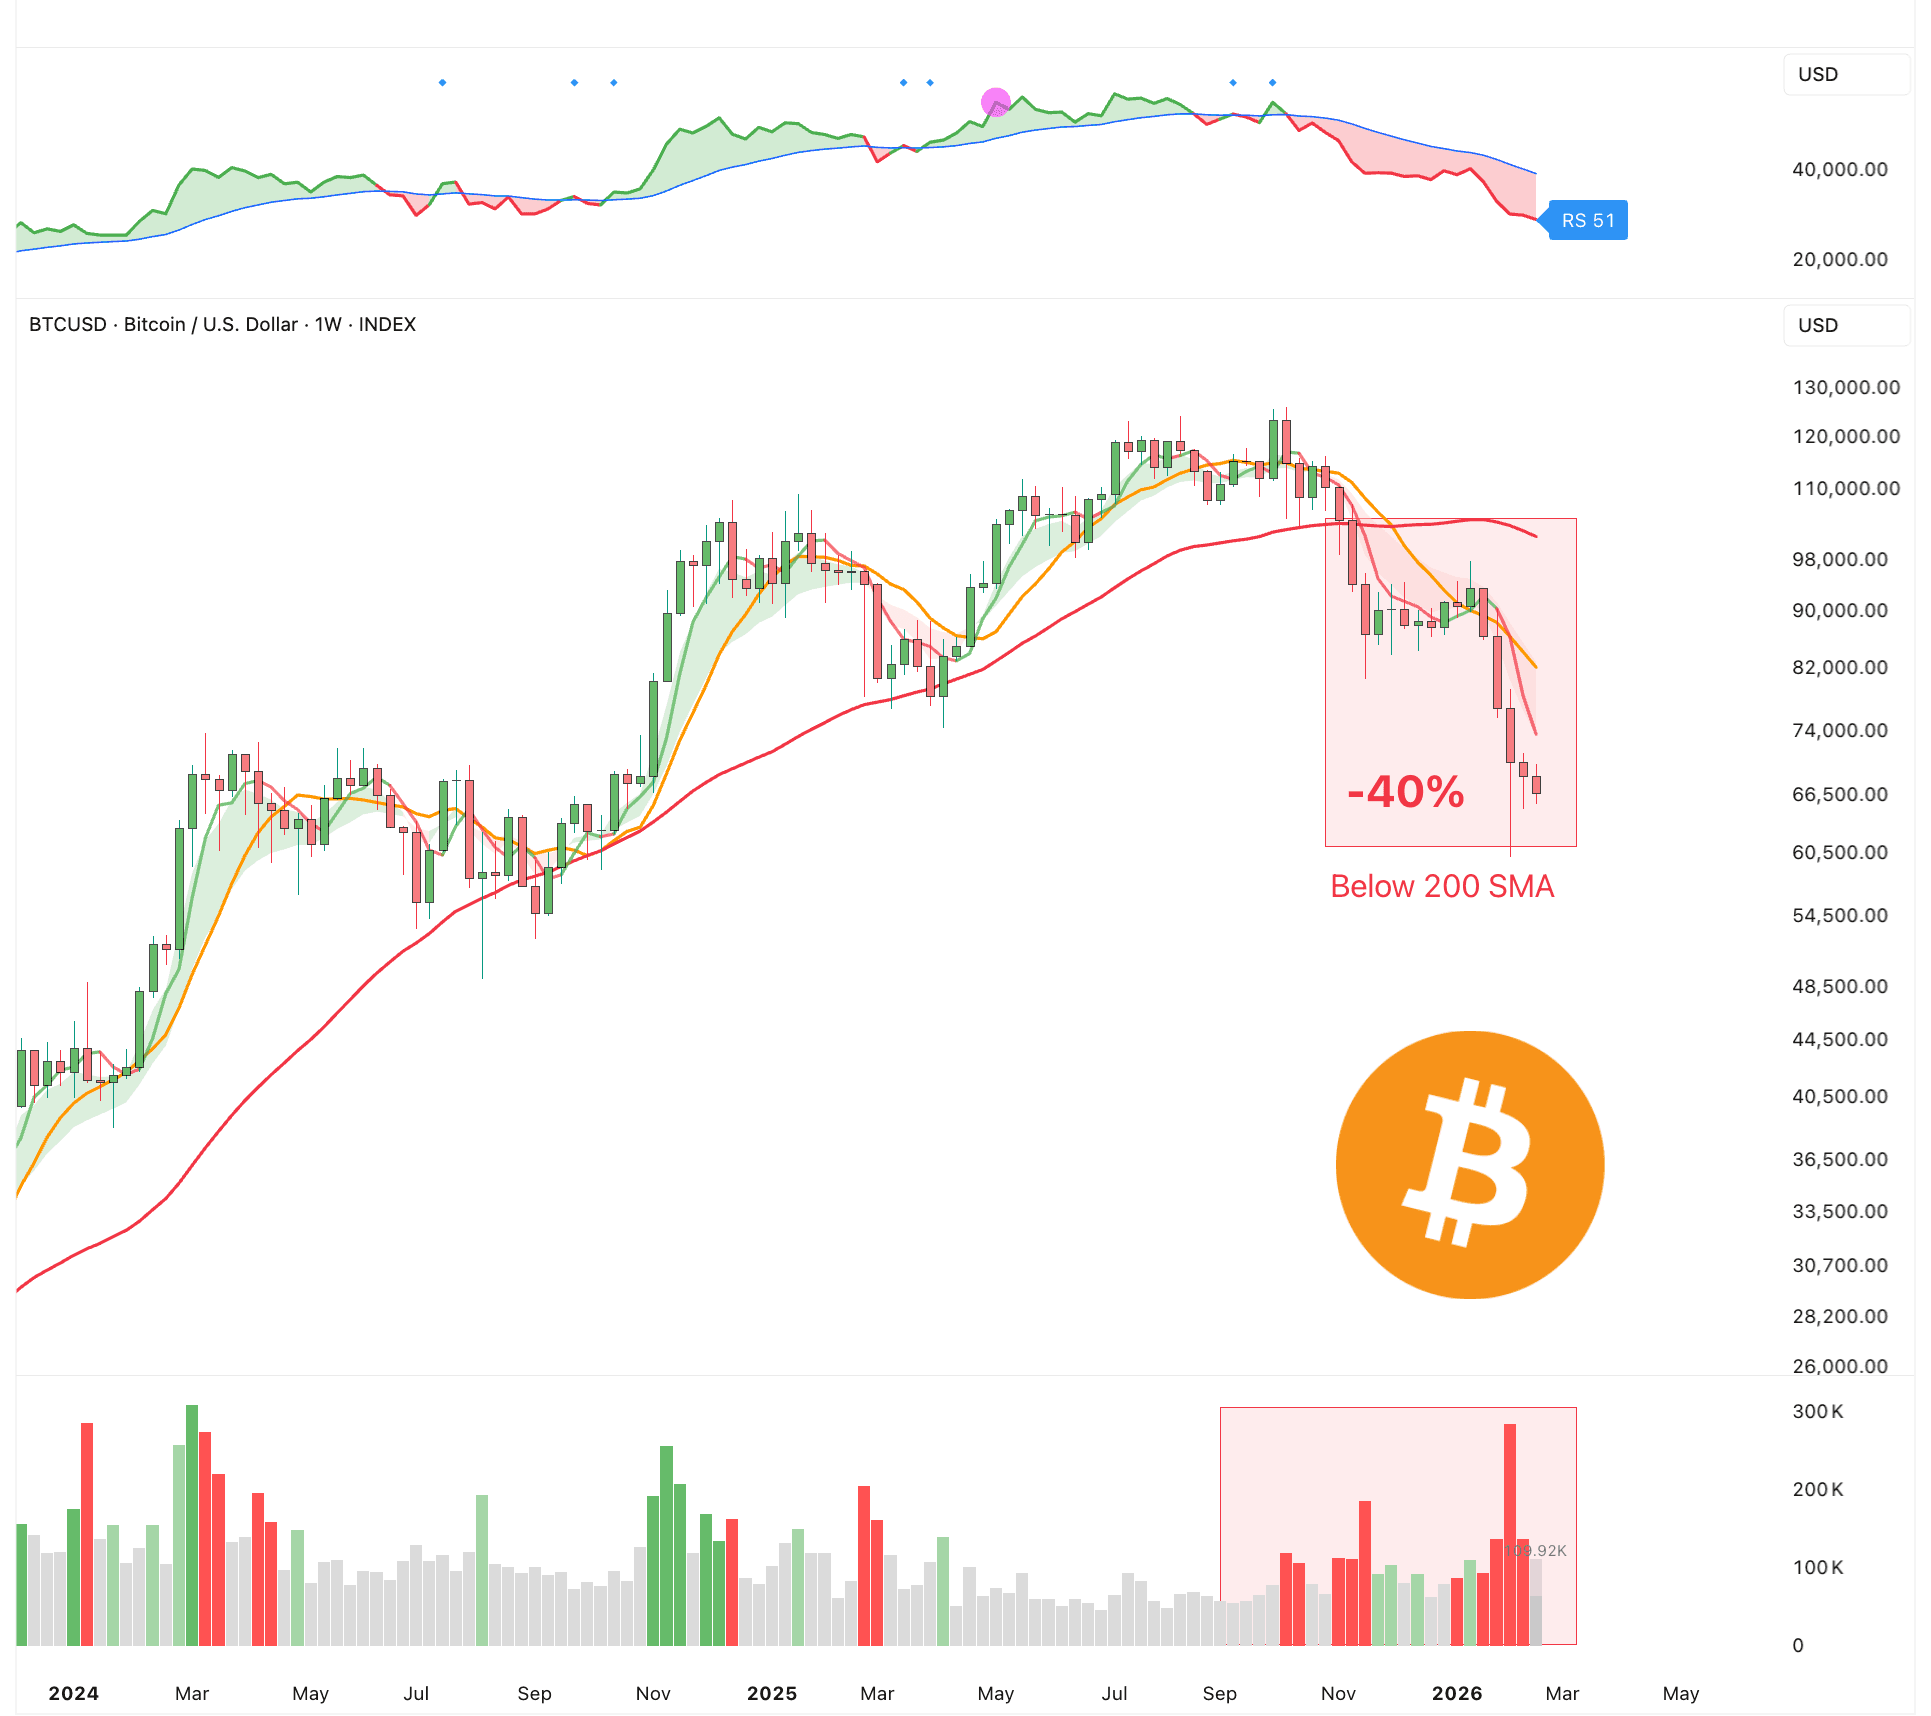
That’s why you should avoid stocks or assets that are below their 200-day SMA if you’re thinking about buying a new position. The odds are against you. It’s much easier to make progress when everything is aligned in your favor. Ideally, all the moving averages are stacked on top of each other and pointing up. Sometimes less is more, and keeping it simple is best.
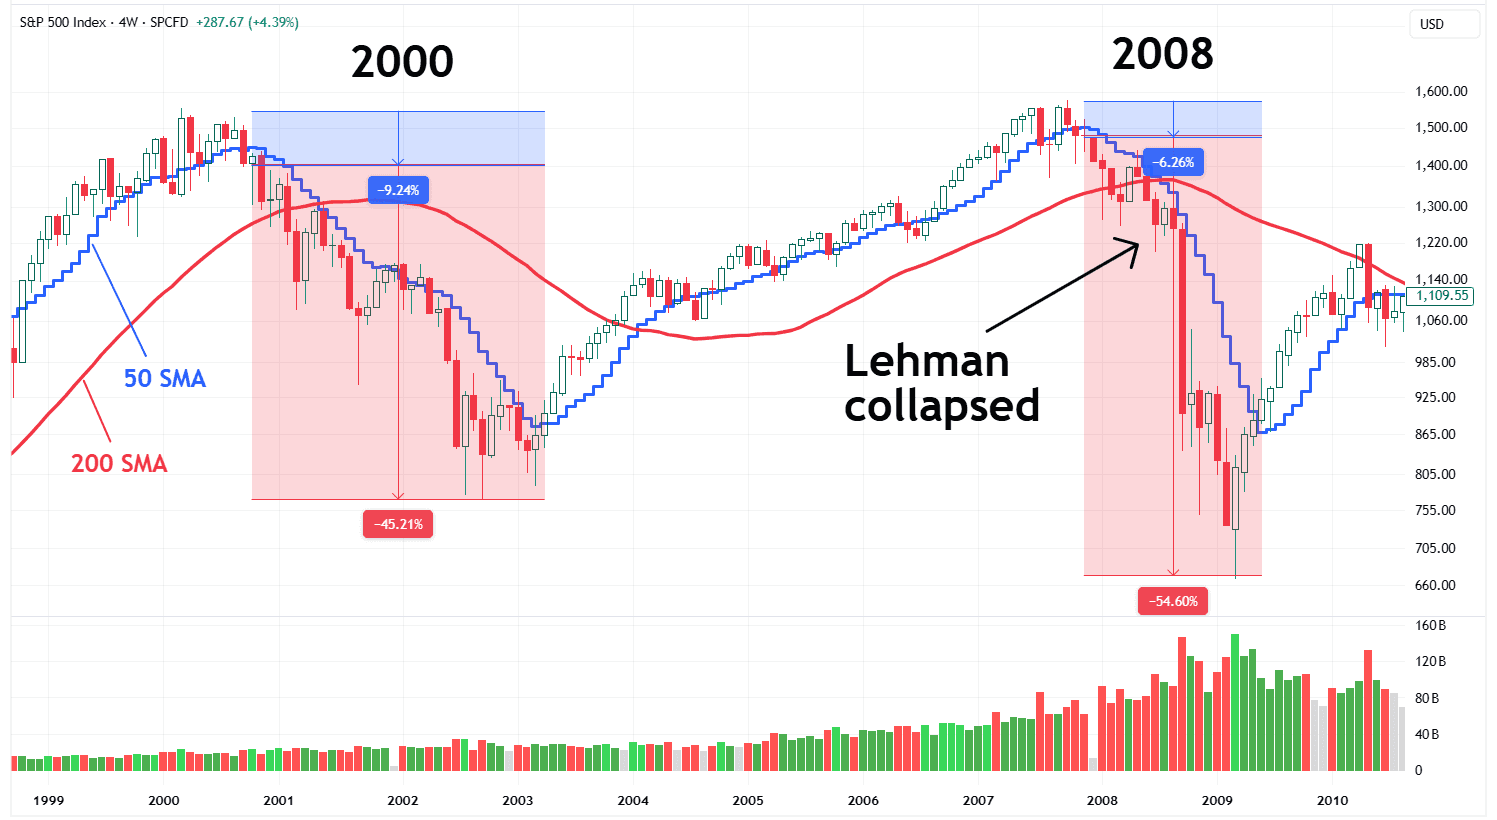
This also works for the general indices.
The most dangerous markets are when the index is below the 200-day SMA. If we look at the crashes in 2000 and 2008, you’ll see that most of the drawdown happened below the 50-day SMA and, more importantly, the 200-day SMA. You could have avoided most of the crash simply by getting out once the market fell below its 200-day SMA. It’s really that simple.
Now, of course, sometimes the market will briefly touch or close below the 200-day SMA and then move right back up. That will happen. There will be false signals. No indicator is perfect. But if it continues to stay below a key moving average, you know something is not quite right.
Many investors dismiss moving averages, saying they “don’t work” because everyone can see them. But moving averages are not meant to be a secret signal or a standalone strategy. They are a tool for context and decision-making. I do not buy or sell solely because of a moving average, but they shape almost every choice I make.
Previous Updates
View All
- Weekly Market Update: All Eyes On the Mag 7
- Weekly Market Update: Earnings Season Is Here
- Market Update: The FinTech Comeback
- Weekly Market Update: Halftime
- Market Update: The Robots Are Coming
- Weekly Market Update: The Broadening
- Market Update: The Break Point
- Weekly Market Update: Patience
- Market Update: The Memory Crunch
- Weekly Market Update: The First Trillionaire
- Market Update: In Focus
- Weekly Market Update: Deleveraging
- Market Update: A Change of Character