Go Back

Lin
Weekly Market Update: An Unusual Market II
The markets are closed today for Presidents' Day.
And when the market reopens tomorrow there will be a flood of delayed economic data like Q4 GDP, housing data, and inflation, from last year's government shutdown. So, it might be a shorter week but it certainly won’t be boring.
But before moving to the week ahead let’s recap last week.
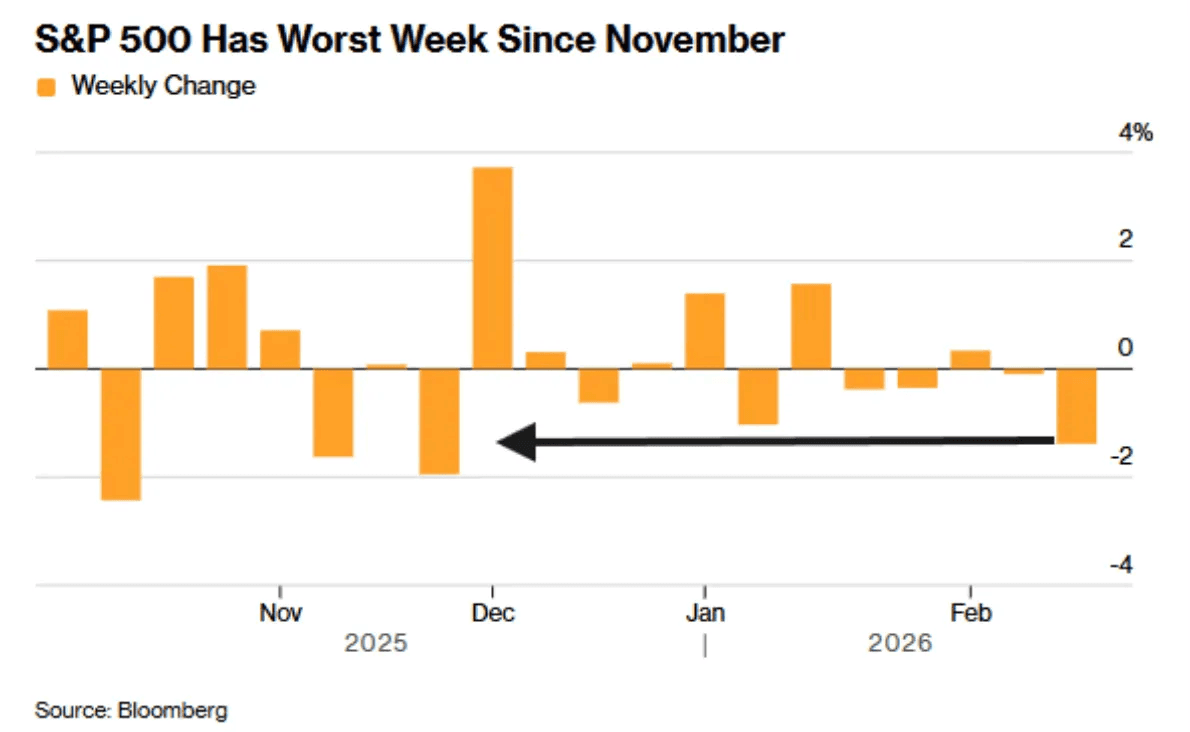
It’s been another weak week for the markets especially for tech stocks. The Nasdaq fell 2.1% for the week, followed by the S&P 500 down 1.4% and the Dow losing 1.2%.
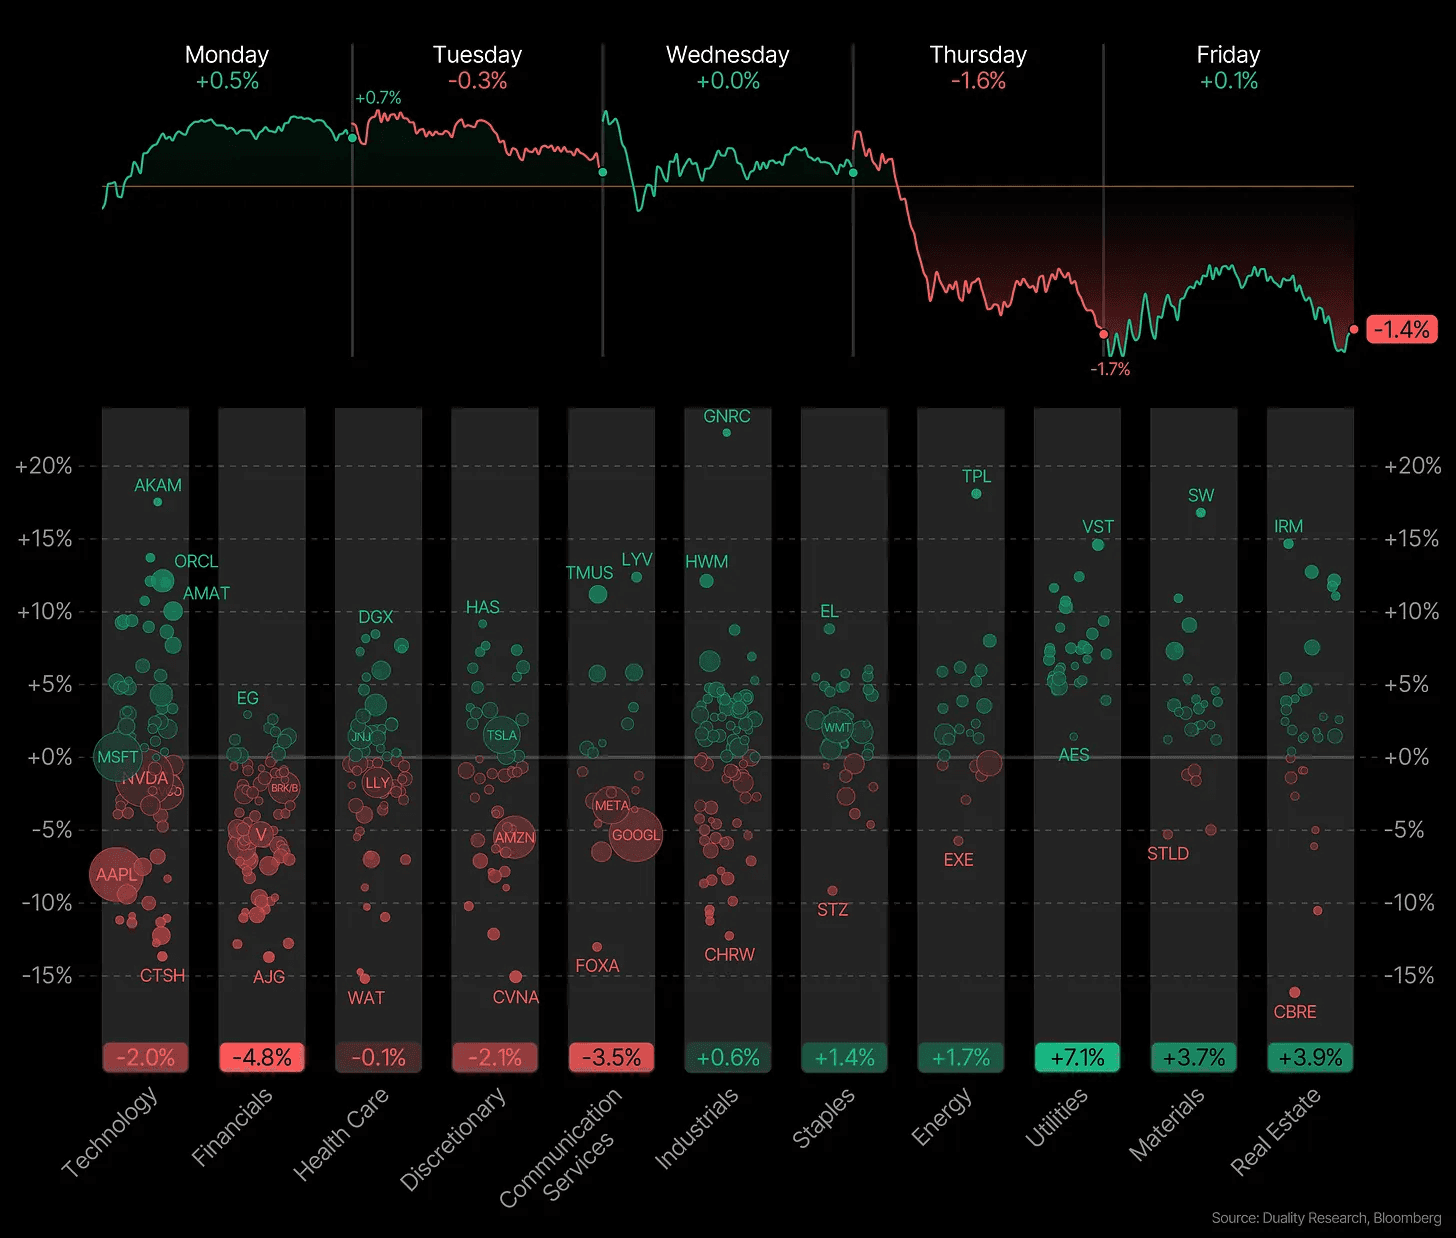
Interestingly, this was the worst week for the S&P 500 since November. Yet the index has been surprisingly calm. We haven’t seen a 2% weekly move in either direction for months. Consolidation periods like this are often followed by a large move. It’s like a spring being coiled, waiting to be released. But we’ll only know in hindsight which direction it will go.
Perhaps the most concerning part is what’s happening beneath the market’s seemingly stable surface.
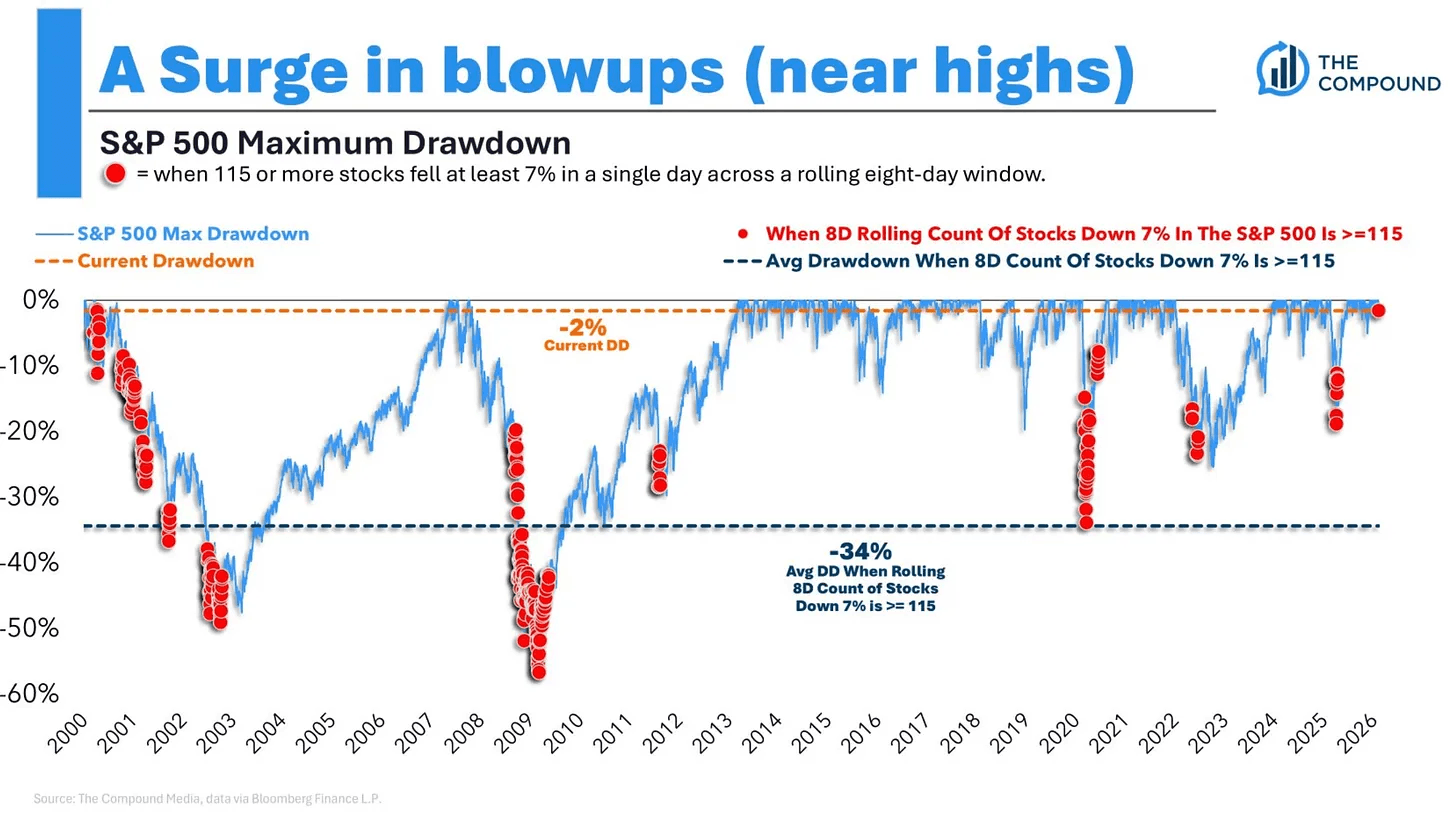
Over the last 8 sessions, 115 stocks in the S&P 500 have declined 7% or more in a single day. We haven’t seen anything like this since the dotcom bubble burst.
Historically, when this happens, the average drawdown is around 34%. Right now, the market is only 1.5% below all time highs. This type of action usually shows up during bear markets or crashes, not near all time highs.
This is definitely unusual.
There are two possible scenarios that could play out here:
Scenario 1
First, the carnage in individual stocks and certain sectors is enough to remove excess leverage from the market, and the market then continues to consolidate until it starts to recover and push the index higher.
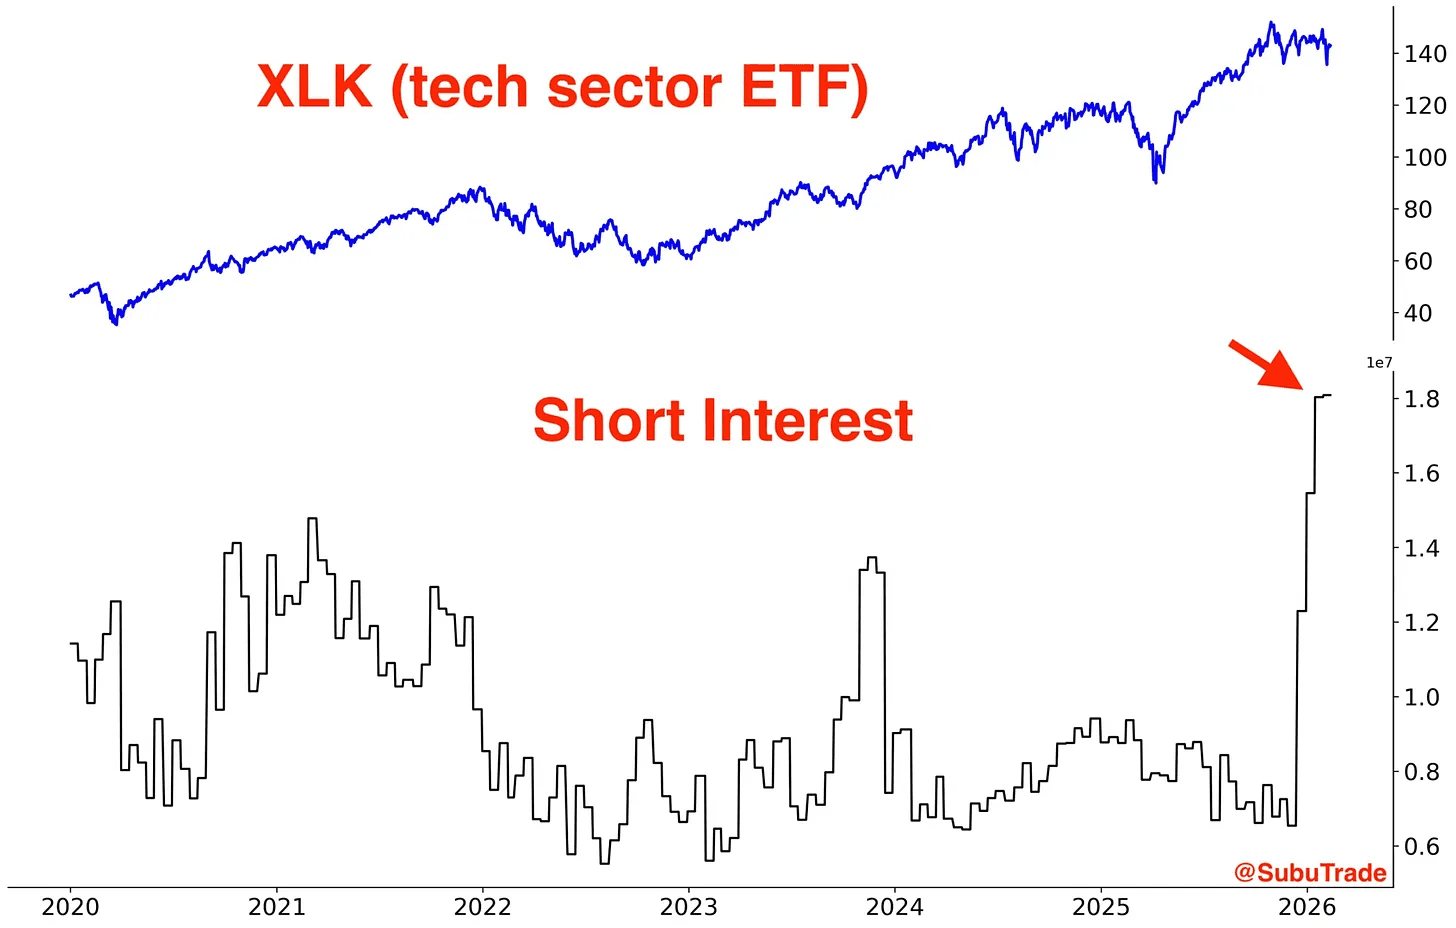
We’re seeing record short interest. It is now at the highest level of this decade. And this is happening after many growth stocks have already fallen 50%, not before.
Now that everyone is short tech and everyone is positioned the same way, could that be a turning point?
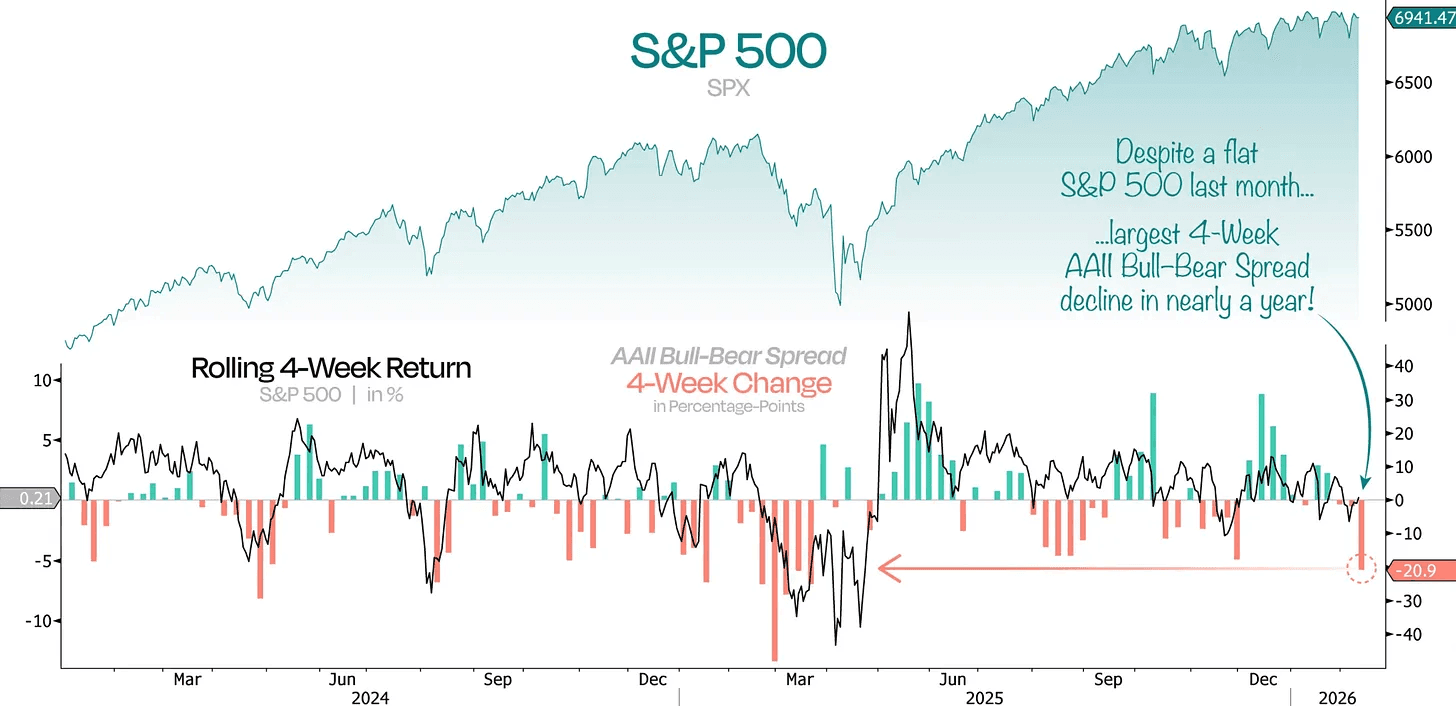
Even with everything going on in the market, the S&P 500 has been basically flat over the past month. At the same time, the AAII bull bear spread just saw its largest 4 week drop in nearly a year. When the spread is very low or negative, investors are very pessimistic, which tends to happen close to market bottoms.
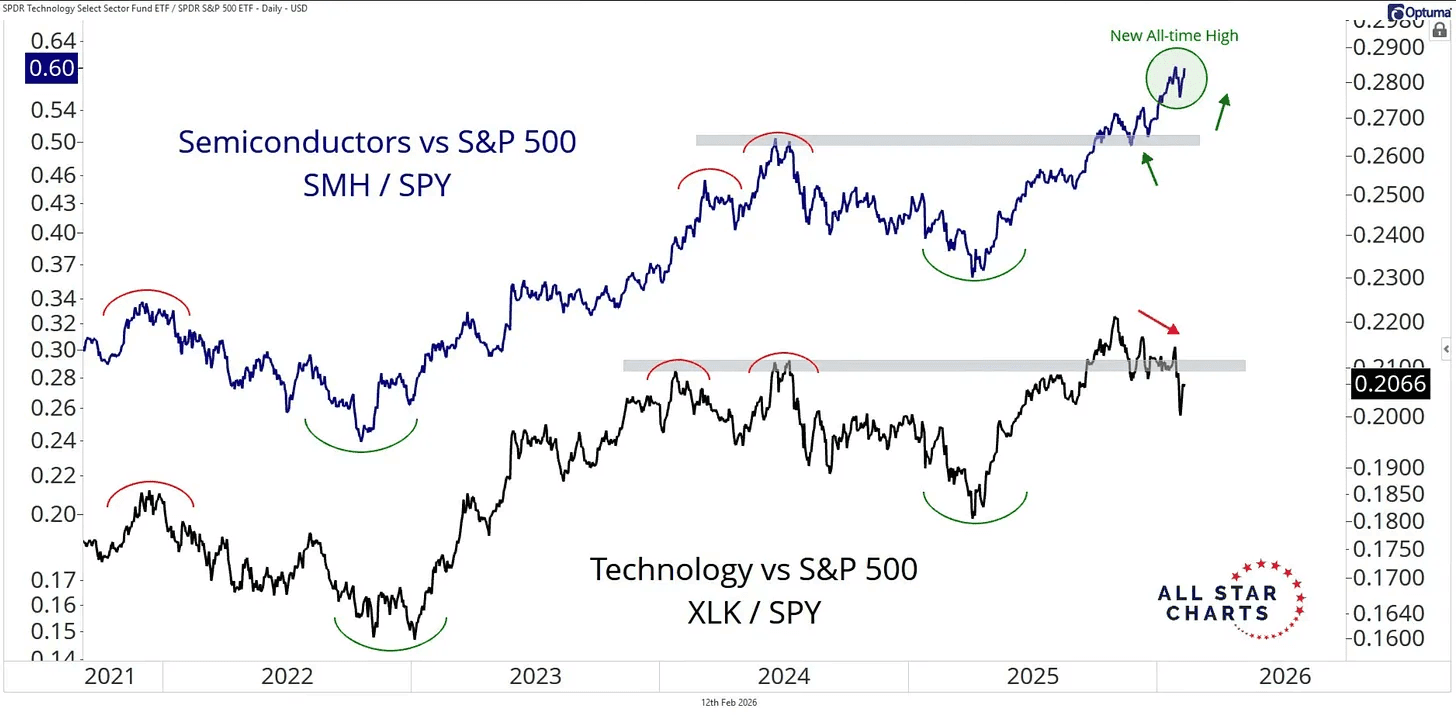
Semiconductors have broken out to new all time highs relative to the S&P 500. As long this keeps going, it’s unlikely that the entire market collapses. It’s the most important sector driving this bull market. But what we’re seeing now is that its starting to diverge from the rest of tech stocks. This could only be temporary. And maybe we’ll see tech come back to live. But at the very least it’s critical that semis do not start to roll over too.
Scenario 2
Second, the weakness in parts of the market continues to spread. The index cannot withstand the downward pressure and starts a potential correction.
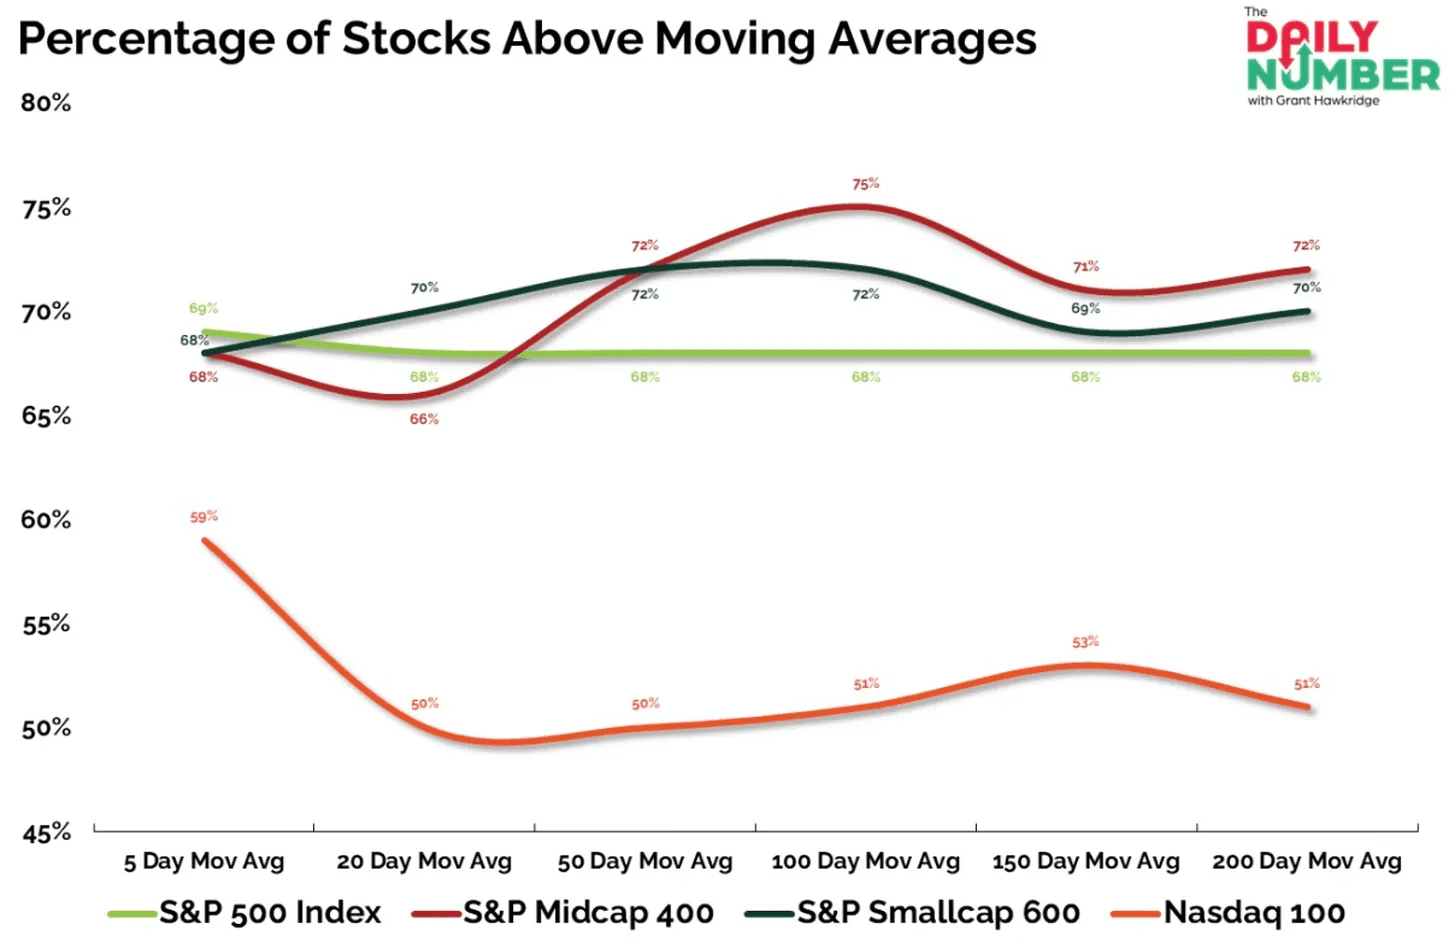
The divergence is even more stark when you zoom in: only 51% of Nasdaq stocks are trading above their 200-day moving average, compared to 68% for the broader S&P 500. Technology stocks, which make up the bulk of the Nasdaq, are clearly lagging despite the positive headline breadth numbers.
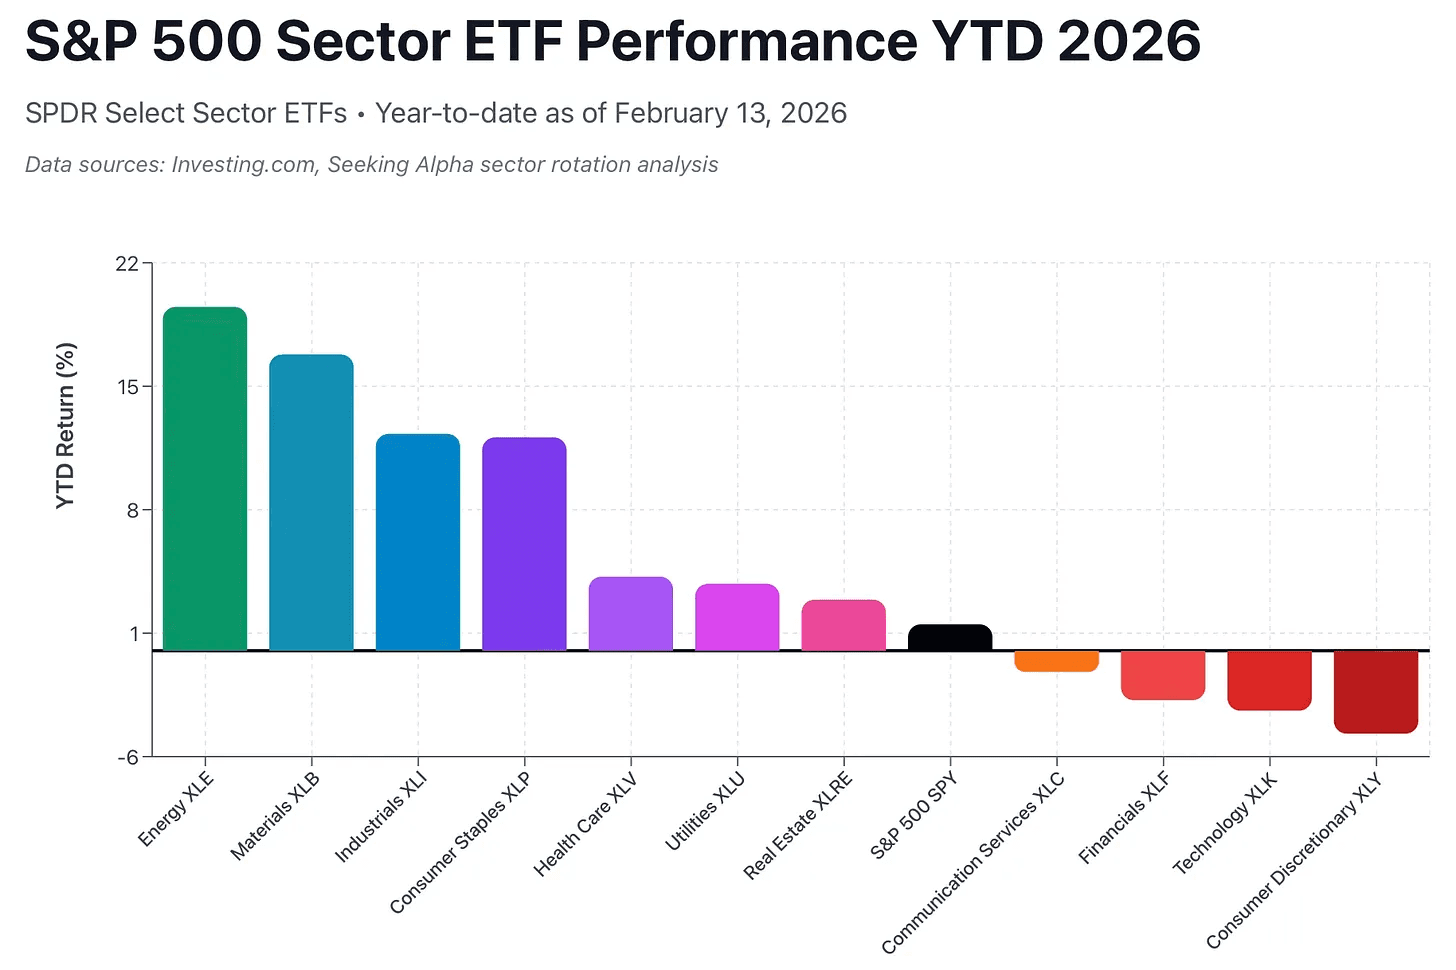
The market is playing it safe right now. Money is moving out of risky stocks and into safer ones. Energy and Materials now leads all other sectors, while technology, communication services, and financials are being sold aggressively.
Interestingly, when energy is the leading sector, the S&P 500 usually does not perform well. In those periods, it has returned only about 1.87% per year. Compare that to times when technology leads, when returns jump to around 35.48% per year. Even when communication services lead, the market has still delivered strong gains of about 21.57% per year.
Do you remember the last time energy was the leading sector? That was in 2022. Most people remember how tough the stock market was that year.
The market is split right now. About 19% of consumer staples stocks are making new 52-week highs, while around 18% of tech stocks are at new 52-week lows. This kind of gap between value and growth has only happened once before, back on November 30, 2000, just before tech stocks started a multi-year bear market.
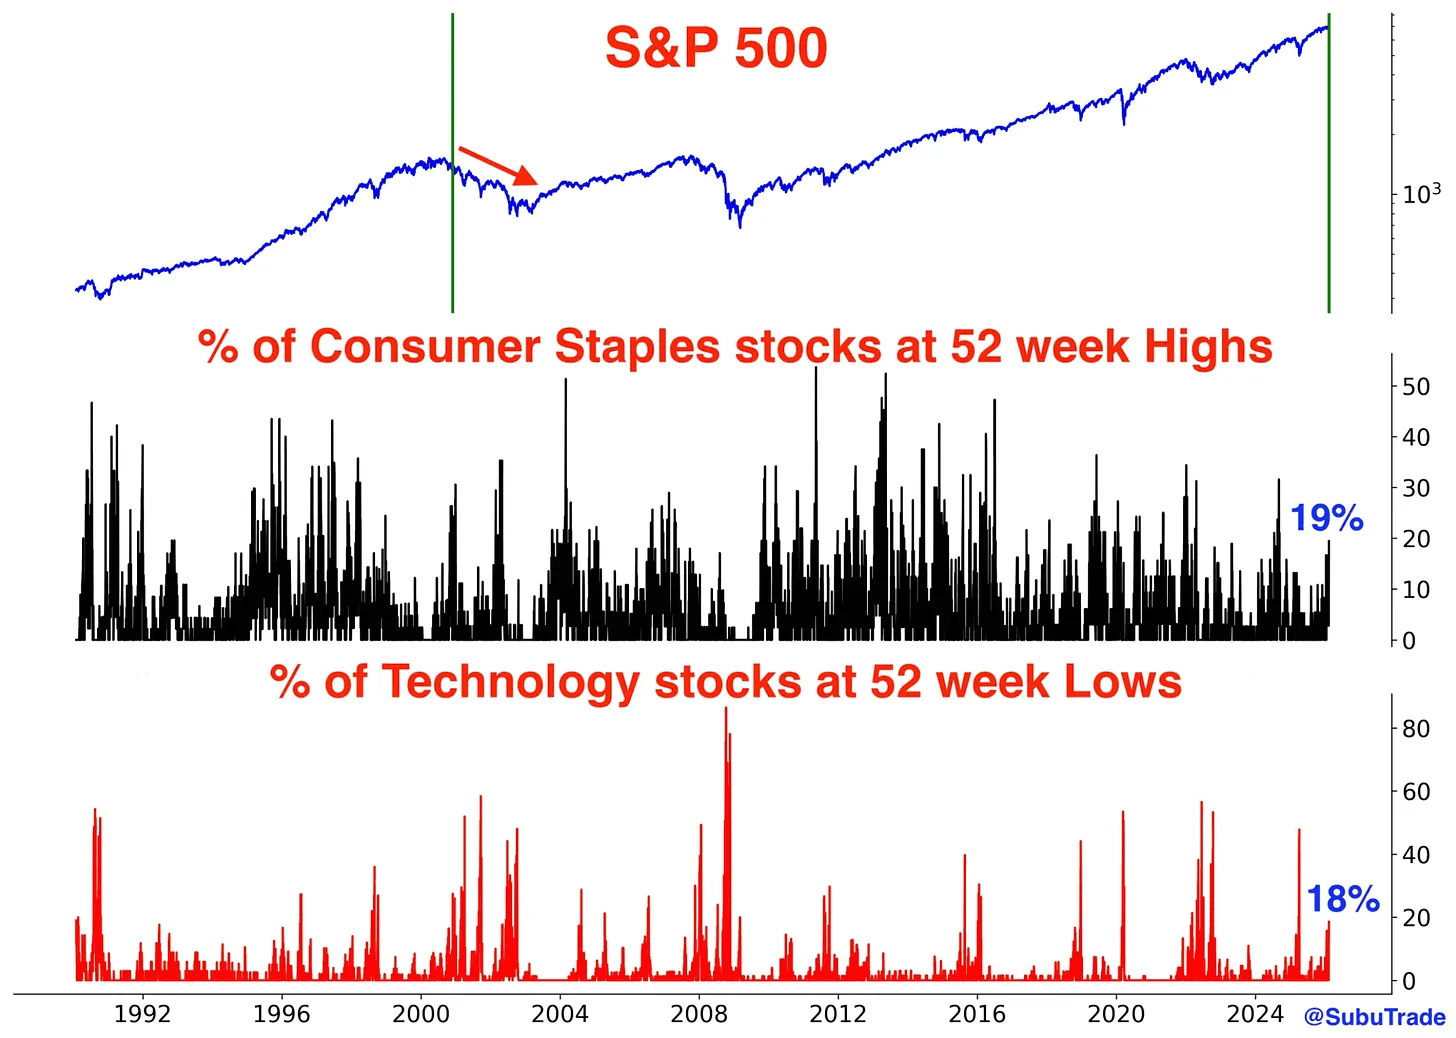
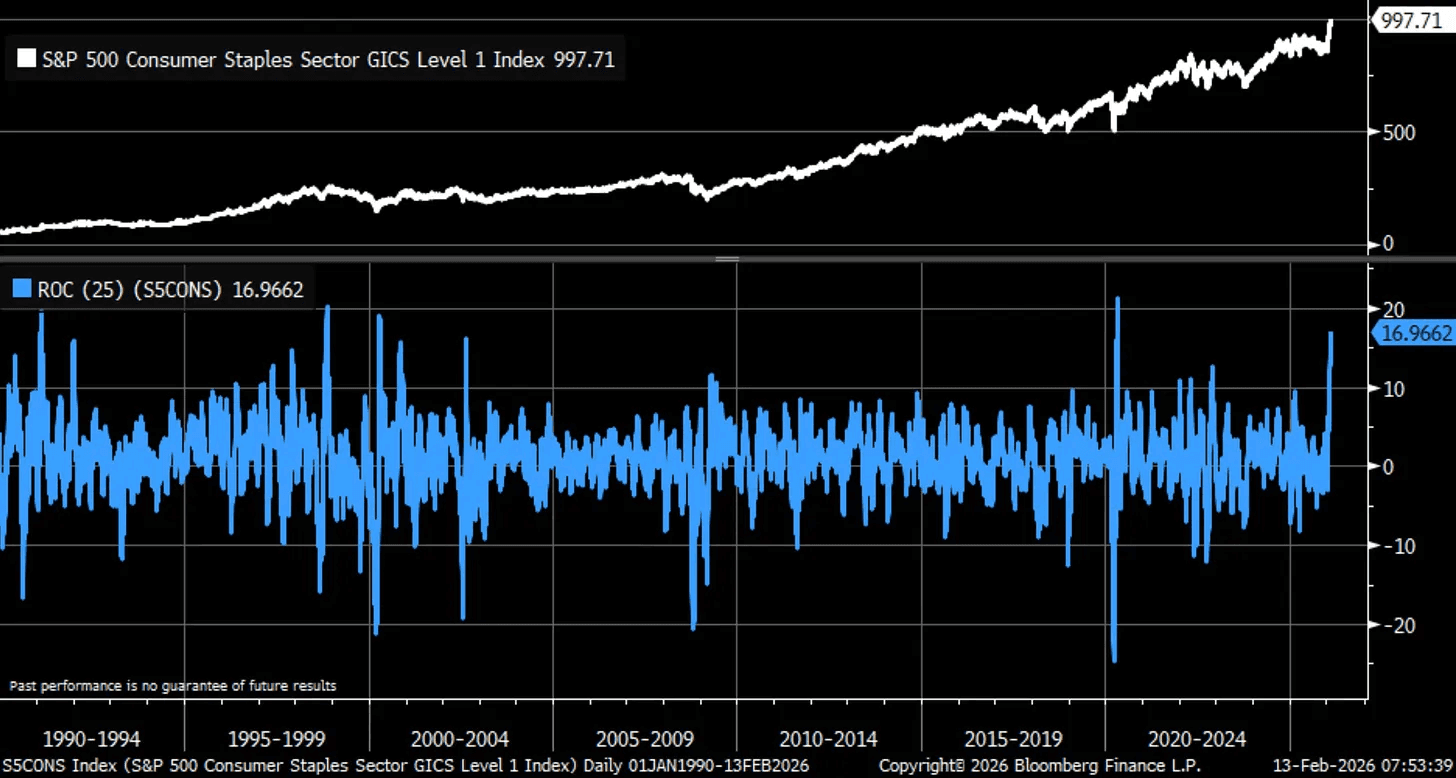
Consumer staples are up 17% over the last 5 weeks. To see moves like this in the past, you have to go all the way back to April 2020 during the pandemic, April 2000 during the dot-com crash, November 1998 during the LTCM crisis, and February 1991 during a recession. Moves like this in staples usually only happen during major market stress, when something big is going wrong under the surface.
No one knows exactly what will happen next. That’s why it’s important to stay open-minded and adapt to the market. You cannot just watch the overall market, because it can hide what’s really happening underneath. You also need to look at individual stocks and sectors. Are they selling off, starting to turn back up, or simply continuing to move higher?
Whatever it might be, the market is always giving signals. The key is paying attention and being willing to adjust when the facts change.
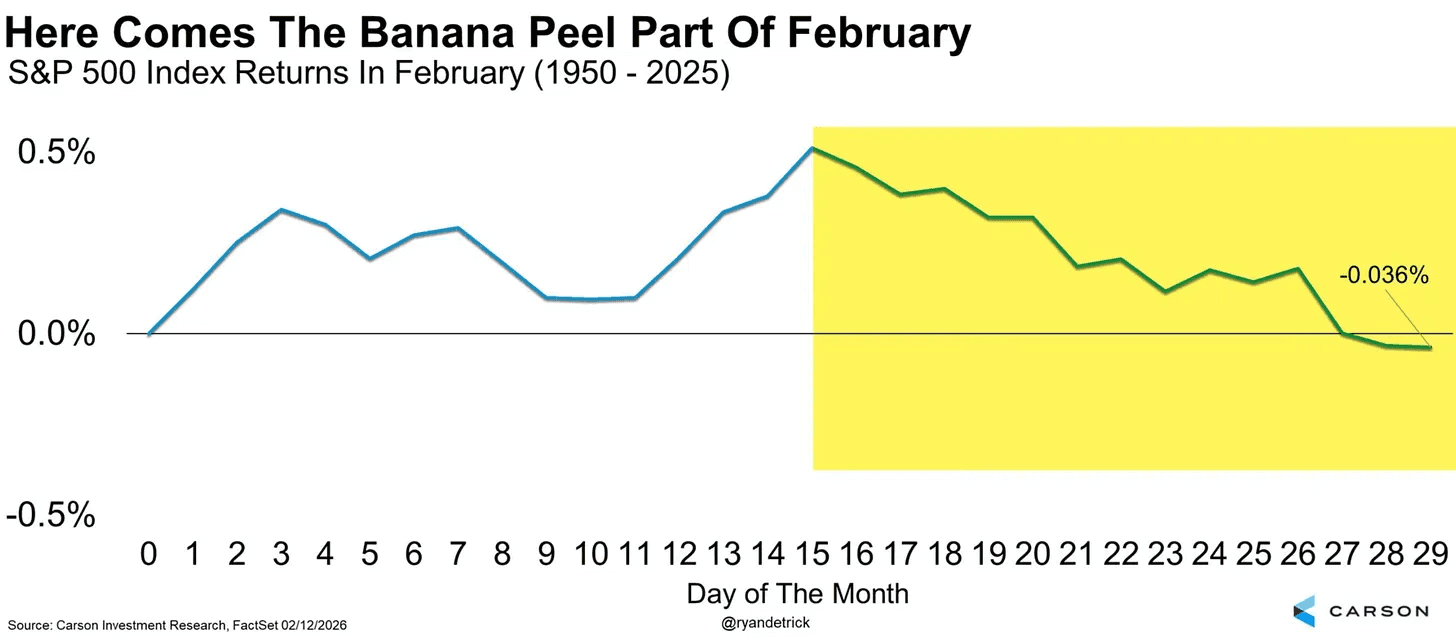
And we’re entering the second half of February, historically the weakest stretch of what’s already one of the year’s most challenging months for stocks.
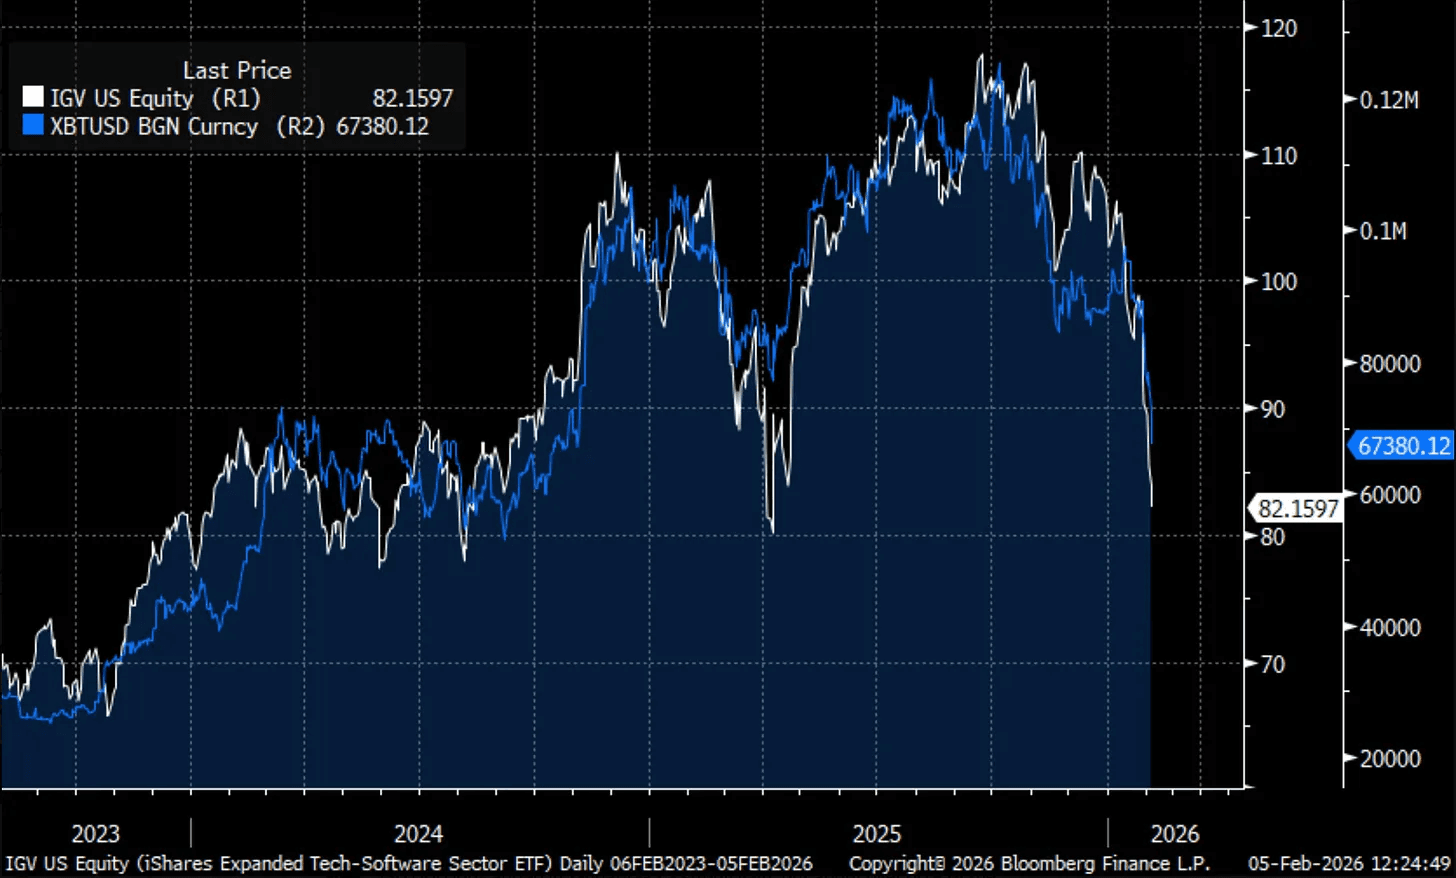
For years, when people talked about how Bitcoin moved with the stock market, the answer was simple. It followed the Nasdaq and the broader tech sector. The correlation was strong and consistent. But this relationship has now clearly changed.
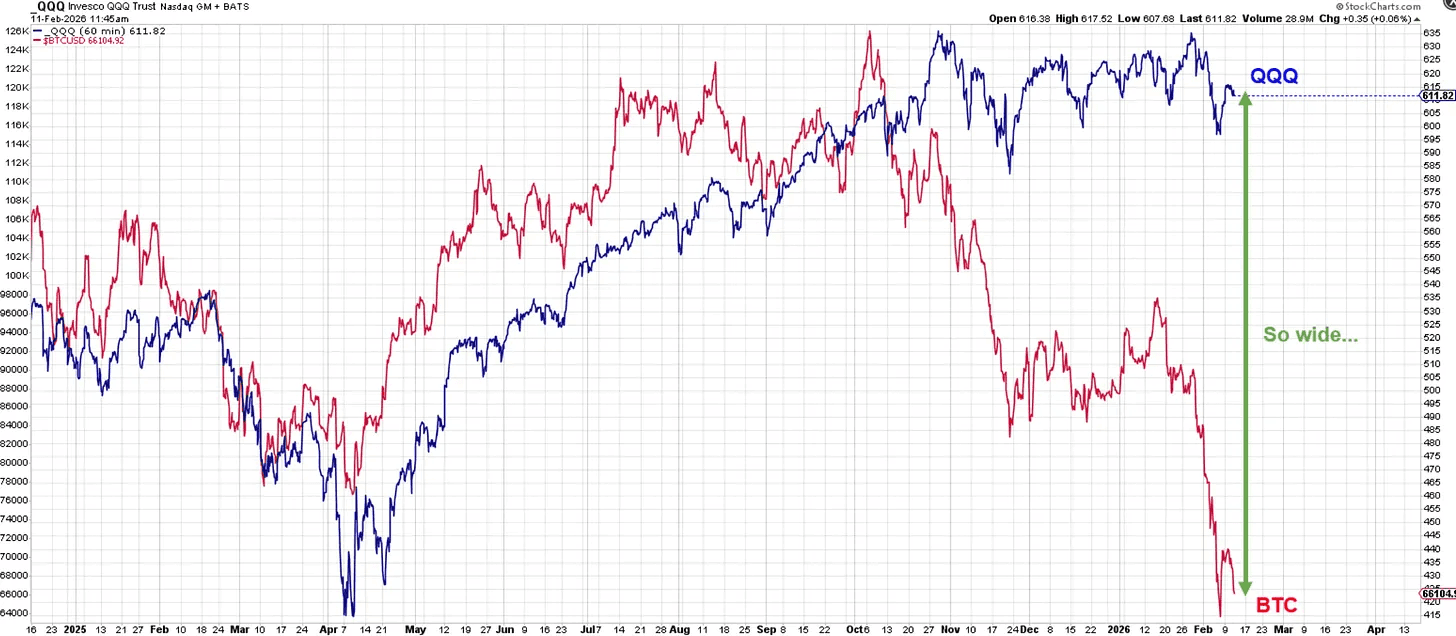
Bitcoin is no longer moving with the Nasdaq. Instead, it is moving much more closely with software stocks. When you line up Bitcoin’s price with software stocks, the charts look almost the same. Both have seen sharp selloffs over the past year and have moved down together at nearly the same time.
Bitcoin and software stocks attract similar kinds of investors. They are both seen as high-growth, high-risk assets. Asset that are most sensitive to rates, liquidity, and growth expectations. When people feel confident and want growth, they buy both. When they get nervous, they sell both.
Most of the big earnings reports are already out of the way. There are still a few smaller companies reporting this week, but the main event is next week when Nvidia reports earnings. That report could be a big trigger for the market, either to the upside or the downside. It is widely expected that Nvidia will beat estimates. The real question is how big the beat will be, and whether it will be enough to move the market higher.

The last few weeks have been rough. I still think we’re in a bigger bull market, but markets never move in a straight line. Pullbacks and consolidations are normal.
Right now, I continue to be cautious. That does not mean I’m bearish. I’m not selling everything and getting out, but I’m also not going all in. This is not the time to be using leverage or loading up on positions here.
The best time to be aggressive is when the market is in a clear uptrend, like it was from May to October 2025. Those were much easier conditions. What we’ve seen since October is very different and a lot more chaotic.
So I still have some long exposure, but I’m not pushing it. I’m being patient and waiting for the market to improve before pressing the gas. Right now, things are choppy and unclear, and that’s usually not the best time to be aggressive.
Forcing positions in a tough market almost always backfires. You don’t get rewarded for taking extra risk when conditions are bad. In fact, most of the time it does the opposite and costs you money. It’s usually better to wait, protect what you’ve already made, and step in more aggressively when the odds are clearly back in your favor.
Hope everyone is enjoying the long weekend.
Previous Updates
View All
- Weekly Market Update: Earnings Season Is Here
- Market Update: The FinTech Comeback
- Weekly Market Update: Halftime
- Market Update: The Robots Are Coming
- Weekly Market Update: The Broadening
- Market Update: The Break Point
- Weekly Market Update: Patience
- Market Update: The Memory Crunch
- Weekly Market Update: The First Trillionaire
- Market Update: In Focus
- Weekly Market Update: Deleveraging
- Market Update: A Change of Character
- Market Update: The Next Quantum Leap