Go Back

Lin
Weekly Market Update: Is this the Bottom?
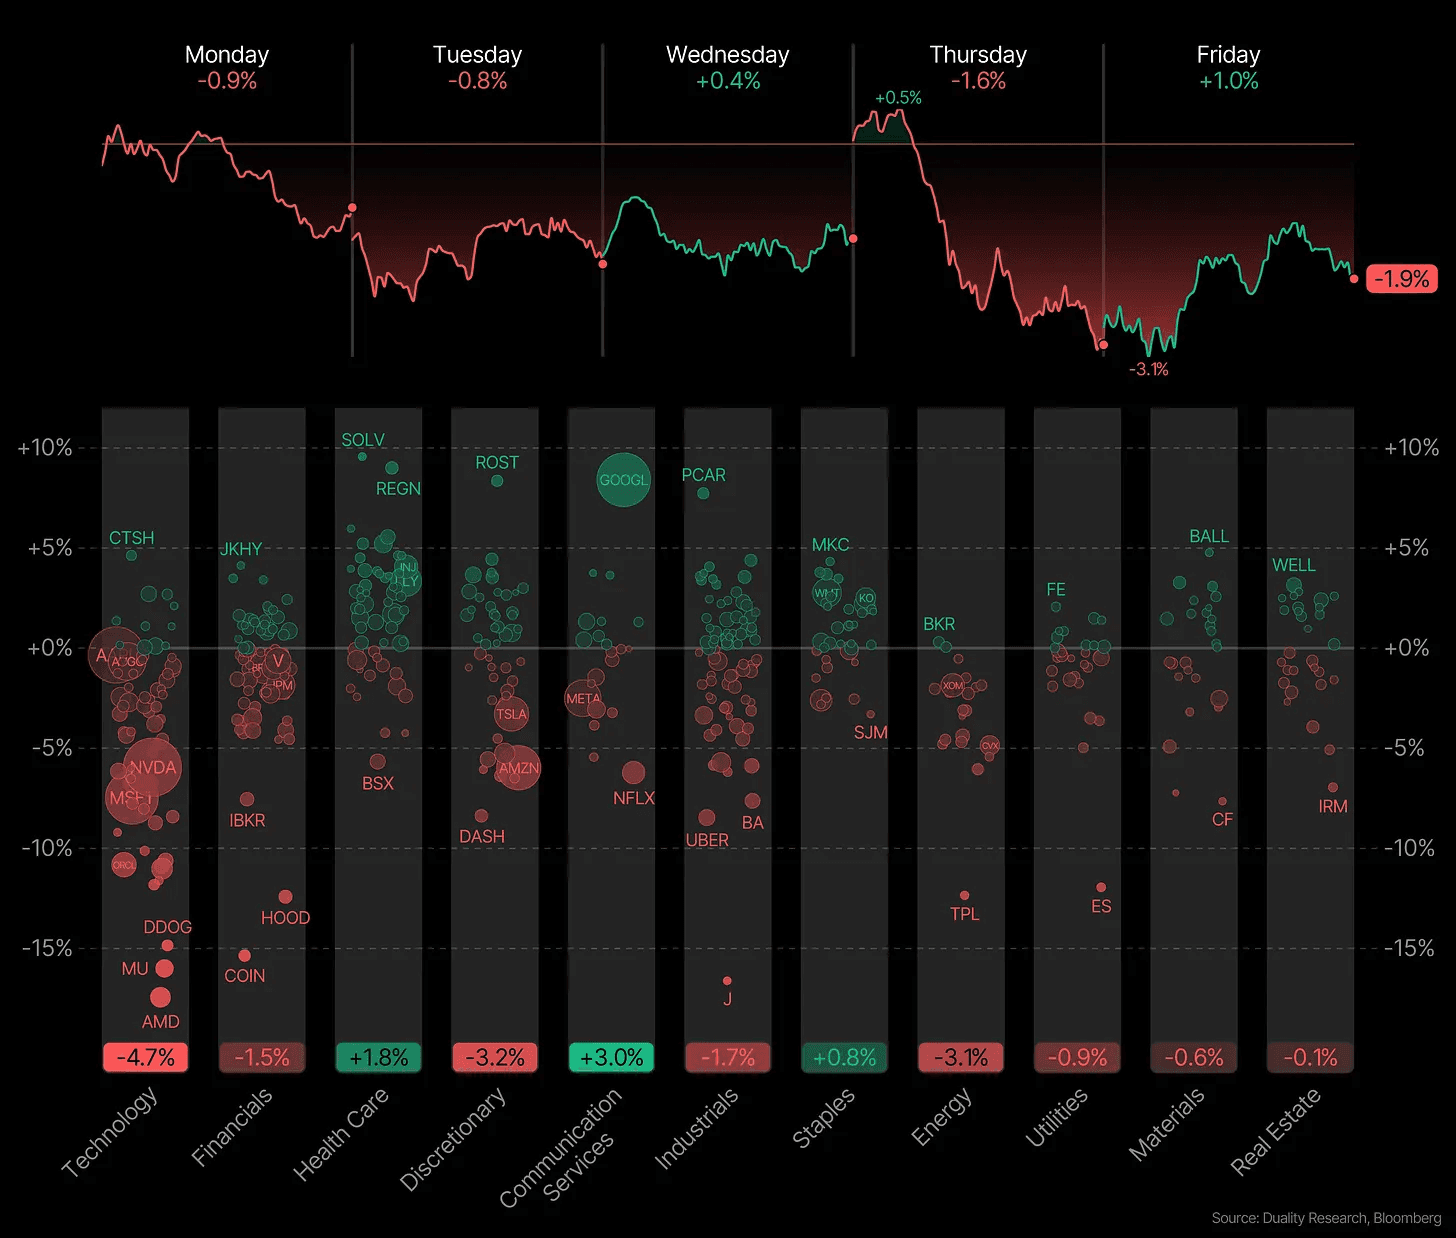
The S&P 500 officially closed its most volatile week since April.
It made a bit of unwanted history on Thursday. On Thursday it opened up more than 1.5% and then closed down more than 1.5%. It was only the 4th time ever that the S&P 500 experienced an intraday swing of that magnitude.
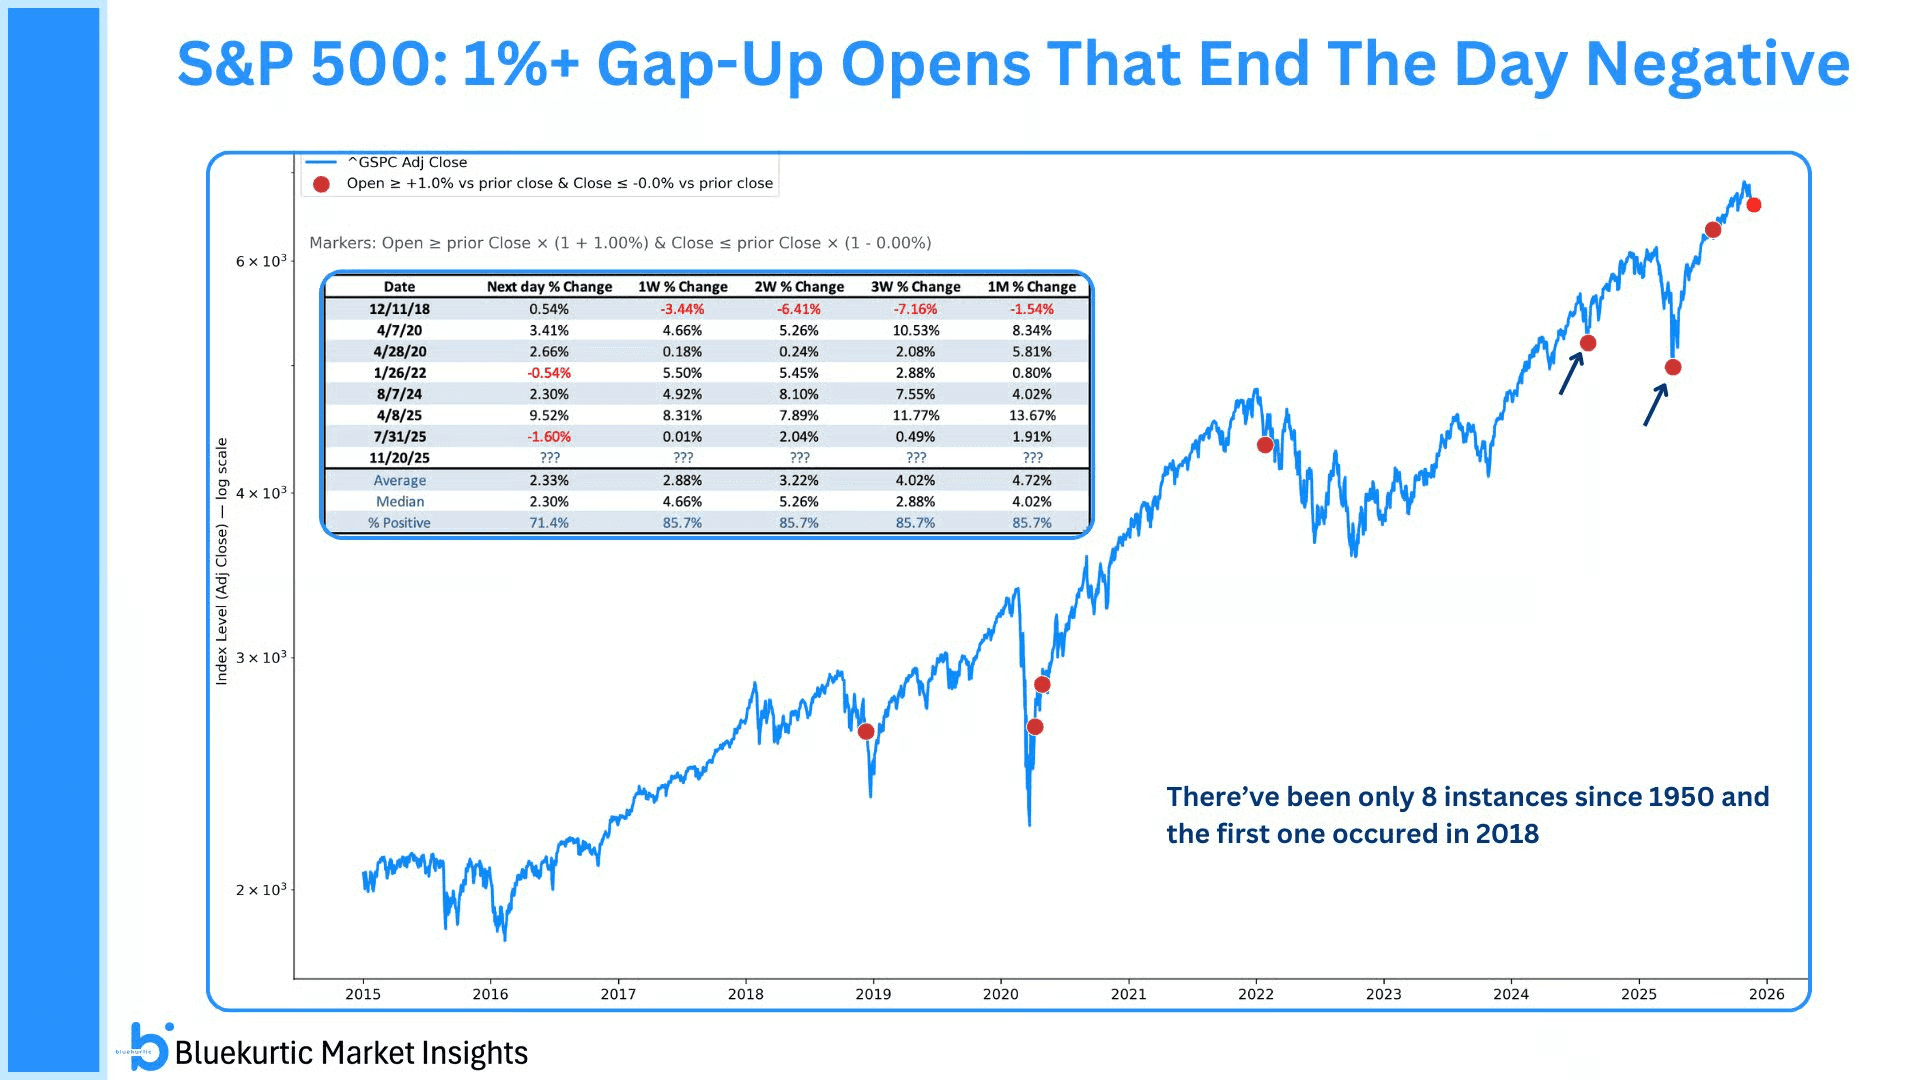
And if you look at the times since 1950, there have been only 8 days where the index opened more than 1% higher but still finished red.
One month later the S&P 500 was higher in 6 of the last 7 cases. The last 3 times this happened marked the bottom.
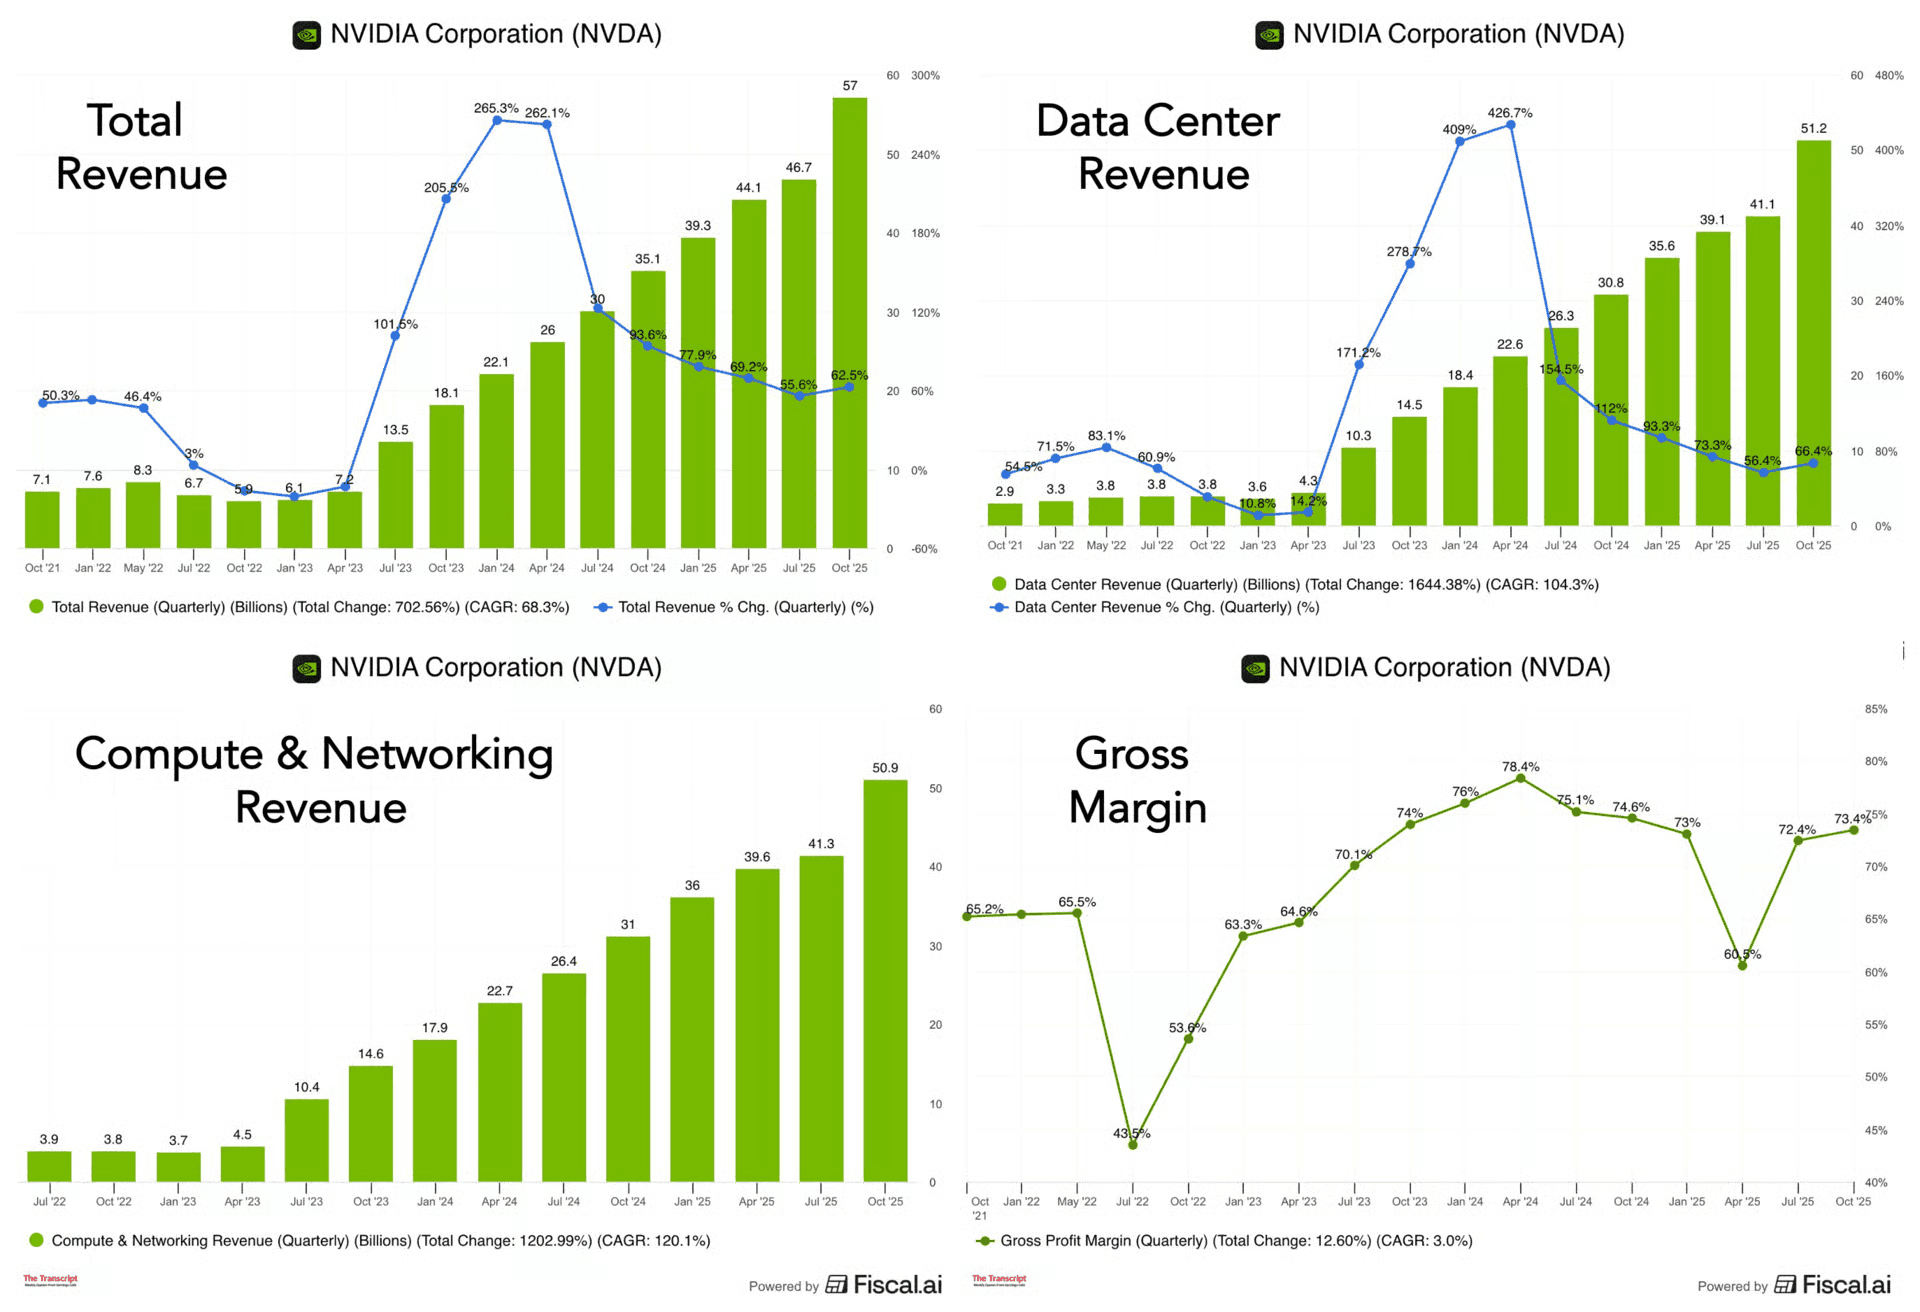
Even Nvidia’s incredible earnings could not stop the pullback.
The numbers were off the charts. No other company on earth is growing at this scale. Jensen said it well: “AI is going everywhere, doing everything, all at once.”
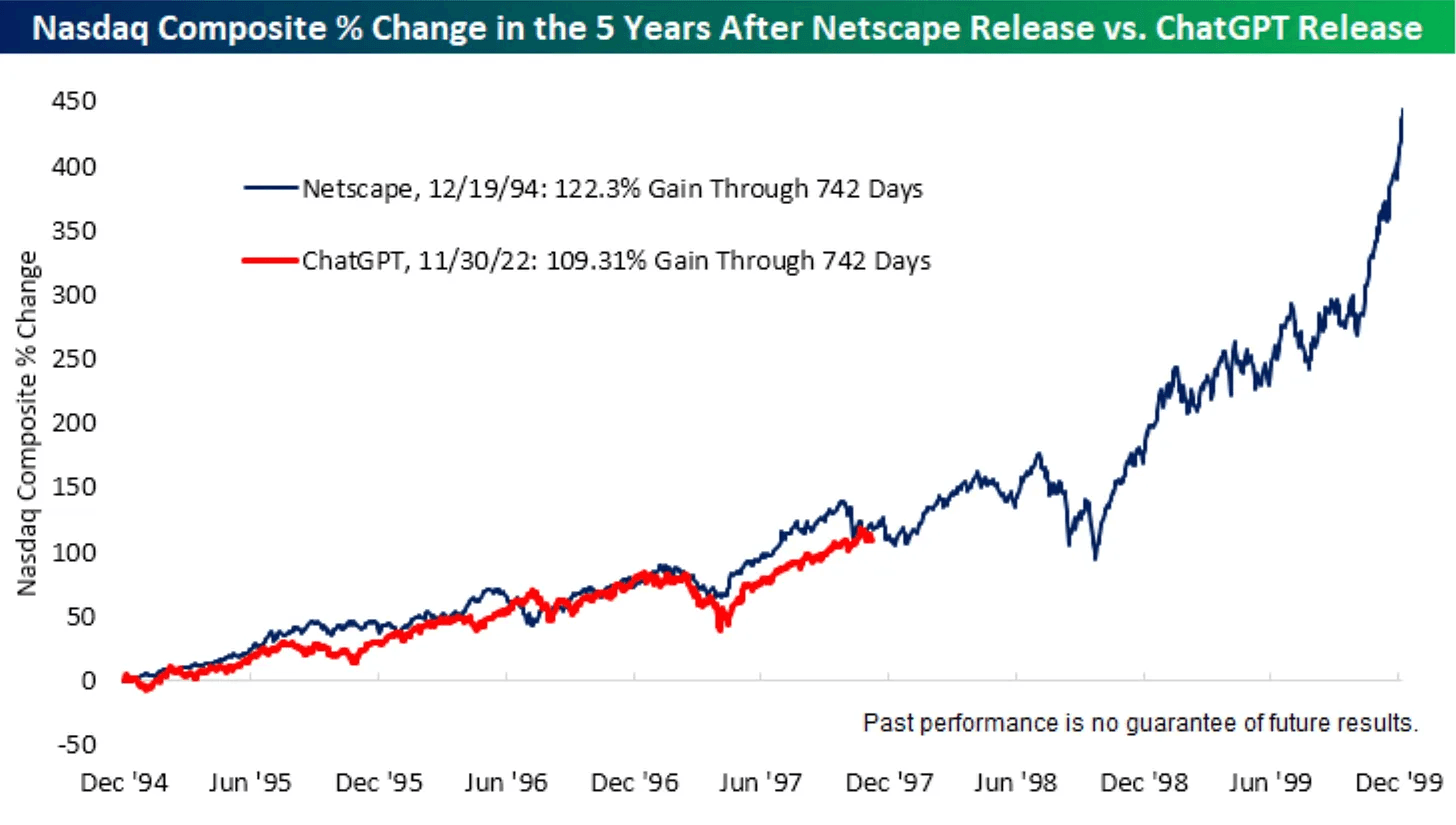
AI is not hype. It is a multi trillion build out. But that does not mean it will go up in a straight line. There have already been several big drawdowns. And there will be many more. Each time the sceptics said the AI bull market was over. Each time they were wrong.
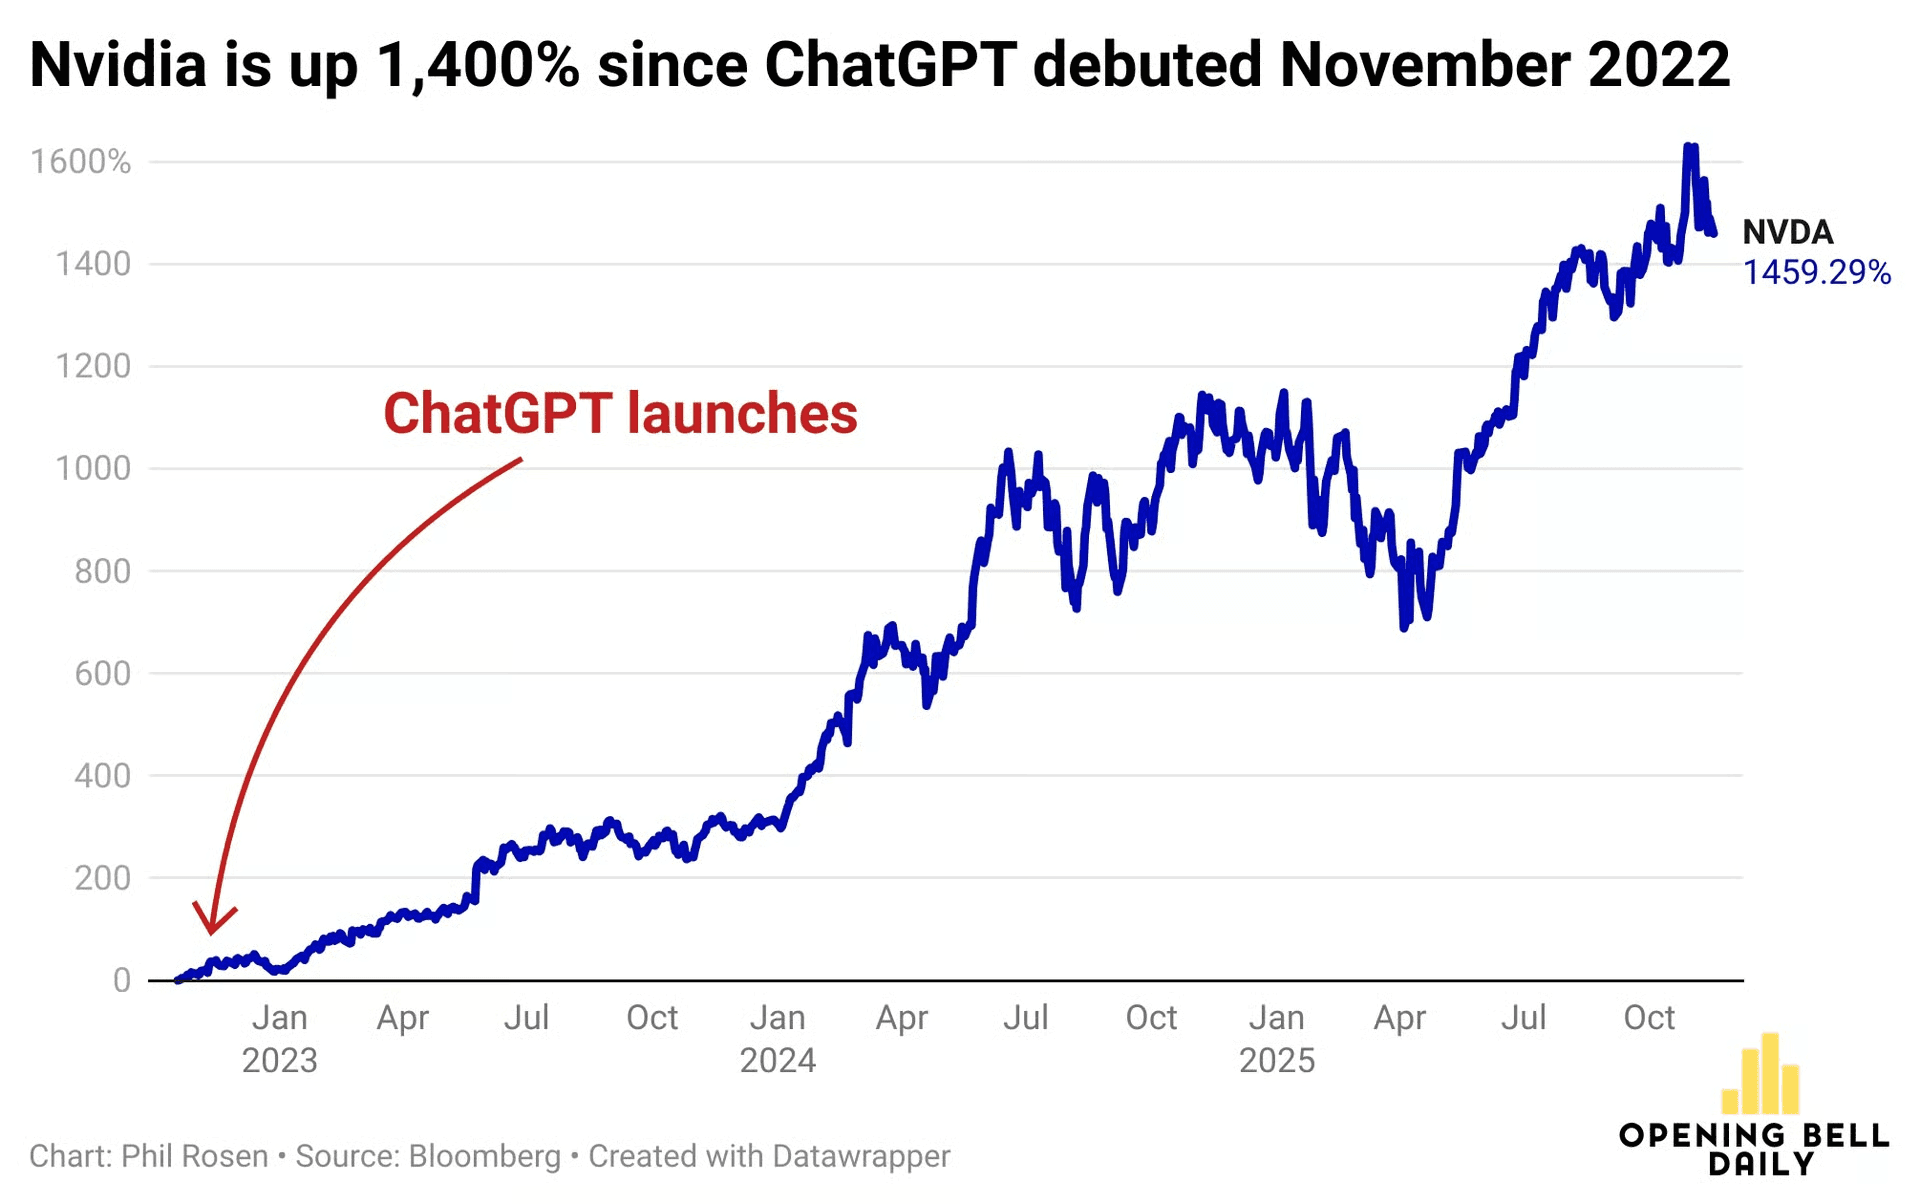
Sometimes it helps to zoom out and look at the long term chart. When you compare this to the dotcom bubble, we’re still only in the third inning. There is still room to run. And the actual big moves happen much later.
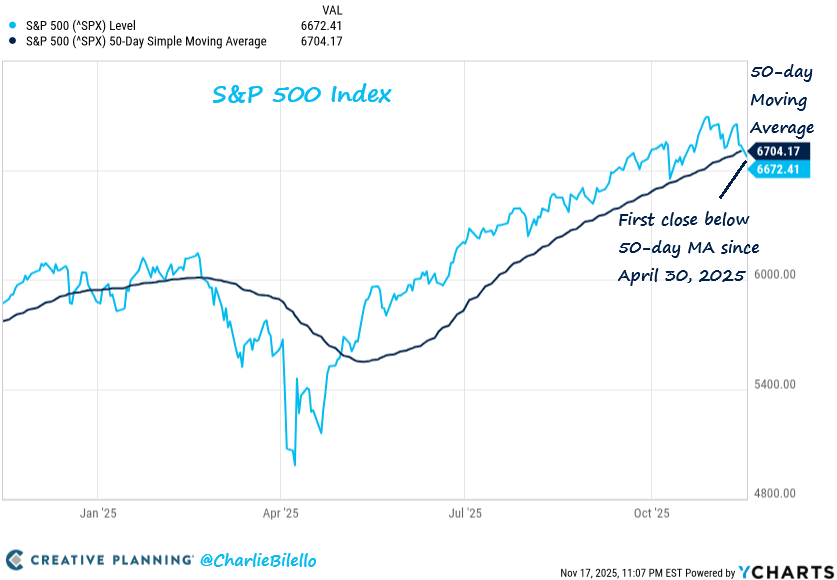
Last week the S&P 500 closed below its 50 day moving average for the first time since April 30.
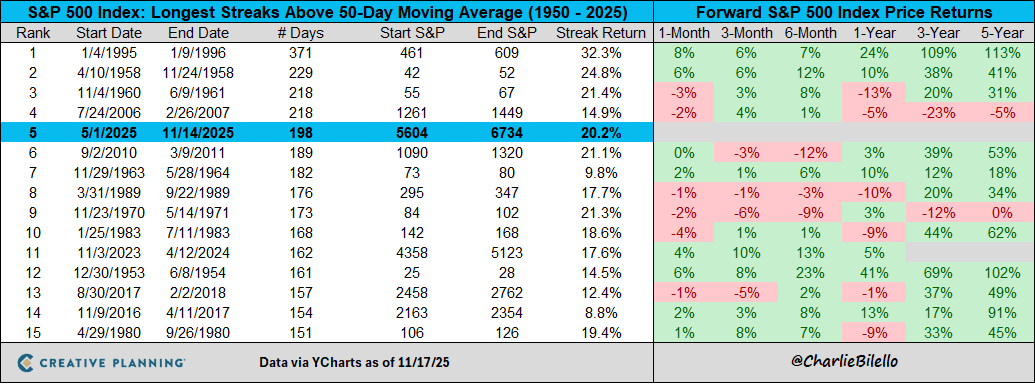
That ended a 198 day uptrend. It was the fifth longest since 1950. This is why trend following matters. It keeps you safe from the worst drawdowns while still catching the big upside with zero guesswork.
So what now.
The most likely outcome is that volatility comes back. The rally since April was almost too smooth. It ran more than 40% without a simple 5% pullback. That is not normal.
We pulled back about 5.8% from the October high. Since the 2009 low we have seen 31 corrections bigger than 5%. Every single one came with scary headlines. Every single one felt like the end of the world. But the world did not end and the market made new highs each time.
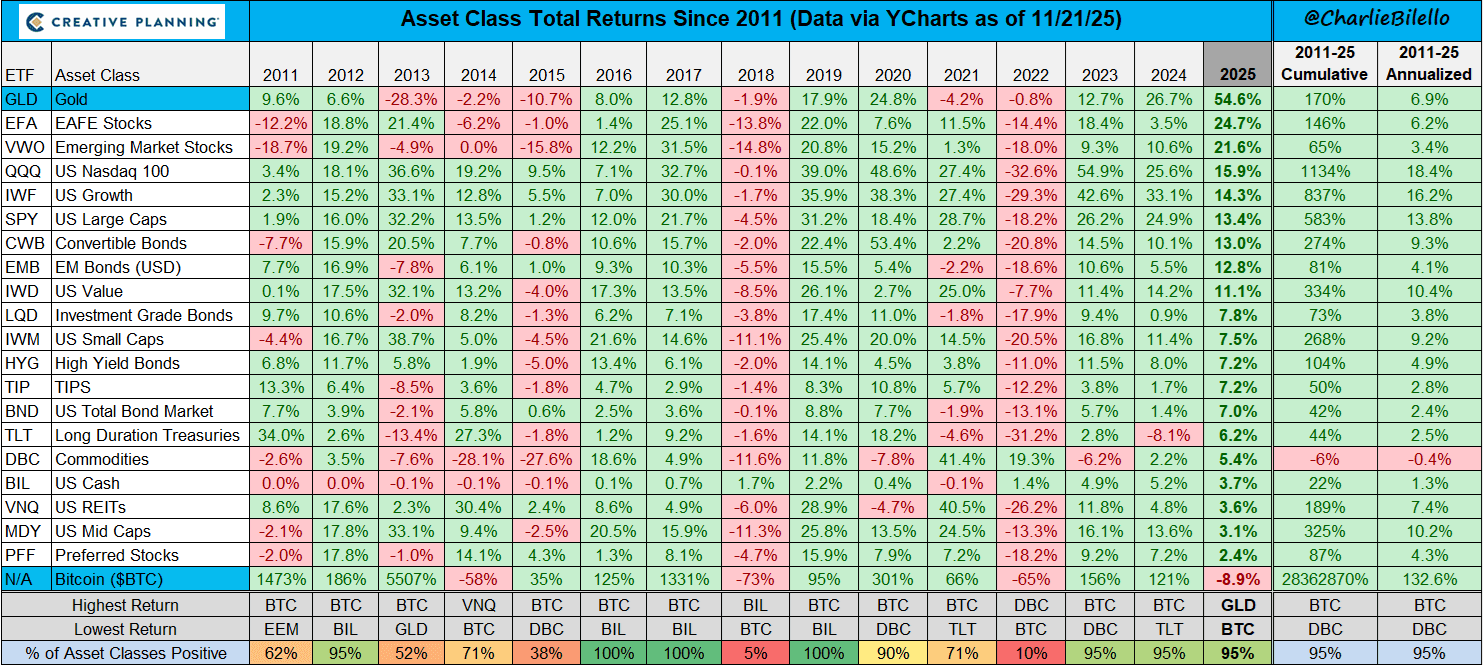
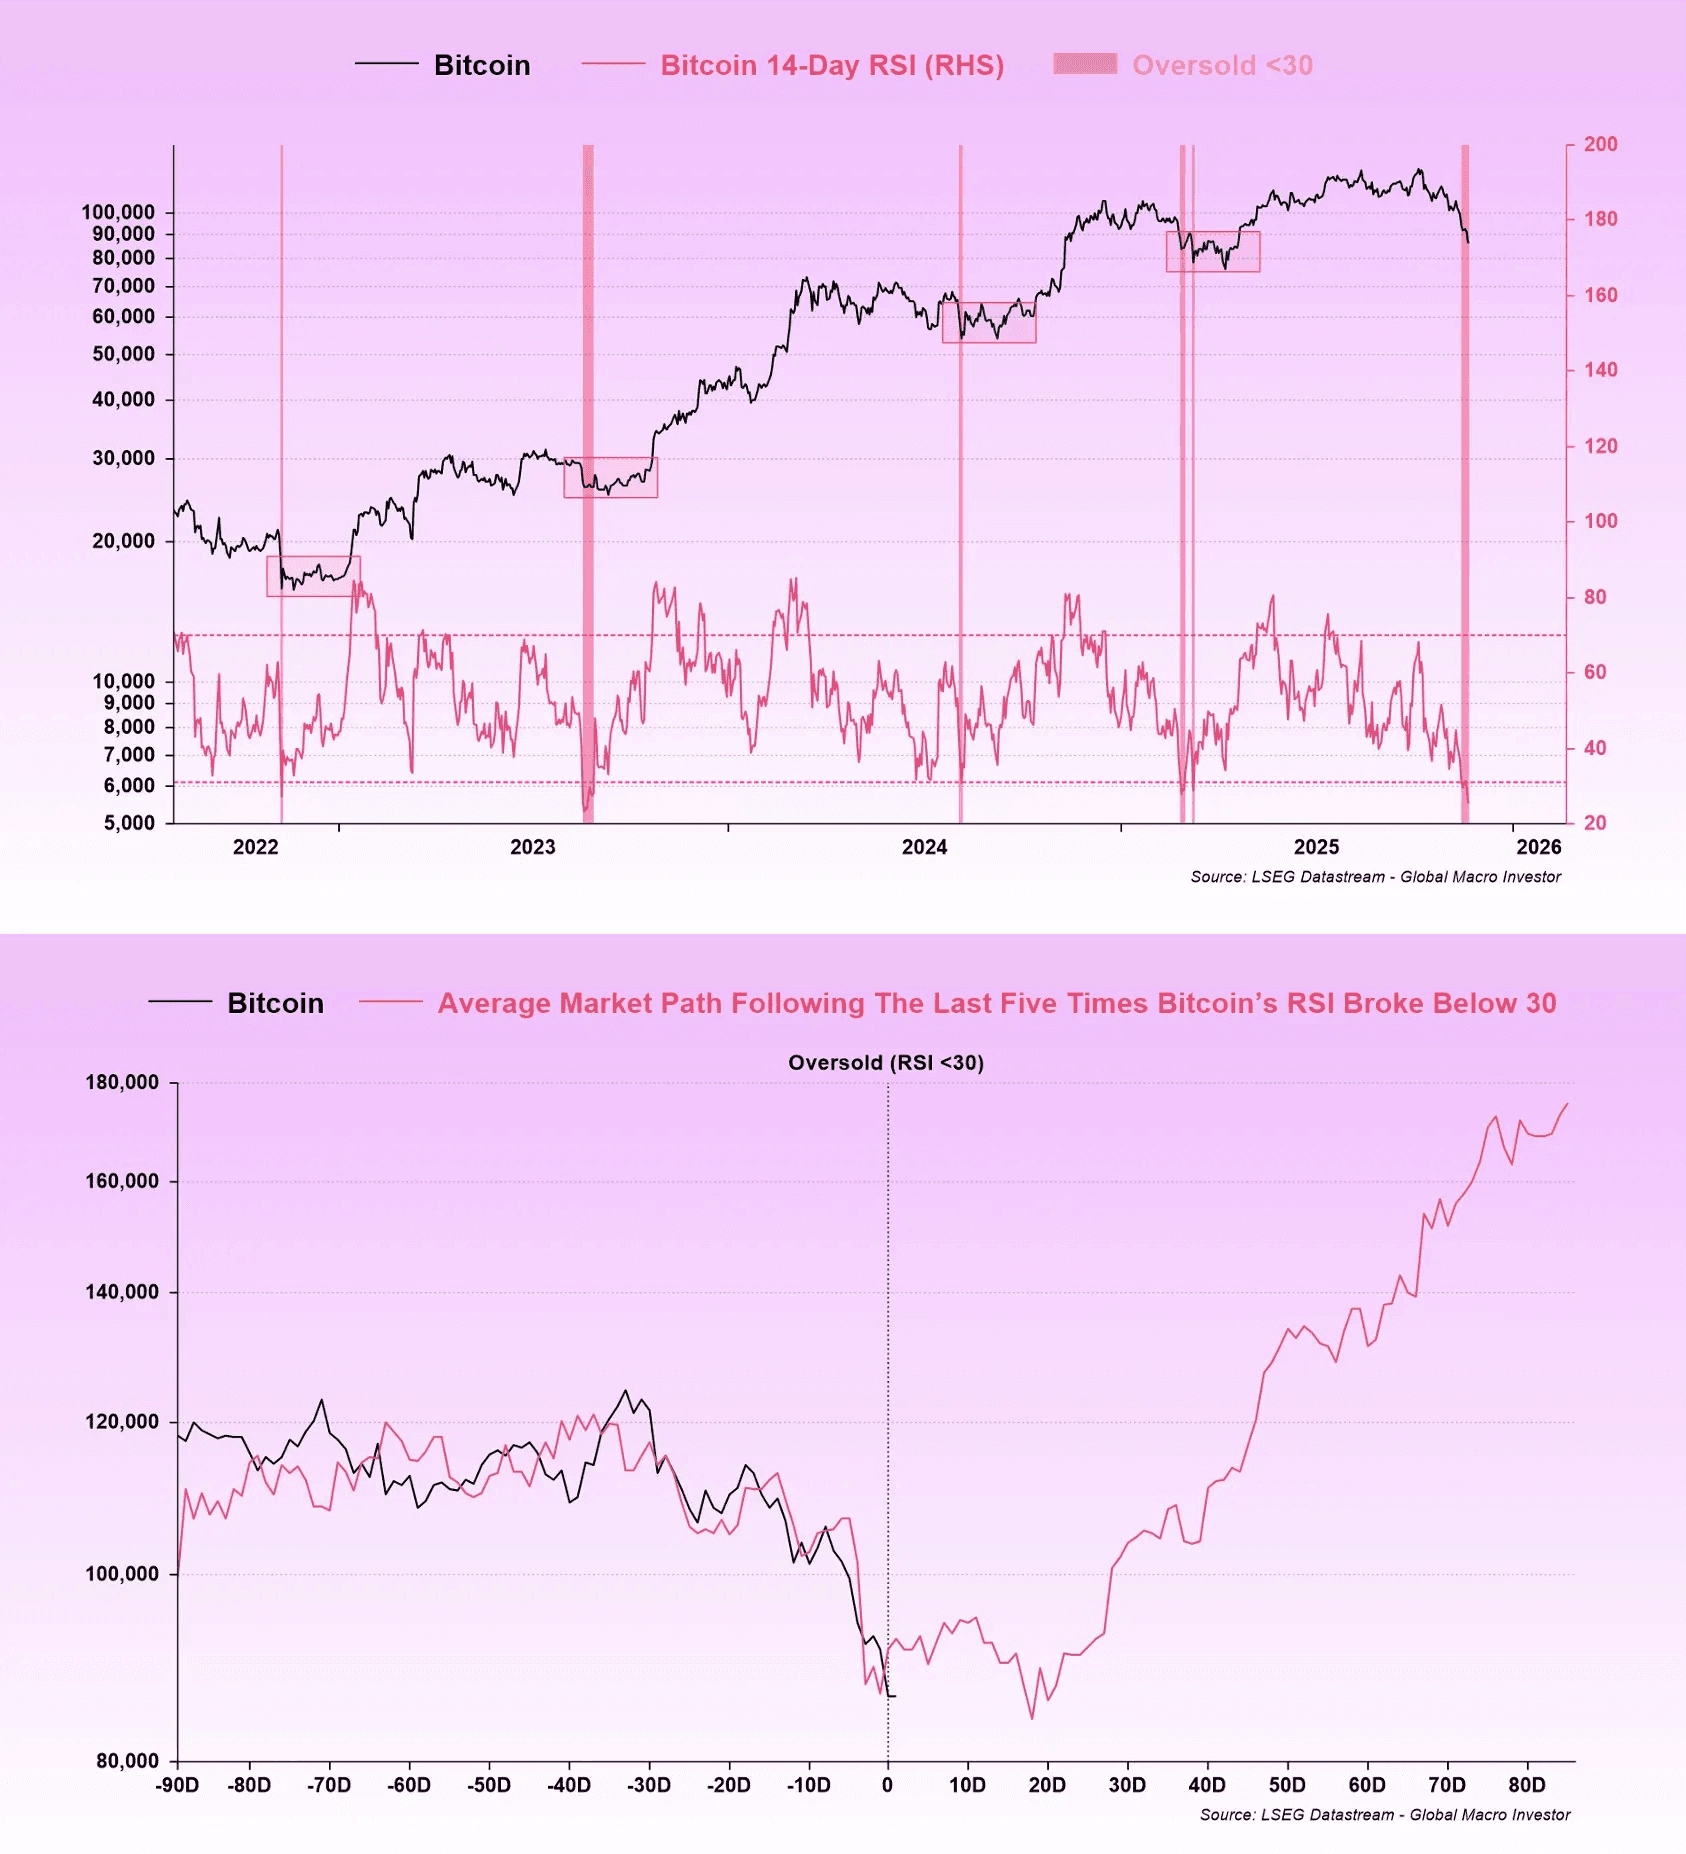
Bitcoin has been crushed and is now the worst performing major asset in 2025. It is down about 36% from its all time high and even down for the year. That has never happened before. So either the rest of the market follows suit or we are setting up for a violent snap back.
This week we also saw one of the largest selling waves ever. It was the second biggest outflow in crypto history.
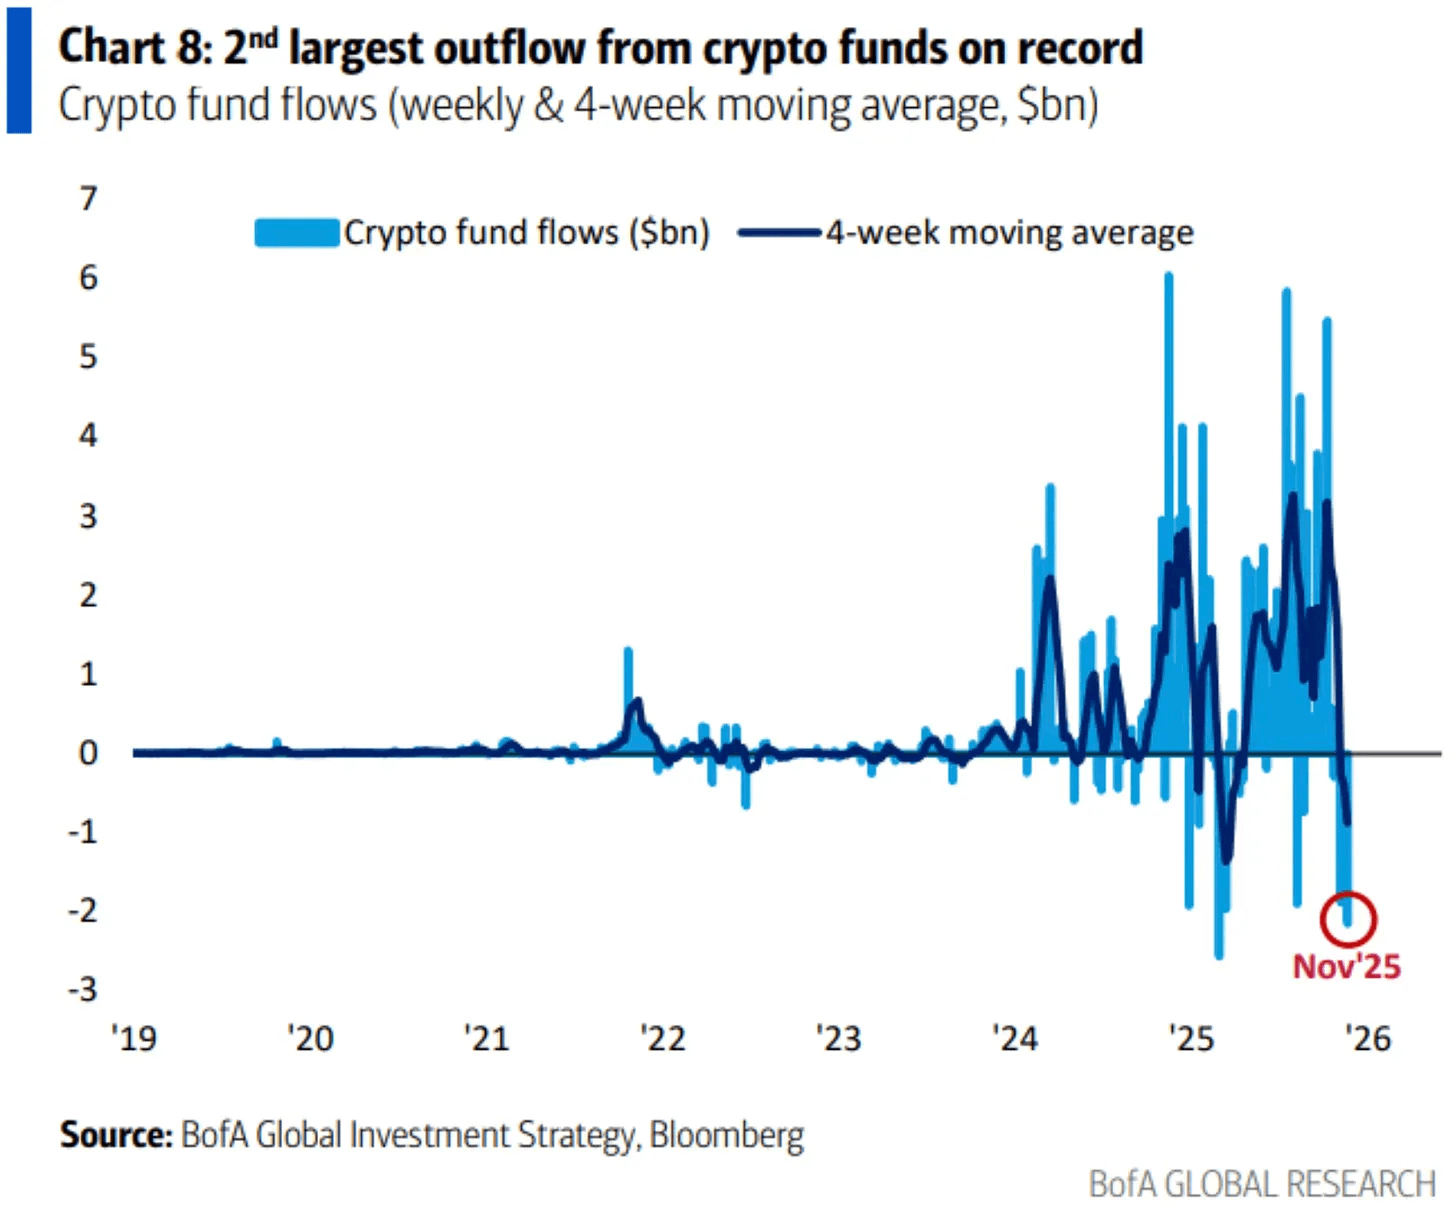
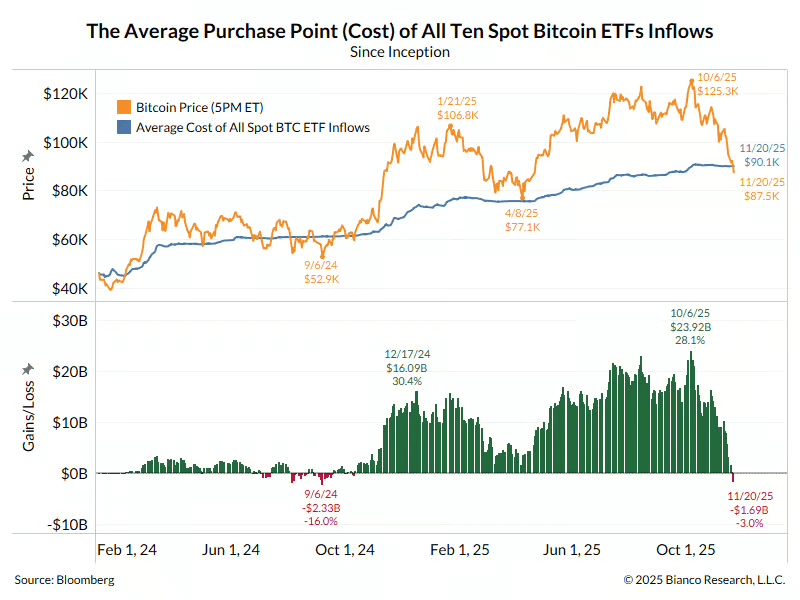
Why? The majority of Bitcoin ETF holders are now in the red. When that happens you often get forced selling and cascading liquidations.
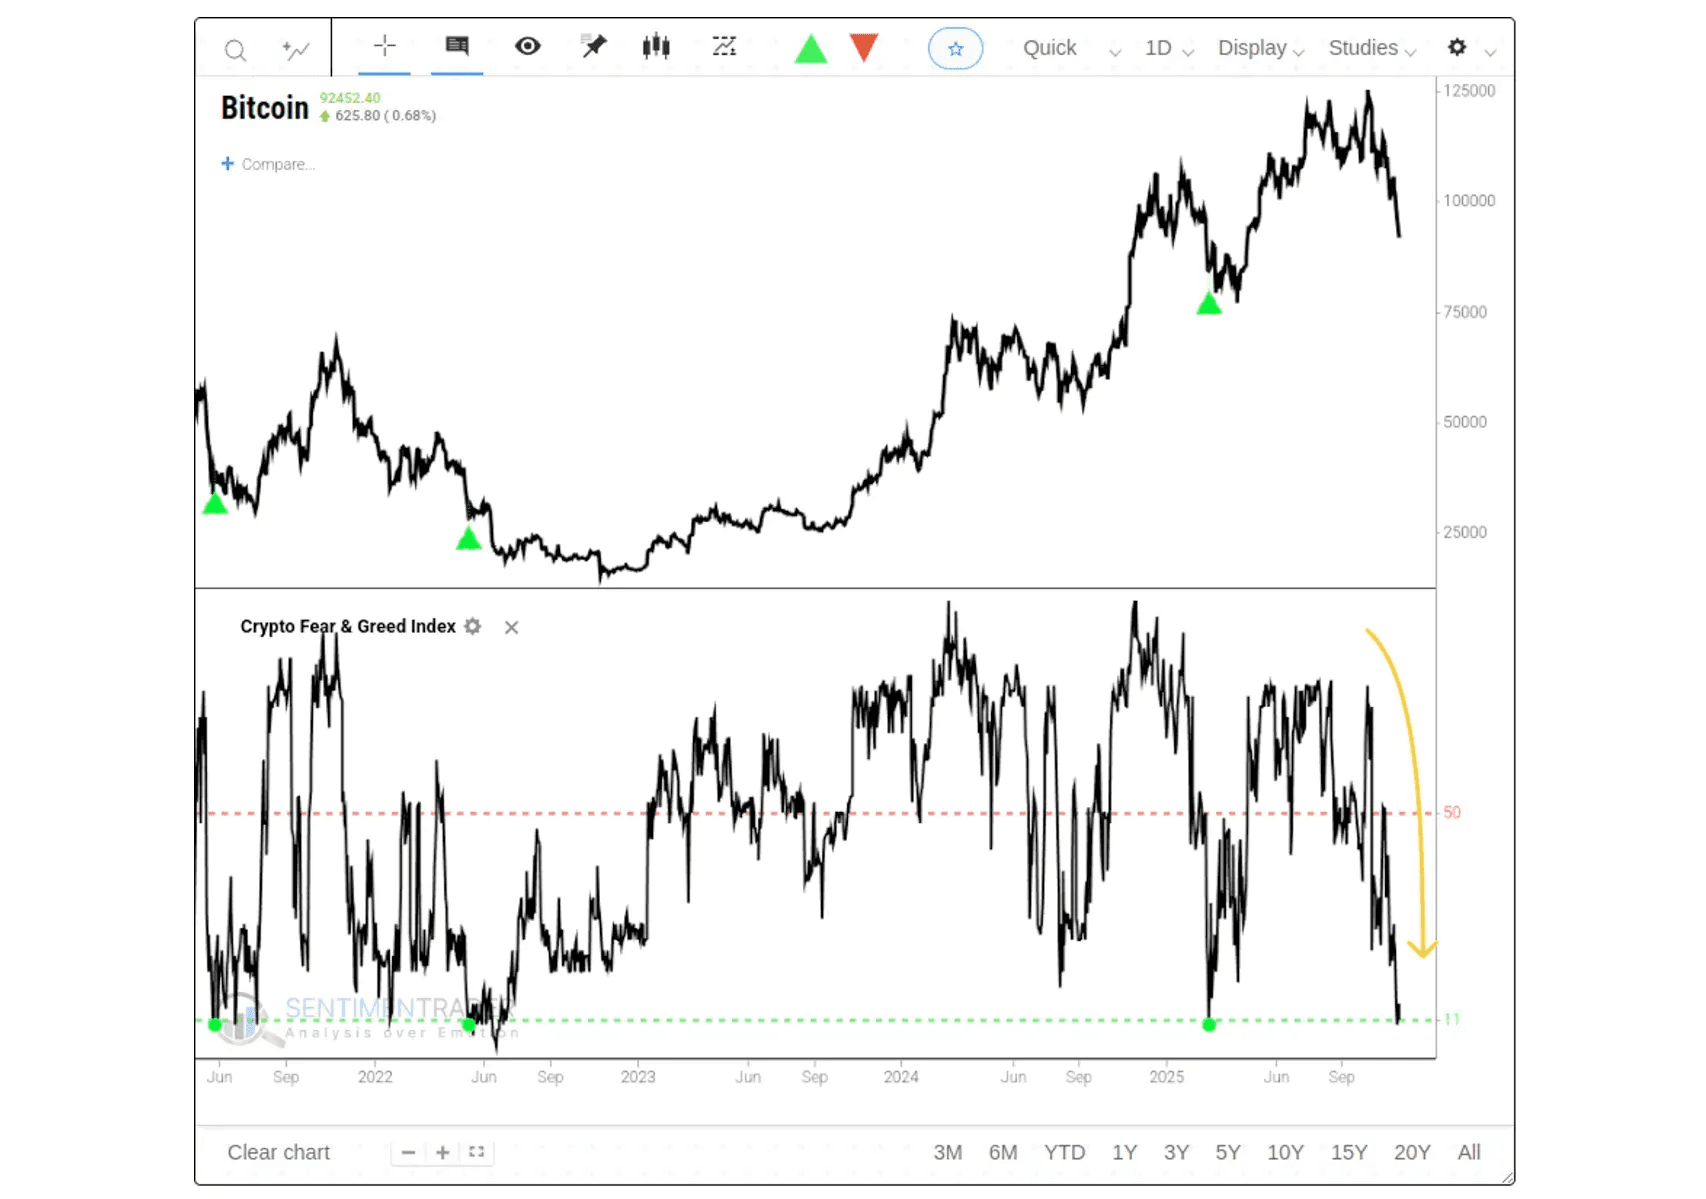
Fear is now high. The Crypto Fear and Greed Index is near extreme fear. When it hits these levels the bottom is usually closer, not further.
But even if the market is oversold, bottoms take time. They are messy. Full of volatility. You do not want to rush in and try to catch the exact low. V-shaped reversals are rare. Instead you want to wait for confirmation.
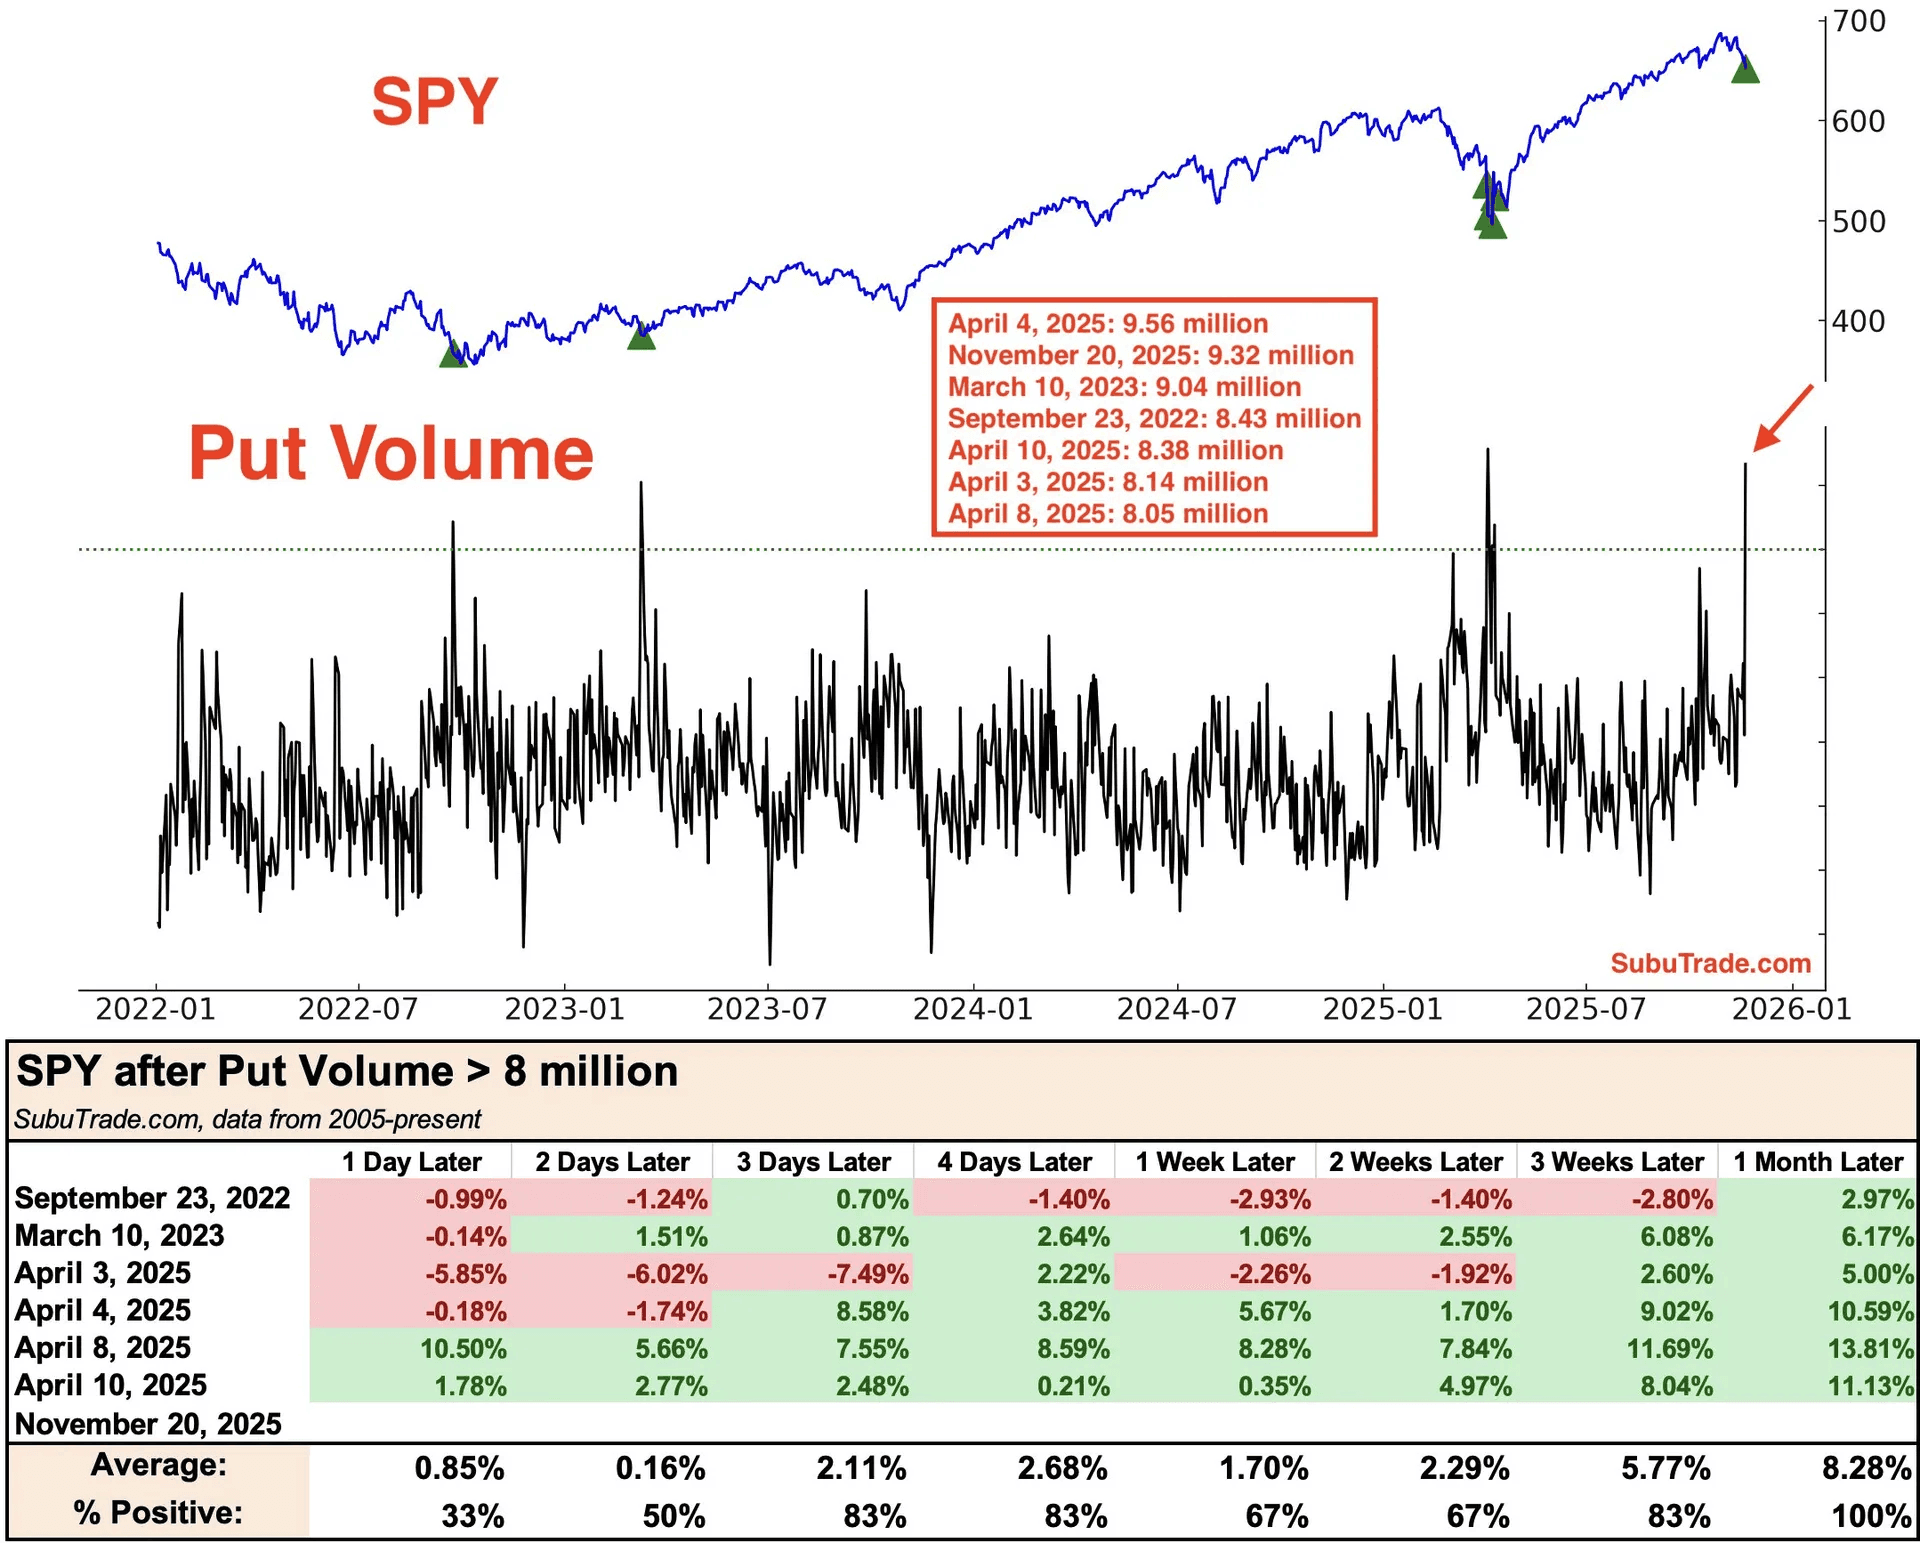
Another sign that we are getting closer is that put volume jumped to the second highest reading ever on Thursday. Big spikes like this often happen near market bottoms.
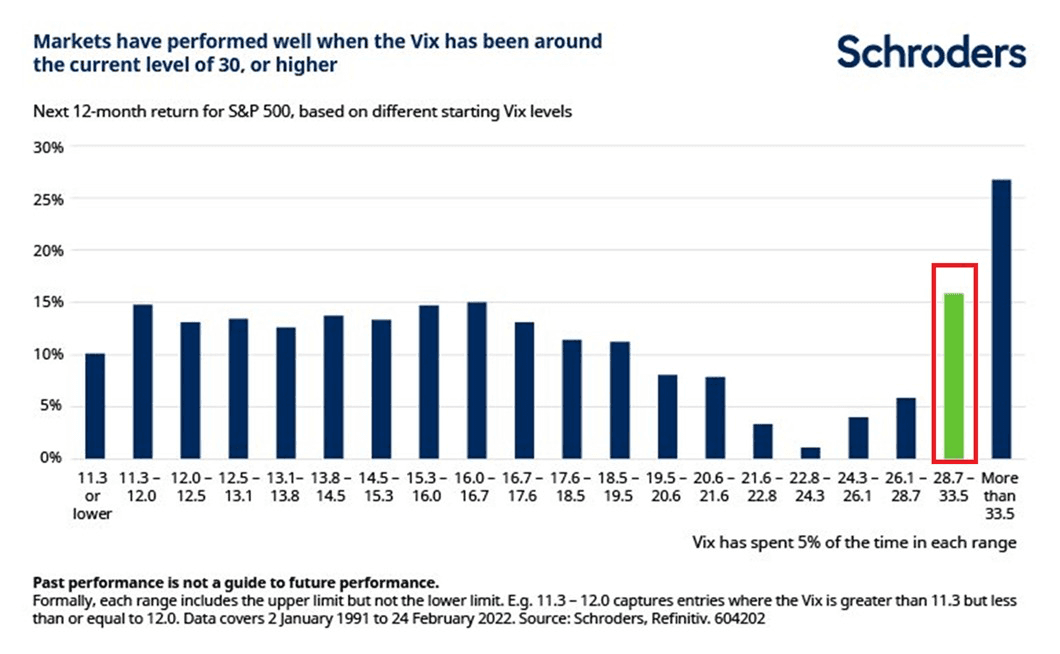
The VIX also touched 28 which is the highest since April.
When the VIX reaches levels like this the S&P 500 has historically delivered very positive forward returns.
At VIX levels between about 28 and 33 the next 12 months returned about 16% on average. When it moved above 33 the average return was more than 27%.
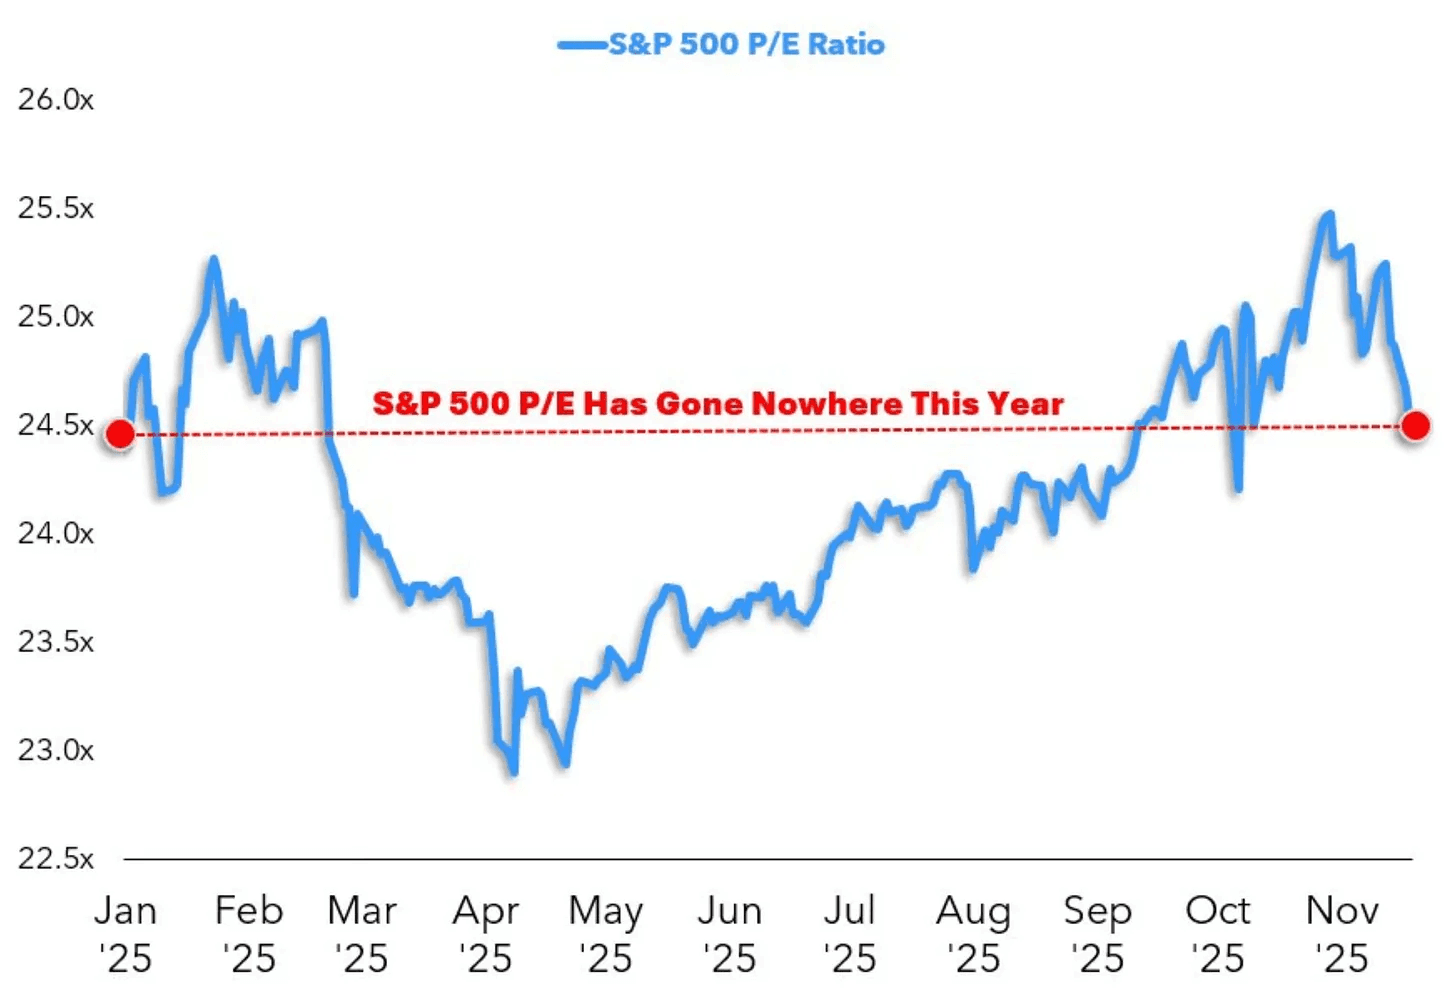
It’s hard to call it a bubble when the S&P 500 price to earnings ratio has gone nowhere over the last year.
So when prices are up but PE is flat it just means that fundamentals are catching up just as fast as price.
Earnings momentum is still strong, which means companies keep raising their profit expectations. Profit guidance momentum just hit its highest level since 2021, showing that confidence is improving across the board.
The big jump in 2026 estimates makes this even clearer. And this usually happens when demand is solid.

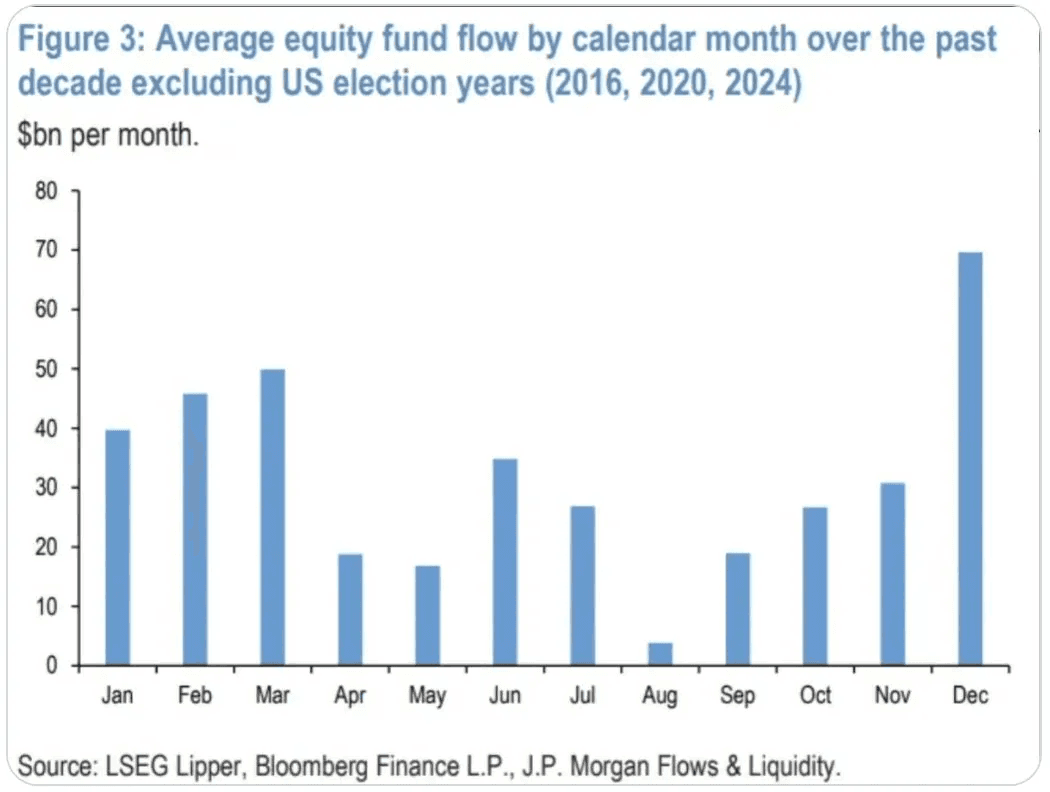
December tends to bring an increase in equity fund inflows. If that repeats we could see some fuel for a year end rally. Especially since a lot of funds need to catch up on their performance.
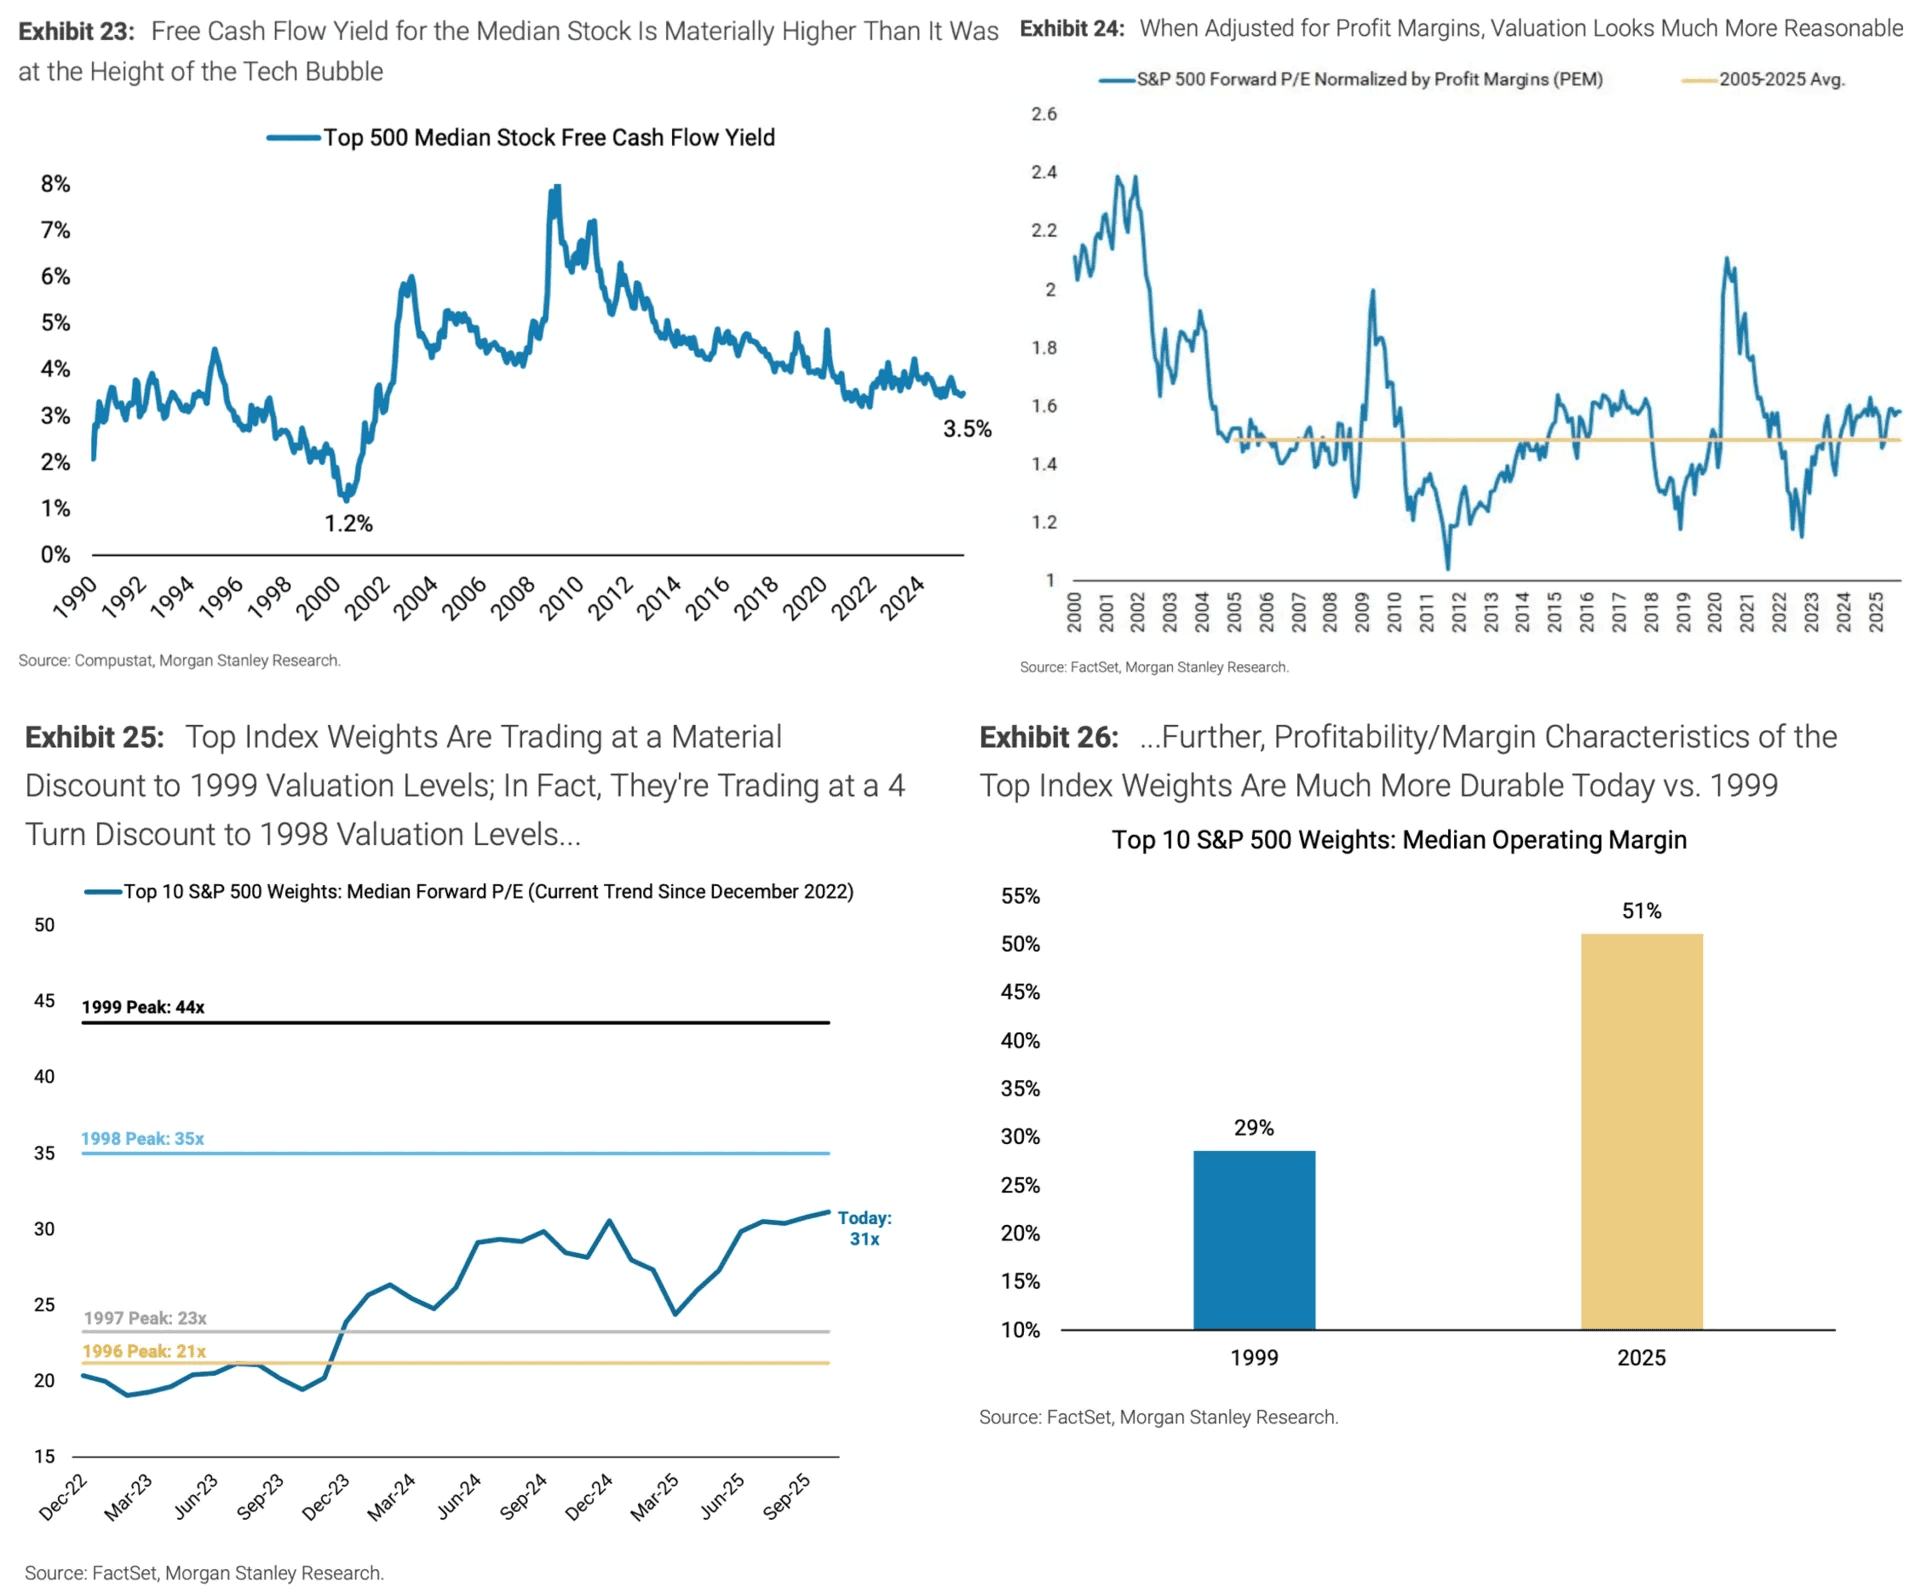
On the fundamental side, some investors worry that the AI spending boom will end like the 1999 to 2000 bubble.
But there are big differences.
Back then you had weak earnings, weak balance sheets and no proven demand.
Today you have record cash flows, real customers, and real economic impact across every sector. This time it’s being built on profits, instead of promises.
So in short, the near term is still messy. Prepare for more volatility, and more forced capitulation. But the long term growth story is intact. This correction will create a ton of new opportunities just like it did in April. The bottom will eventually come. And there are signs we’re getting closer. But right now the key is to stay patient, let the market reset, and most important be prepared.
Previous Updates
View All
- Weekly Market Update: All Eyes On the Mag 7
- Weekly Market Update: Earnings Season Is Here
- Market Update: The FinTech Comeback
- Weekly Market Update: Halftime
- Market Update: The Robots Are Coming
- Weekly Market Update: The Broadening
- Market Update: The Break Point
- Weekly Market Update: Patience
- Market Update: The Memory Crunch
- Weekly Market Update: The First Trillionaire
- Market Update: In Focus
- Weekly Market Update: Deleveraging
- Market Update: A Change of Character