Go Back

Lin
Weekly Market Update: A Bifurcated Market
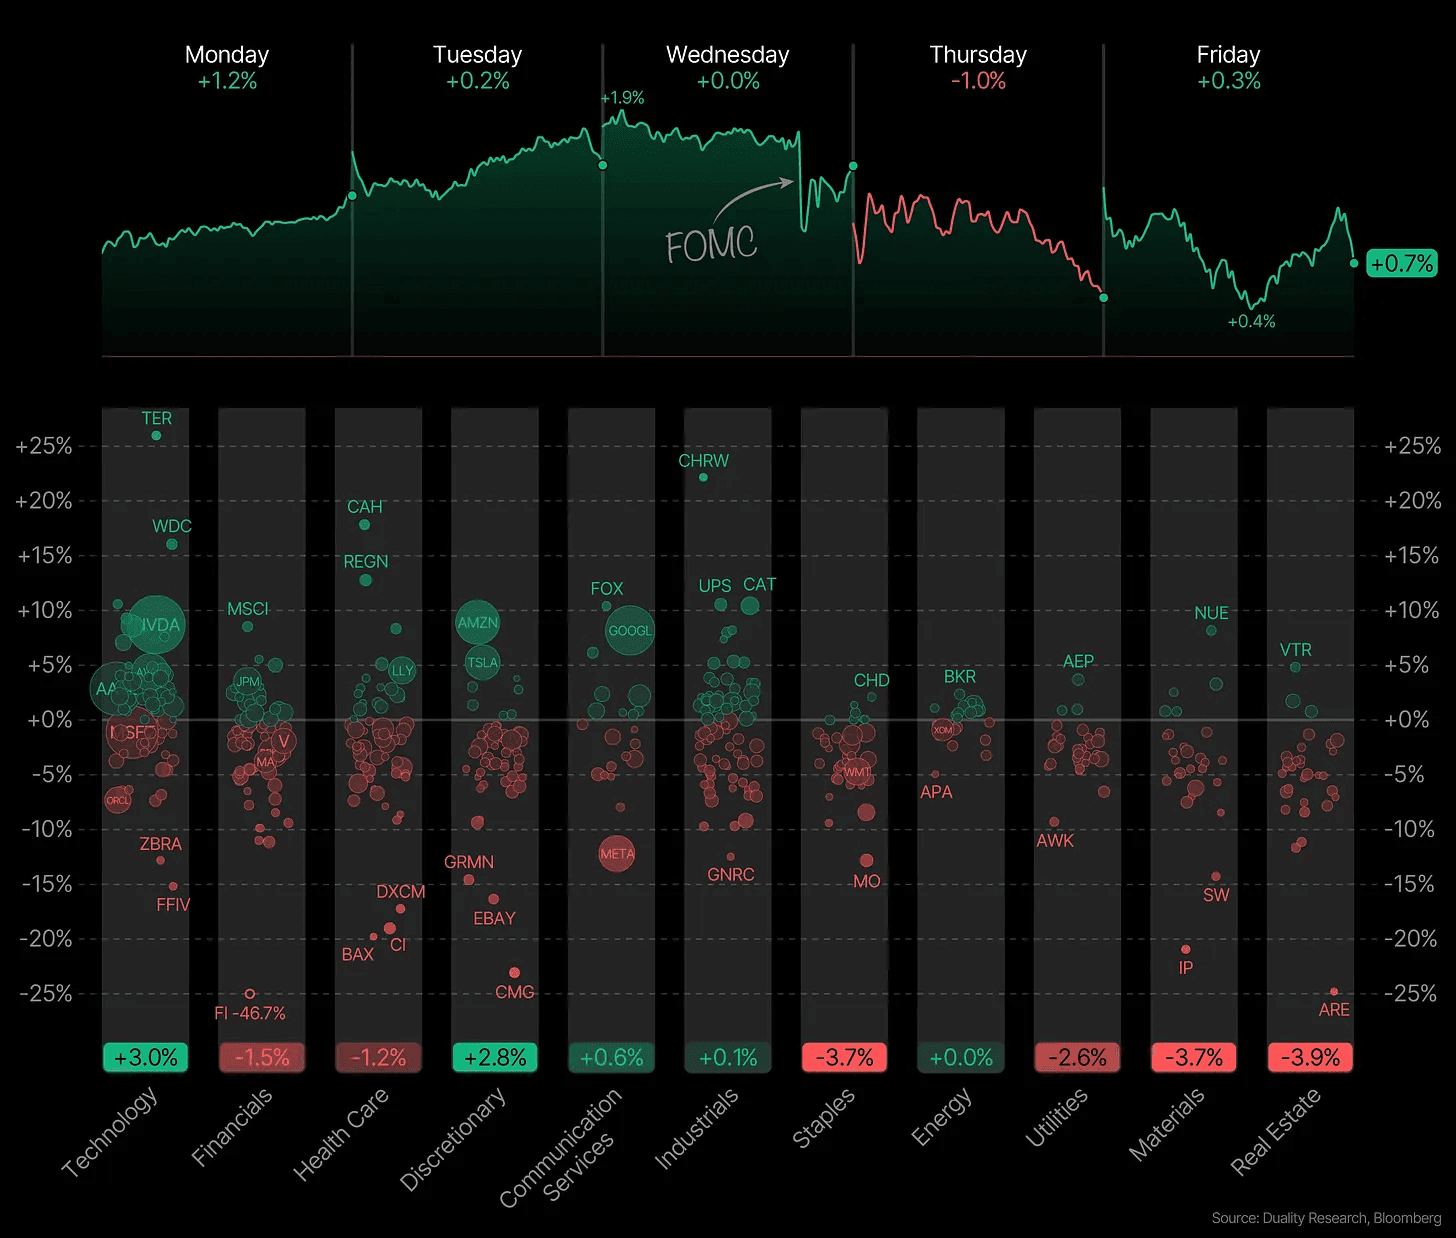
A lot happened this week. The Fed cut rates and five of the Mag 7 delivered earnings, sending the major indexes to new all-time highs before volatility returned again.
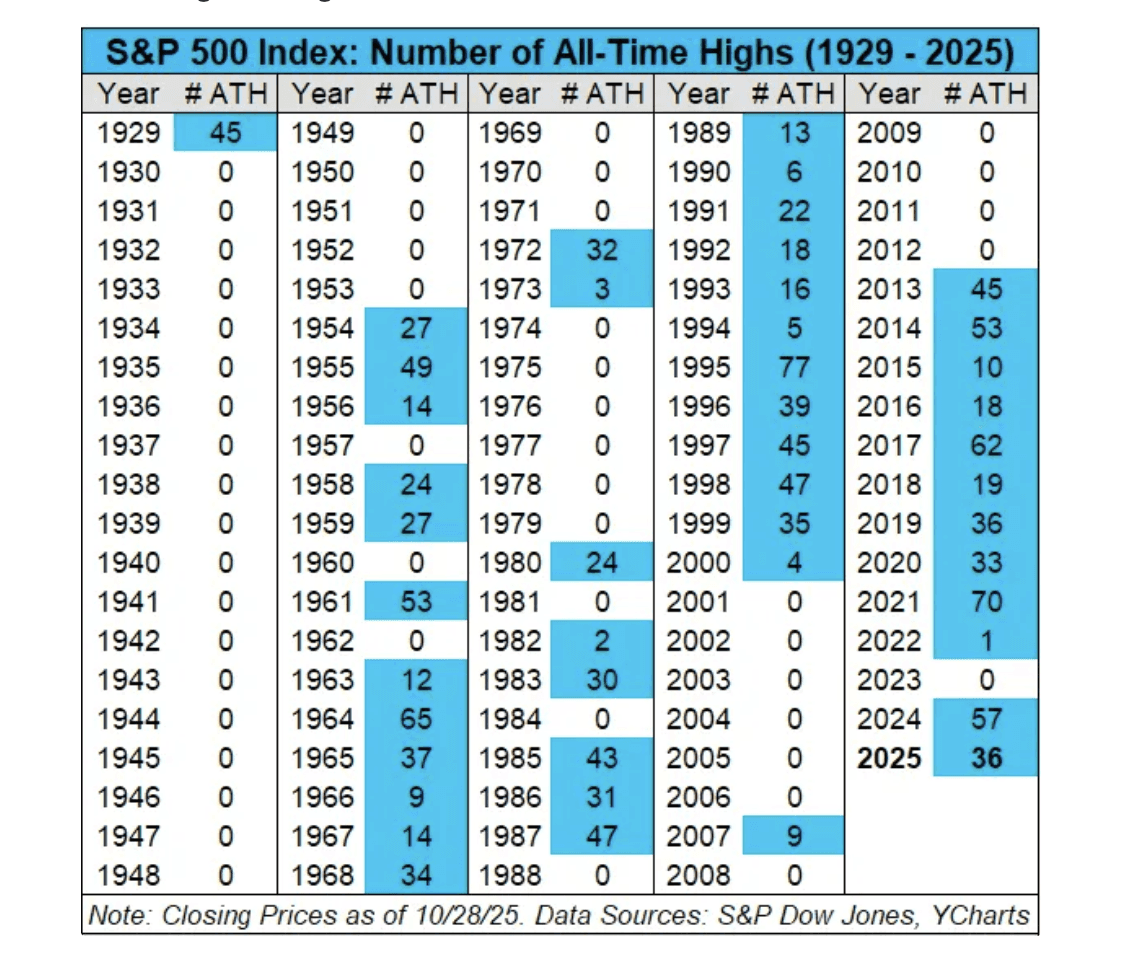
We’ve now hit the 36th all-time high this year.
And as I’ve said again and again, all-time highs are not something to fear. They’re one of the most bullish signals the market can give. Markets don’t make new highs in weak environments. And markets that make new highs tend to continue making new highs.
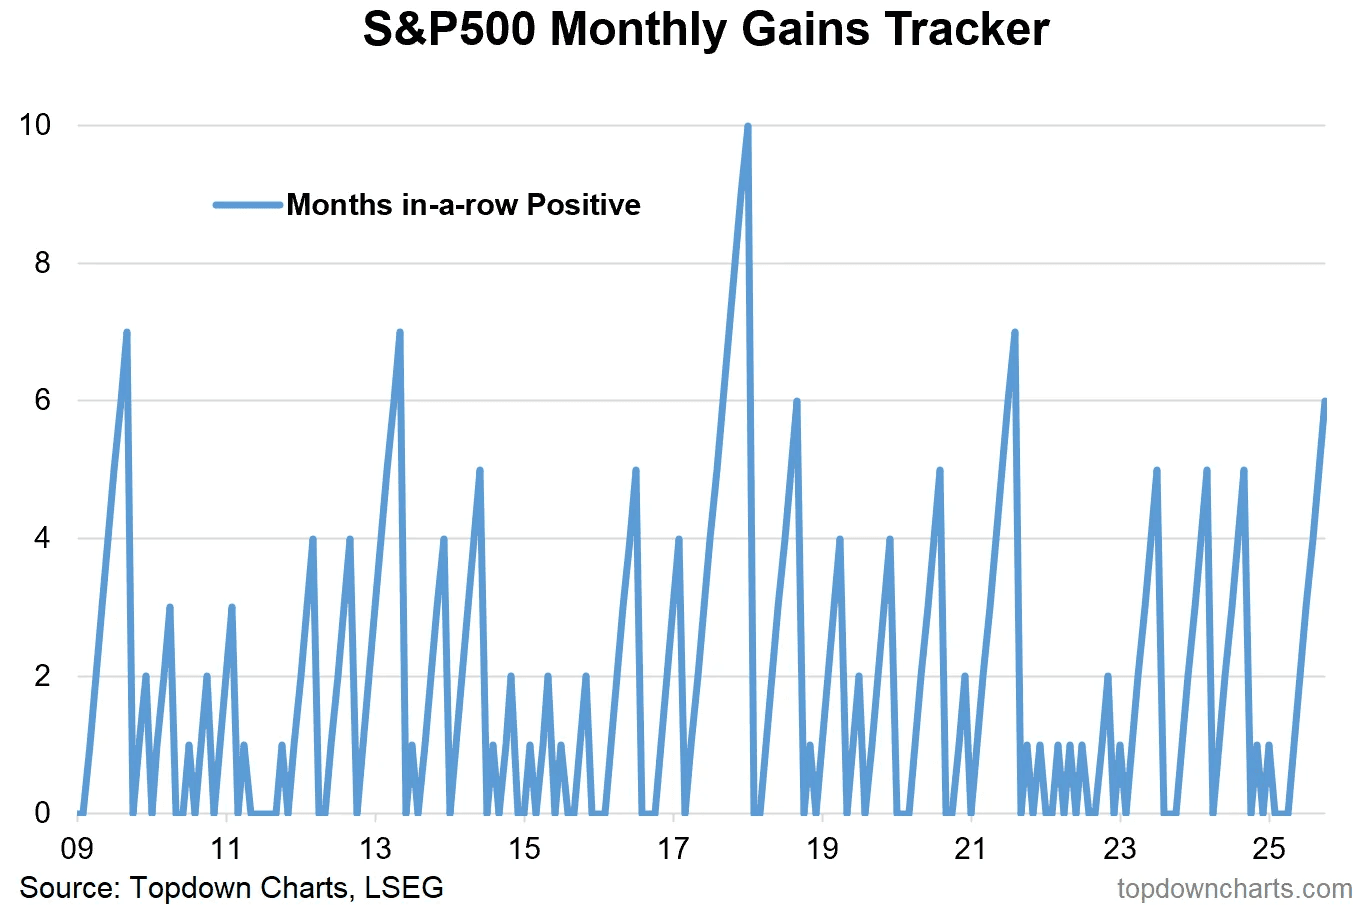
The Nasdaq was up more than 4% for the second month in a row, marking its seventh straight monthly gain. The S&P 500 and the Dow also extended their winning streaks to six months. For the Dow, that’s the longest stretch since 2018.
But this streak won’t last forever. It will eventually end. When they do end, the pullback often comes quickly because long stretches of strength can make investors overconfident and complacent. That complacency is usually what creates sharp corrections.
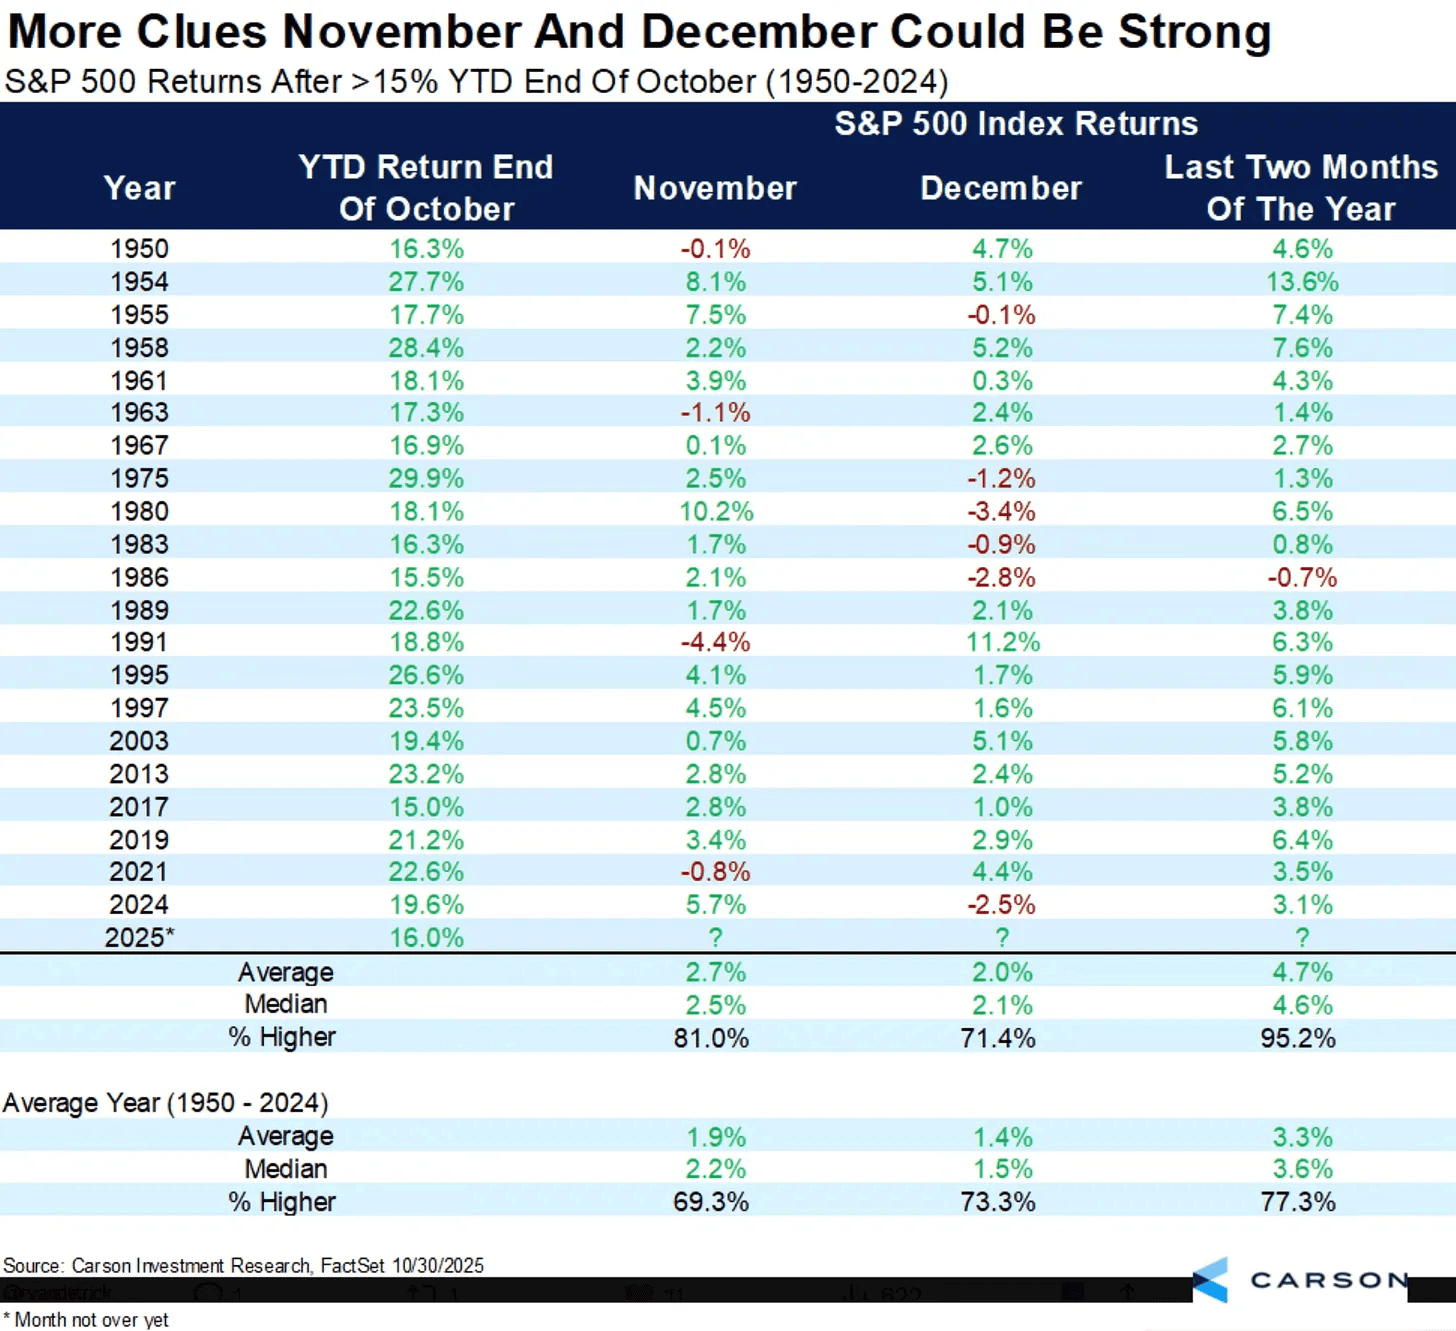
November is historically one of the strongest months of the year. It’s positive about 70% of the time and holds the highest average monthly return across the calendar. But it gets even more interesting when you look at how November behaves after a strong year.
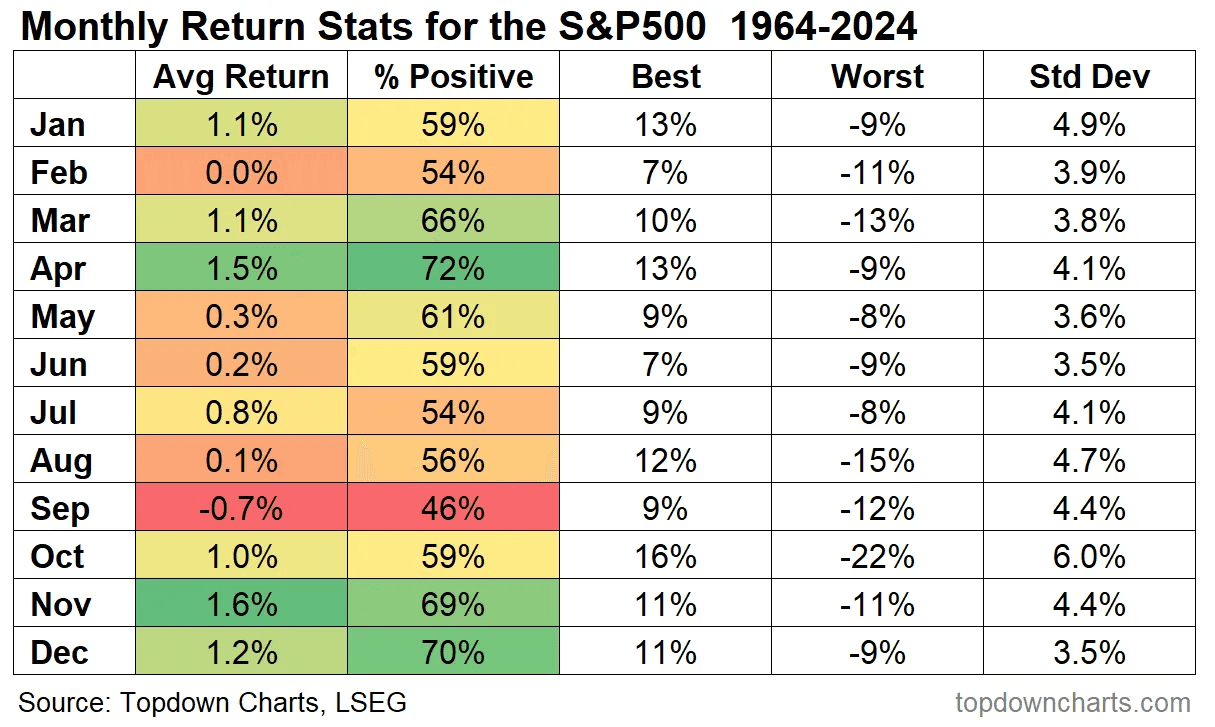
When the market comes into November already up 15% or more year-to-date, November and December they tend to outperform. In those scenarios November has averaged a 2.7% gain vs the usual 1.9%. And even more impressive: the November–December stretch has finished higher 20 out of the past 21 times when that happened.
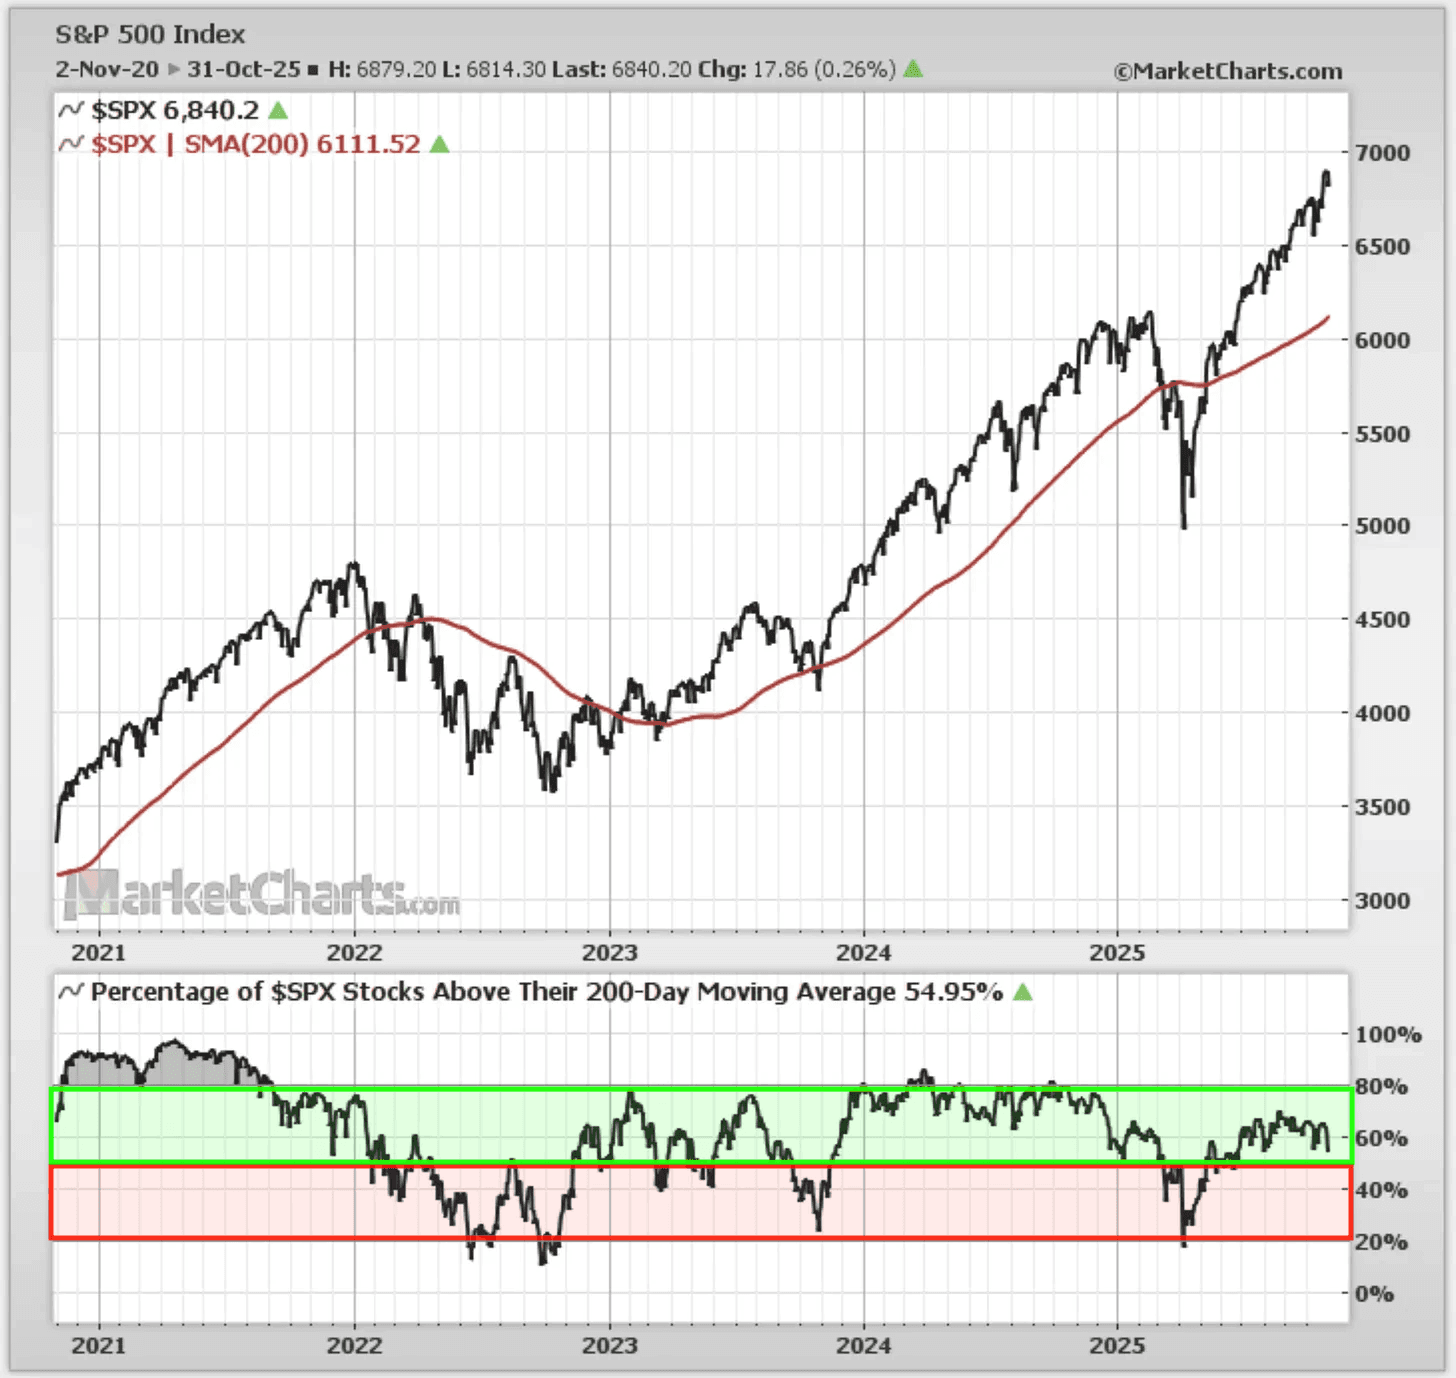
On the surface, the major indices look great. Prices are well above their 200-day moving average, momentum is positive, and the market has largely shrugged off any negative headlines. But when you look beneath the surface, the picture is starting to look a little less convincing.
Fewer and fewer stocks are participating in the rally. Right now, only about half of S&P 500 stocks are trading above their 200-day moving average. That’s the weakest breadth reading since May. In other words, the trend is still up, but it’s being carried by a smaller group of stocks.
That doesn’t break the bull case, but it does make the market more sensitive to any weakness in the leaders.
That was surprising on its own. But this next piece is even more so.
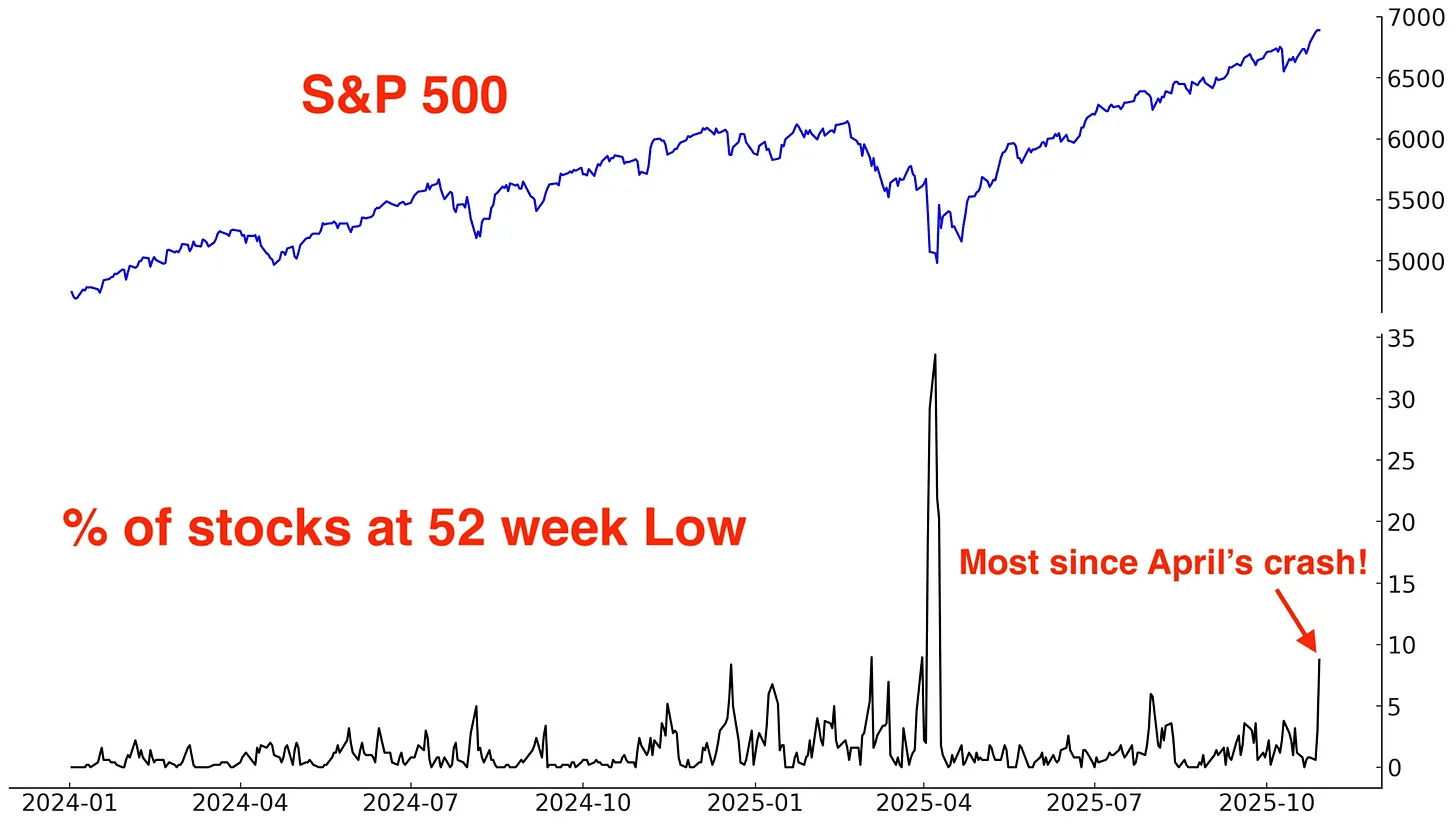
The number of stocks hitting 52-week lows is now the highest it’s been since April. And that’s happening while the major indices are sitting near all-time highs. Those two things usually don’t occur together.
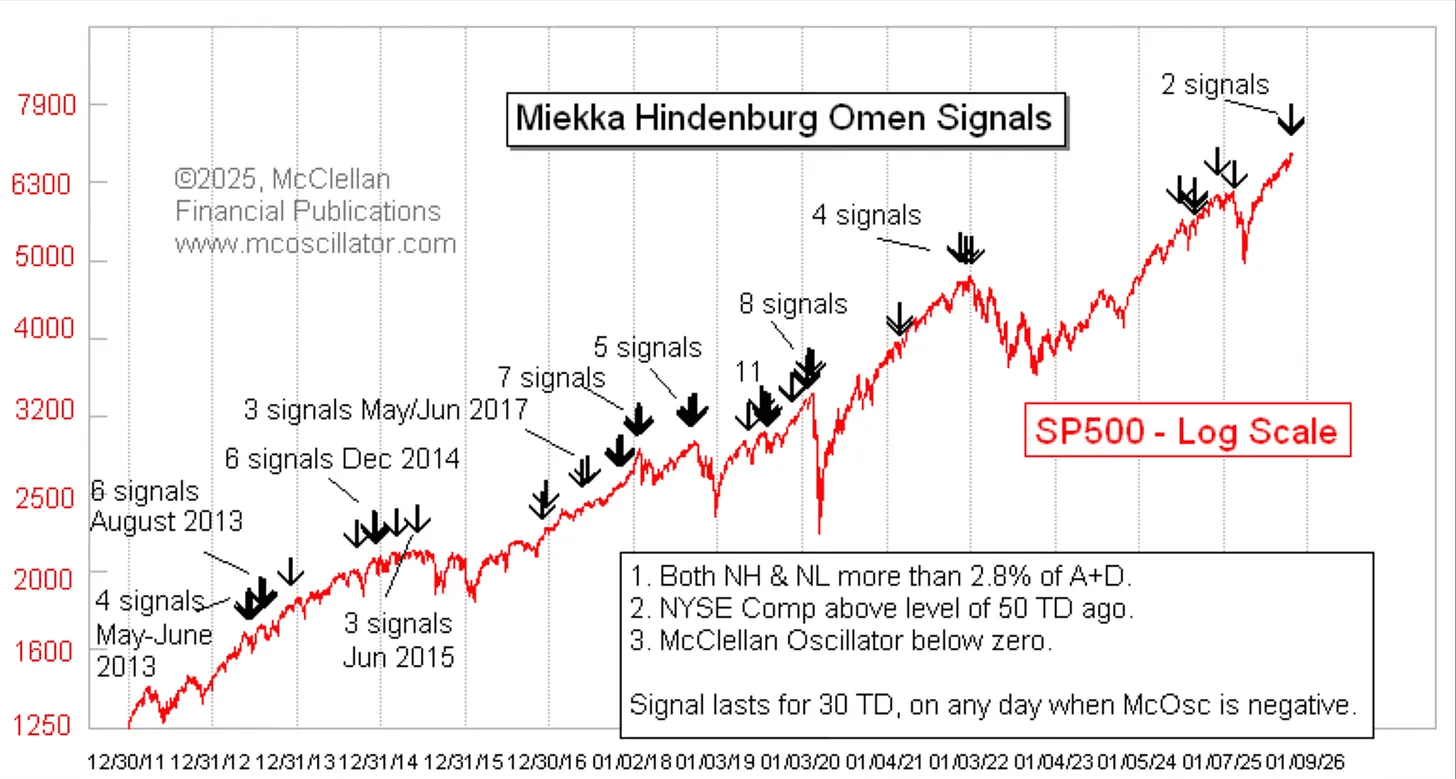
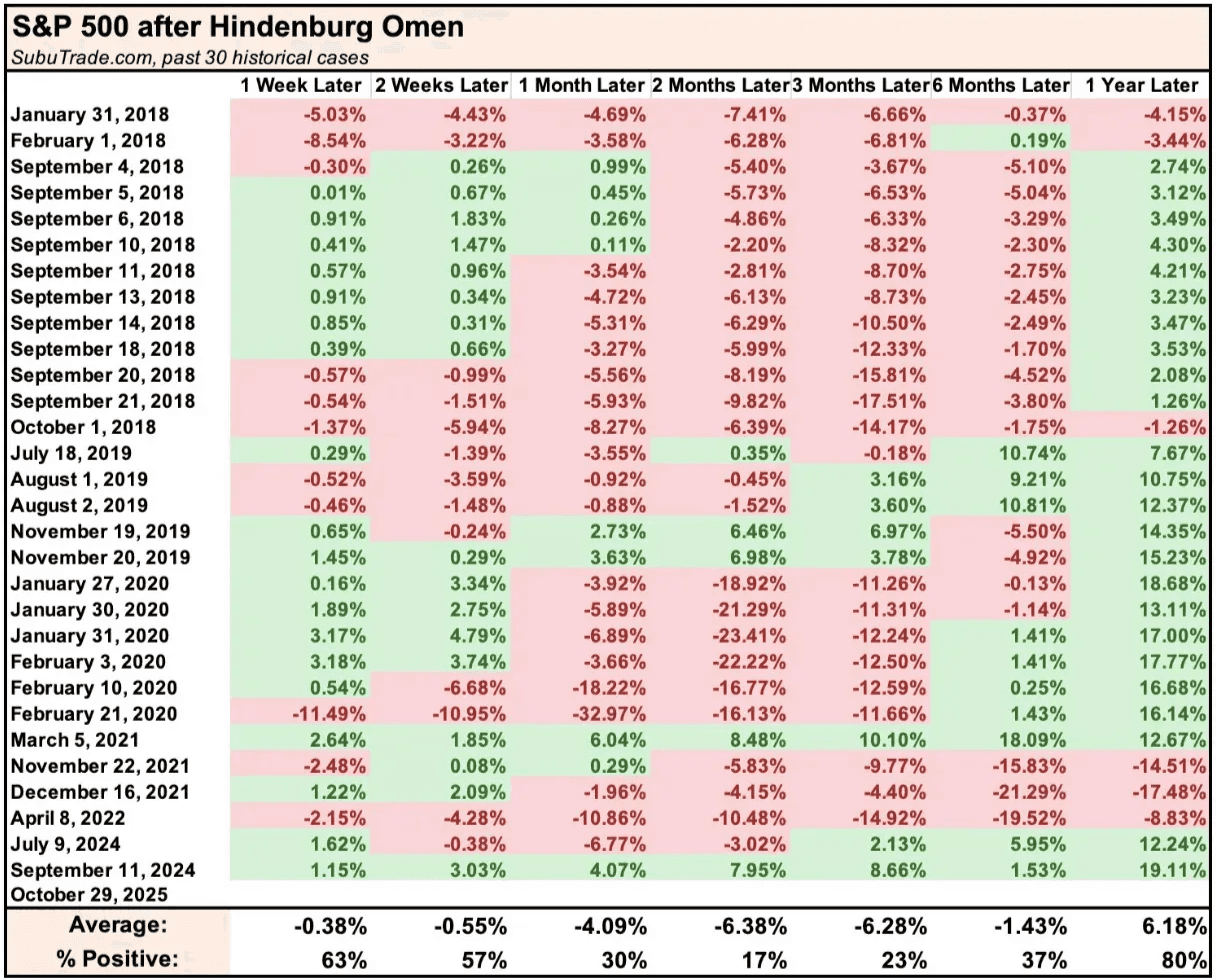
You may see dramatic headlines about the Hindenburg Omen being triggered. It sounds like a crash alarm, but it’s really not that dramatic. All it means is that a lot of stocks are hitting new highs and a lot are hitting new lows at the same time while the market is still in an uptrend. In simple terms, it’s just another sign that breadth is weakening.
Yes, the signal has appeared before major corrections. But it has also shown up many times when nothing significant followed. It’s not a prediction of a crash. It’s simply a reminder that the market is being driven by fewer names, and that makes it more fragile.
Tech is the only sector that has actually outperformed the S&P 500 over the past six months. And it is not just slightly ahead. It is leading by a very wide margin.
And there’s a reason for that…
Previous Updates
View All
- Weekly Market Update: Earnings Season Is Here
- Market Update: The FinTech Comeback
- Weekly Market Update: Halftime
- Market Update: The Robots Are Coming
- Weekly Market Update: The Broadening
- Market Update: The Break Point
- Weekly Market Update: Patience
- Market Update: The Memory Crunch
- Weekly Market Update: The First Trillionaire
- Market Update: In Focus
- Weekly Market Update: Deleveraging
- Market Update: A Change of Character
- Market Update: The Next Quantum Leap