Go Back

Lin
Platform Update: Version 1.2
Many of you have probably seen it already, but the new market dashboard is live. There are still a lot of things to add and refine but I think this version is good enough to share.
Here’s a quick walkthrough:
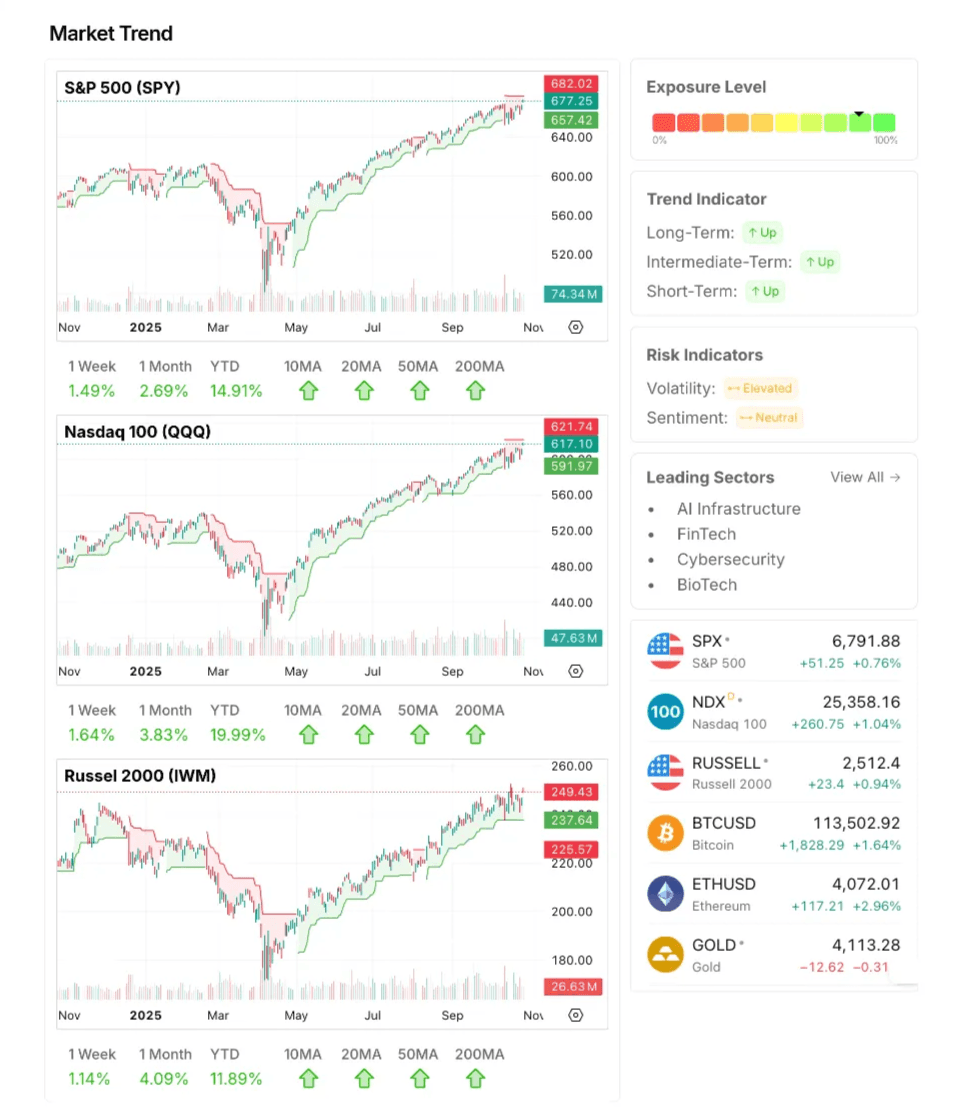
1. Market Trend
The market trend matters because most stocks tend to move in the same direction as the overall market. When the market is up, breakouts and new positions have a much higher chance of working. When the market is falling, even strong companies usually struggle.
If the market is in an uptrend, it generally makes sense to be more open to taking new positions and letting winners run. In a downtrend or correction, it’s usually better to be more selective, take smaller positions, and focus on protecting capital.
Put simply, it’s easier to go with the current than against it. Riding the trend doesn’t mean everything will work, but it definitely improves the odds.
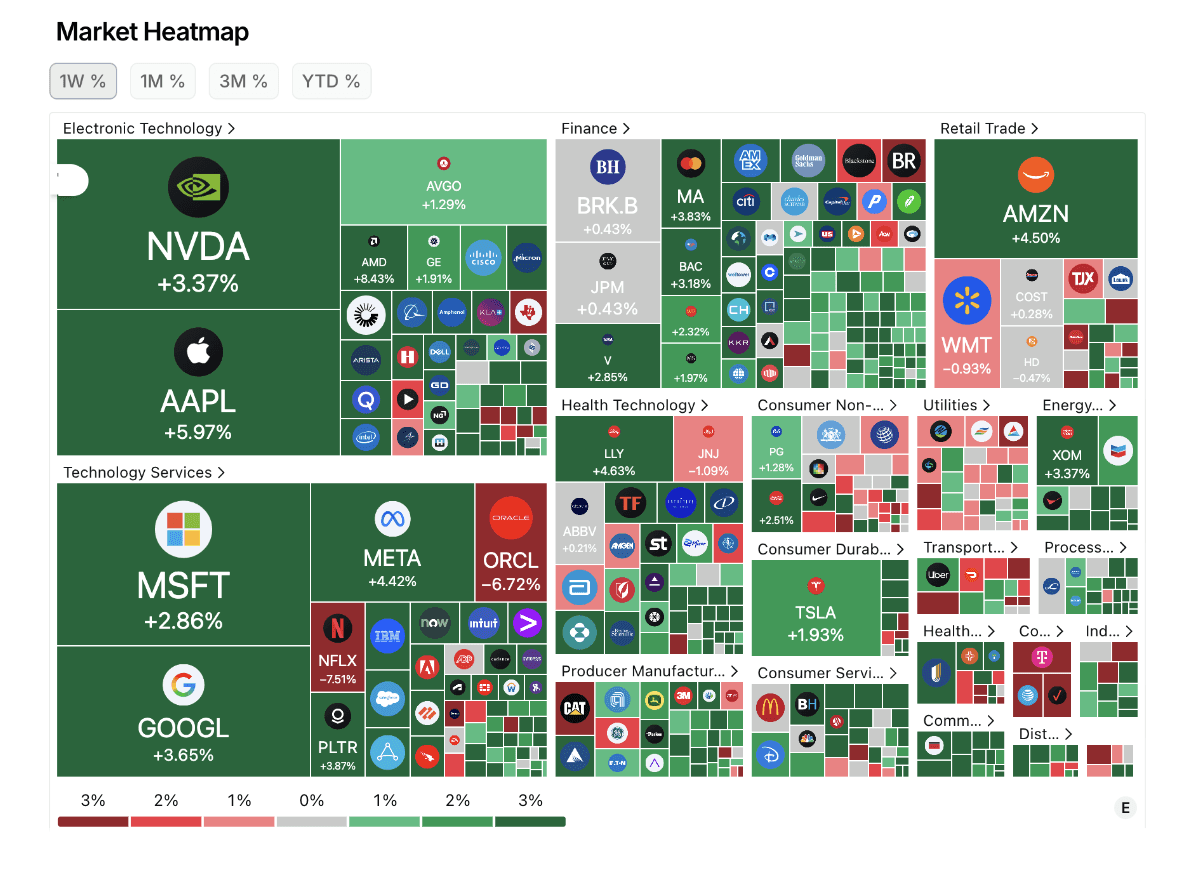
2. Market Heatmap
The market heatmap gives you a quick snapshot of what’s happening across different sectors.
3. Sector Overview
The sector overview helps you see which parts of the market are leading and which are falling behind. It makes it easier to understand where the strength is, and where opportunities might be showing up. It helps you spot trends, avoid weak areas.
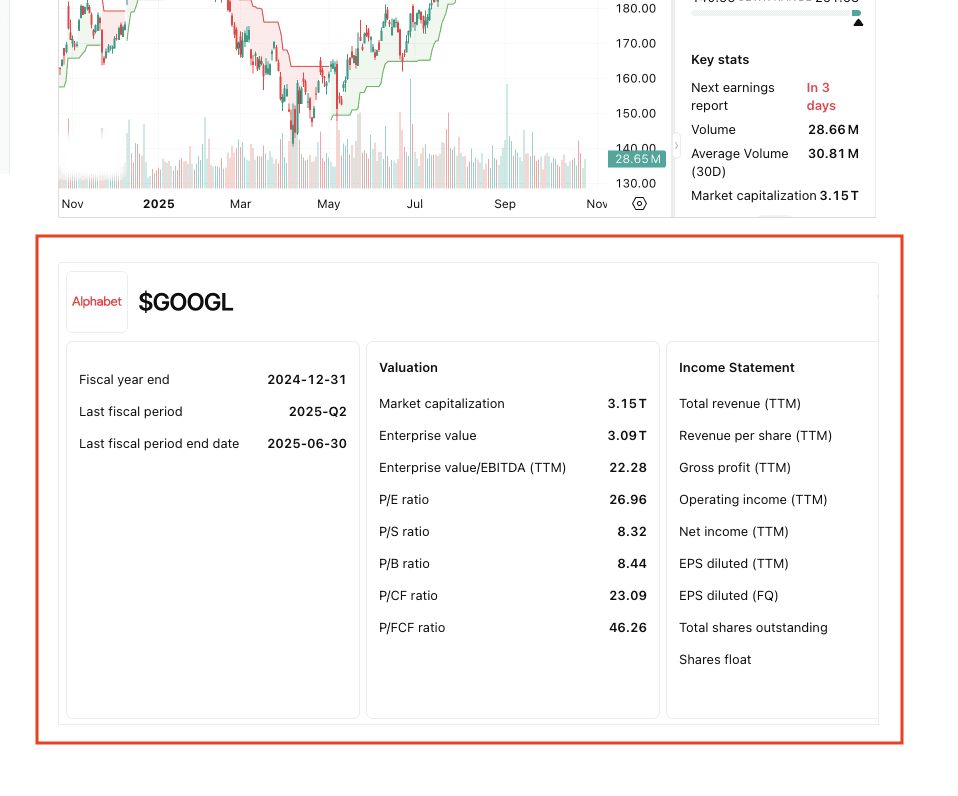
Bonus:
In case you haven’t seen it yet, the first part of the financial data section is live as well. Here’s an example of how it looks.
Previous Updates
View All
- Weekly Market Update: Earnings Season Is Here
- Market Update: The FinTech Comeback
- Weekly Market Update: Halftime
- Market Update: The Robots Are Coming
- Weekly Market Update: The Broadening
- Market Update: The Break Point
- Weekly Market Update: Patience
- Market Update: The Memory Crunch
- Weekly Market Update: The First Trillionaire
- Market Update: In Focus
- Weekly Market Update: Deleveraging
- Market Update: A Change of Character
- Market Update: The Next Quantum Leap