Go Back

Lin
Weekly Market Update: TACO Strikes Back
There is certainly no dull moment in the markets.
The conflict between the US and Iran has been going on for over 3 weeks now, and there is still no clear end in sight.
This back and forth creates uncertainty. And markets hate uncertainty.
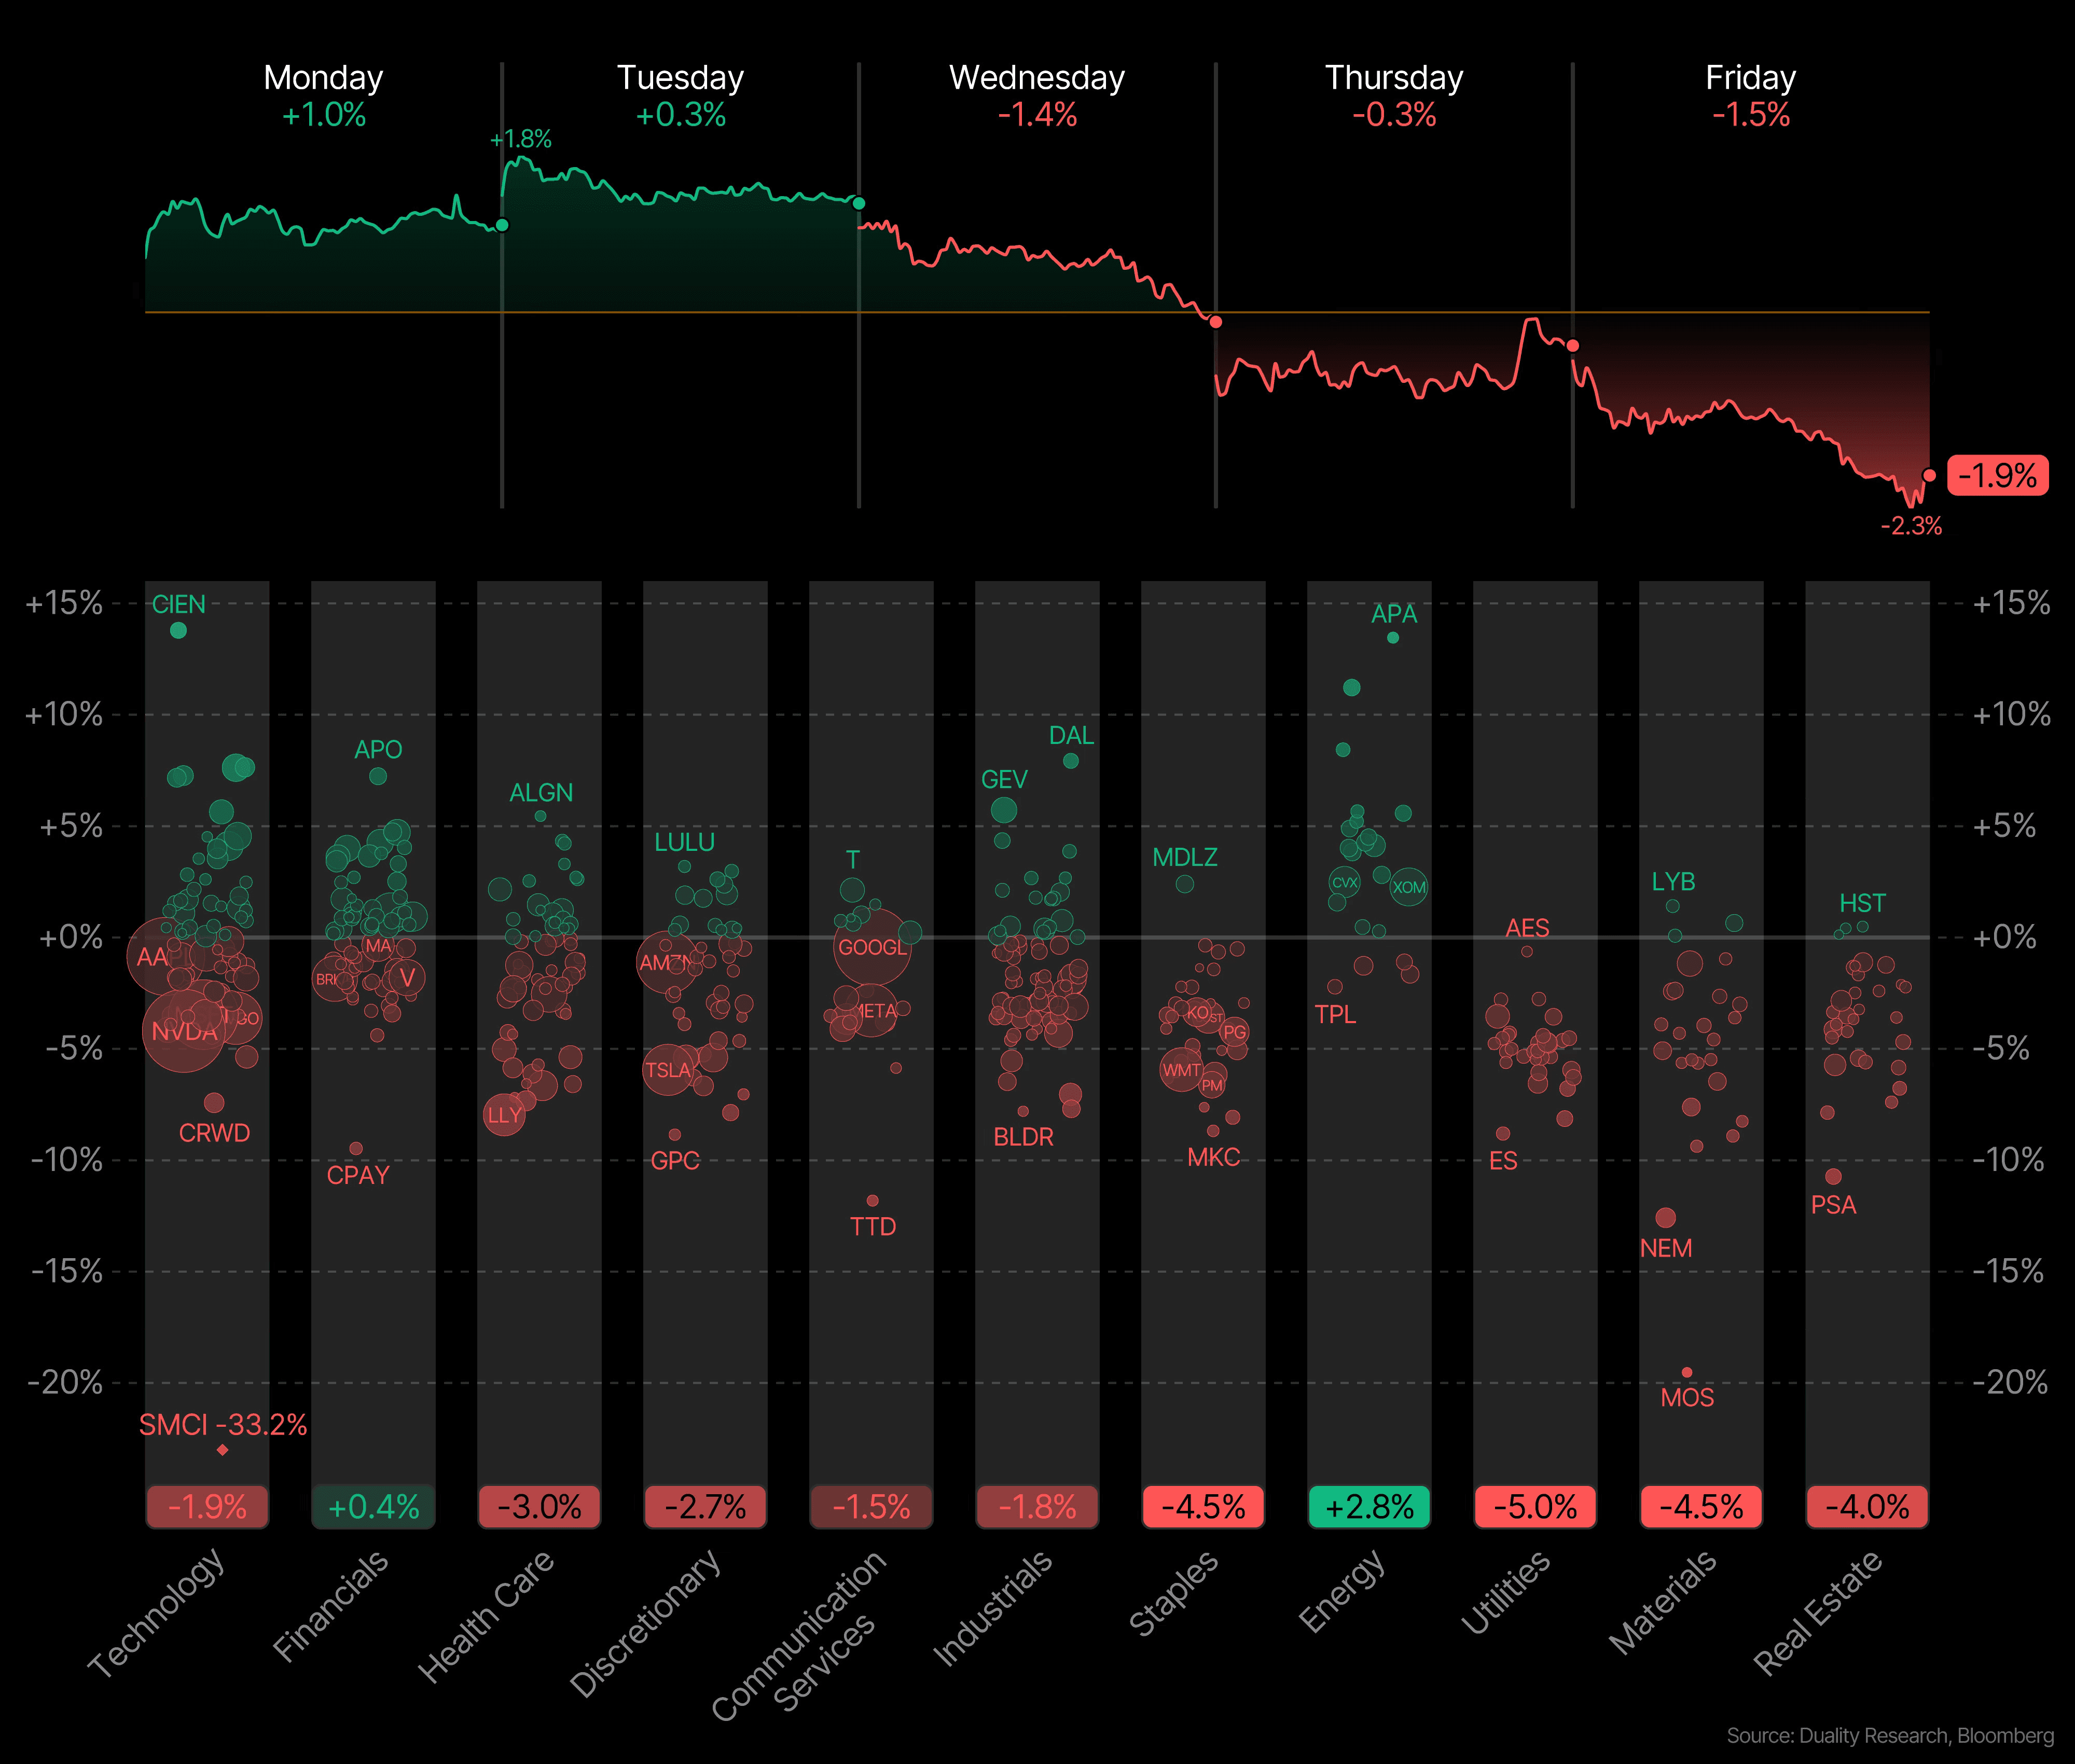
As a result, last week the S&P 500 dropped 1.9% and closed at 6,506. That marks 4 red weeks in a row. We haven’t seen that in over a year. The Nasdaq and Dow both fell 2.1%, and small caps didn’t help either. The Russell 2000 was down 1.7%.
Then Trump issued an ultimatum to reopen the Strait of Hormuz, warning that the US would strike Iran’s power and energy systems otherwise. The conflict was on the verge of escalation.
Shortly after, Trump claimed there had been “productive” talks and that there would be no further escalation. Minutes later, Iran said there had been no direct talks. However, it appears that Turkey, Egypt, and Pakistan have been relaying messages between the US and Iran over the past 2 days. A classic TACO move.
So while the end of this situation is still unclear, it is at least a step in the right direction. The markets are reflecting that with a strong green reversal. Even though it was impossible to know exactly when or if it would happen, this move was not entirely unexpected.
From last week’s market update:
“This may not be the right environment for aggressive dip buying yet. It’s impossible to know when the market will finally bottom. There are a few signs suggesting we might be getting close.
But with all that in mind, it’s clear that once this fog of war clears and the market can finally look ahead, there will likely be a strong relief rally.”
Now the big question is whether this move is sustainable and marks a potential bottom, or if it’s just a one-hit wonder.
Let’s explore.
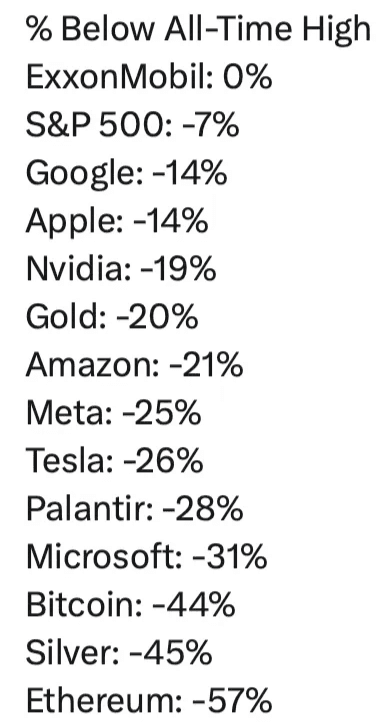
With everything going on around the world and in the markets, it is still remarkable that the S&P 500 is only down 7% from its highs. The market has been pricing in a short conflict and a quick resolution to the oil situation. For now, that remains the base case going forward.
But beneath the surface, there has been some serious damage. This would match many of the most severe bear markets in the past.
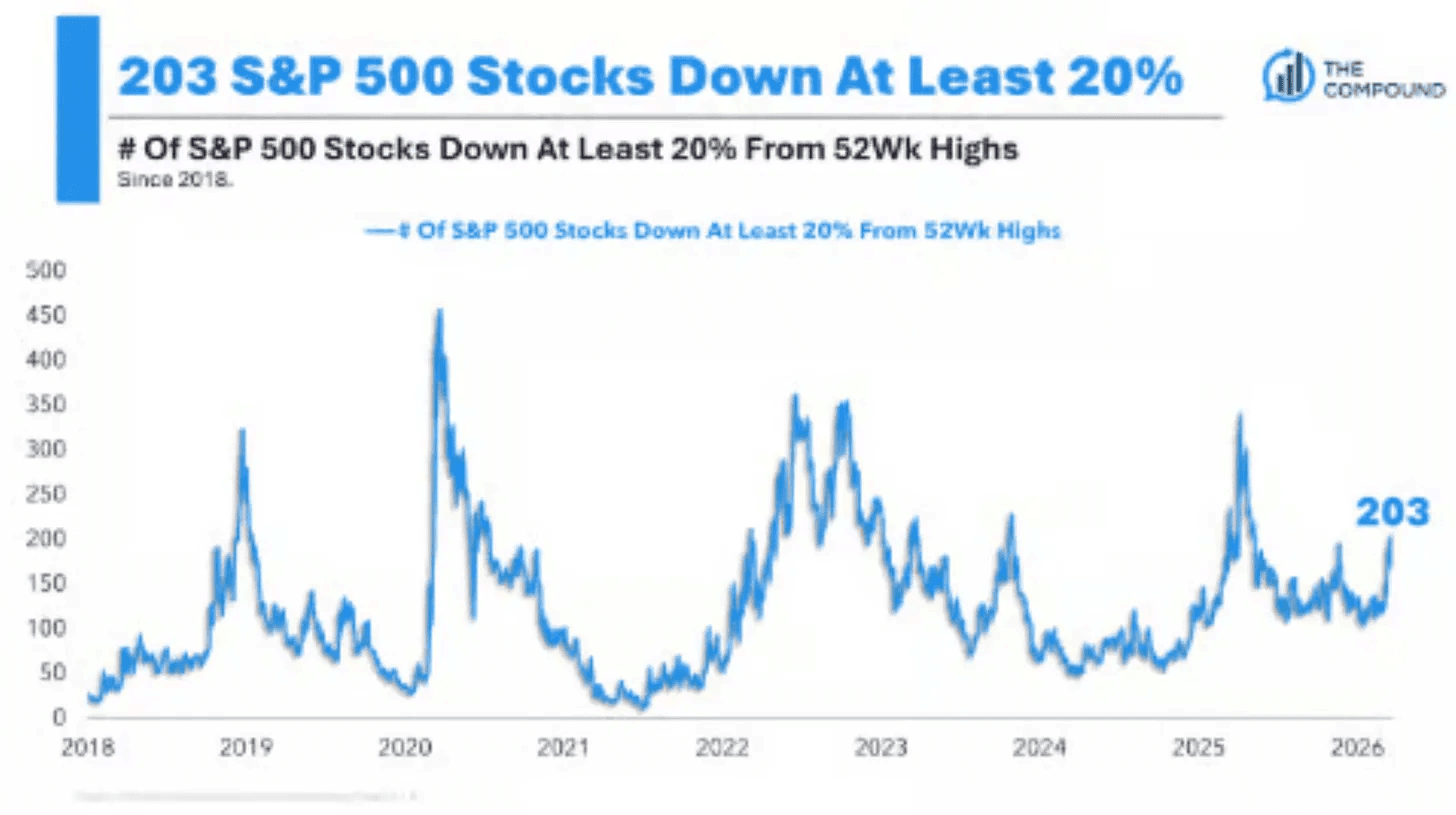
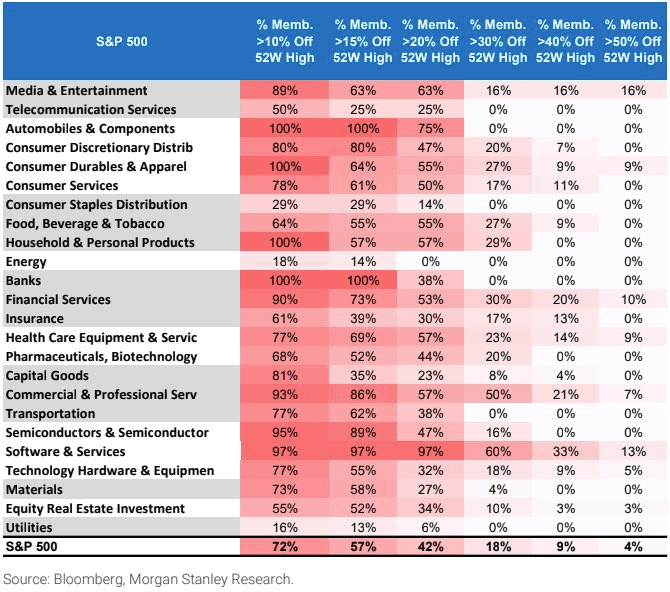
Almost half of the stocks in the S&P 500 are already in bear market territory, meaning about 41% of the index is down 20% or more from their 52-week highs.
Not surprisingly, software is the worst-performing sector, with 97% of its companies down 20% or more. Just behind that are automobiles at 75% and media &entertainment at 63%.
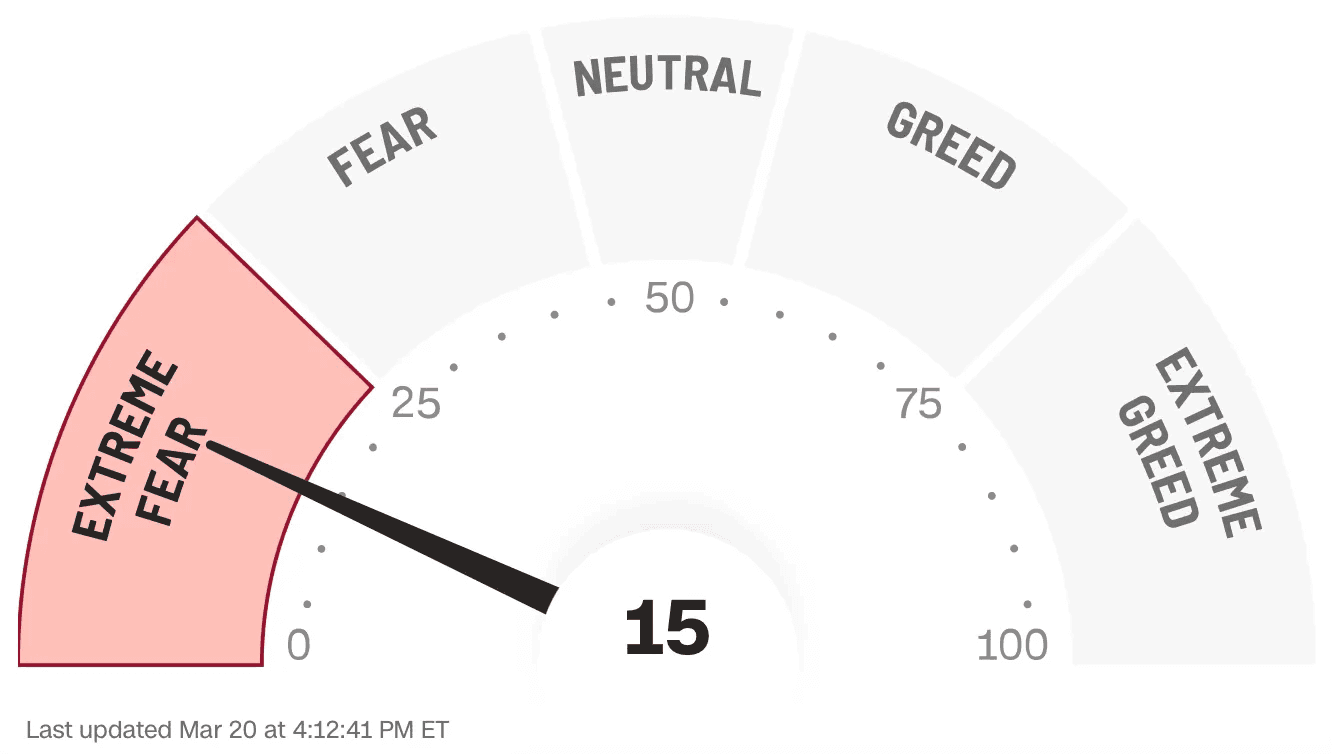
If you want to know how investors are feeling right now, the answer is simple: terrified. The CNN Fear & Greed Index closed the week at 15, deep in Extreme Fear territory. That is the most fearful reading we’ve seen since November.
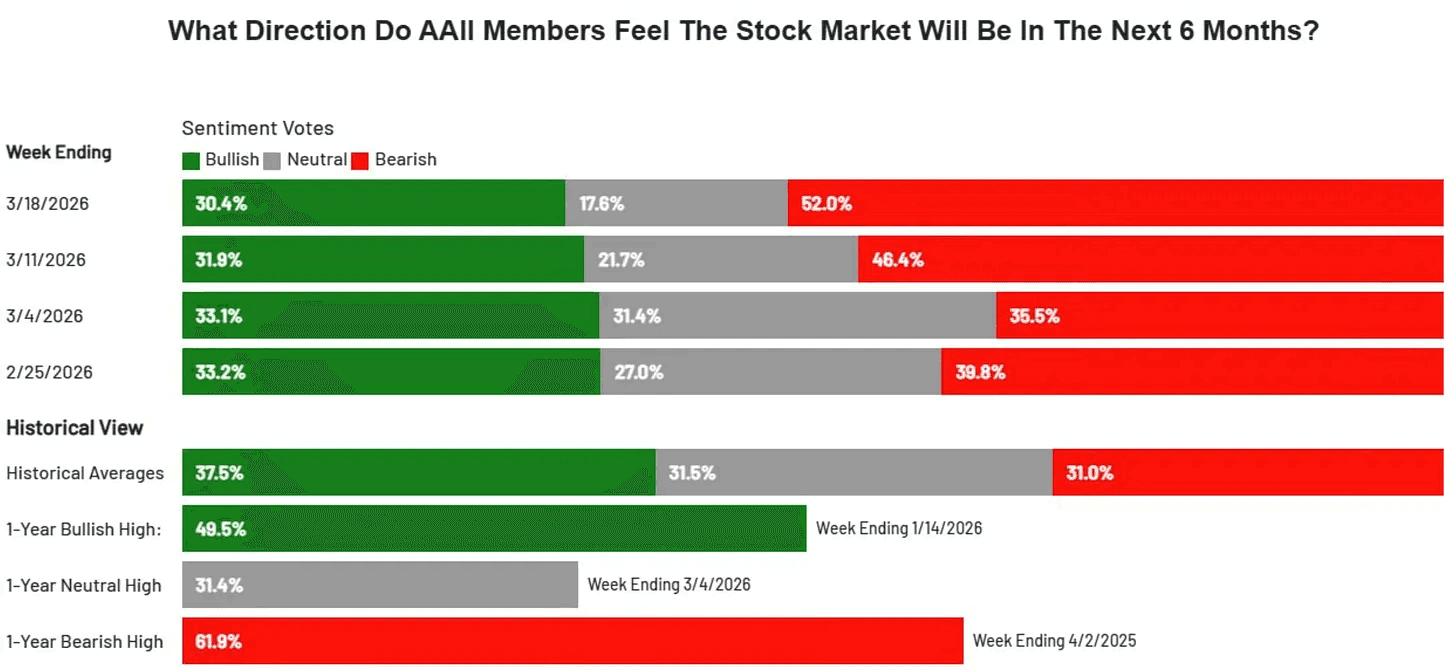
In the AAII sentiment survey, more than half of individual investors, 52%, expect the market to be lower 6 months from now. That is the highest level since April 2025 and the most bearish reading in roughly a year.
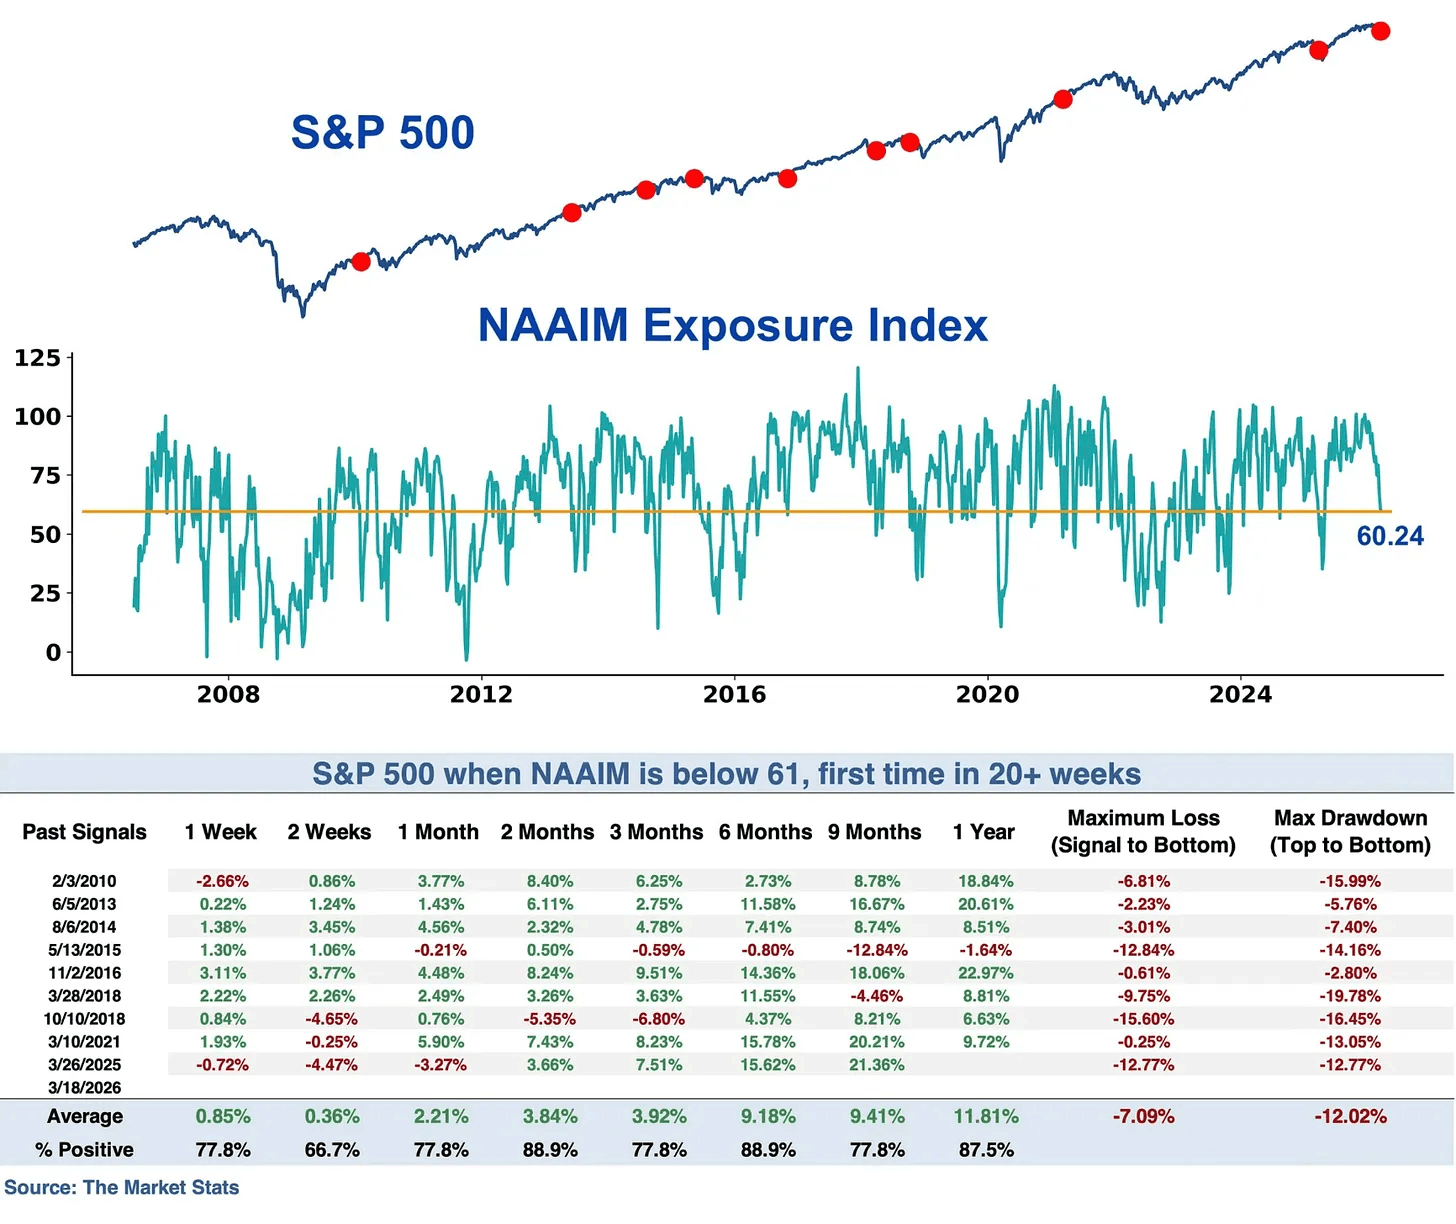
Extreme sentiment readings like these tend to mark turning points rather than predict continued pain. The NAAIM Exposure Index, which tracks how actively invested money managers are, just fell below 61 for the first time in more than 20 weeks. Looking back at every other time this has happened, the S&P 500 was higher 2 months later in 8 out of 9 cases.
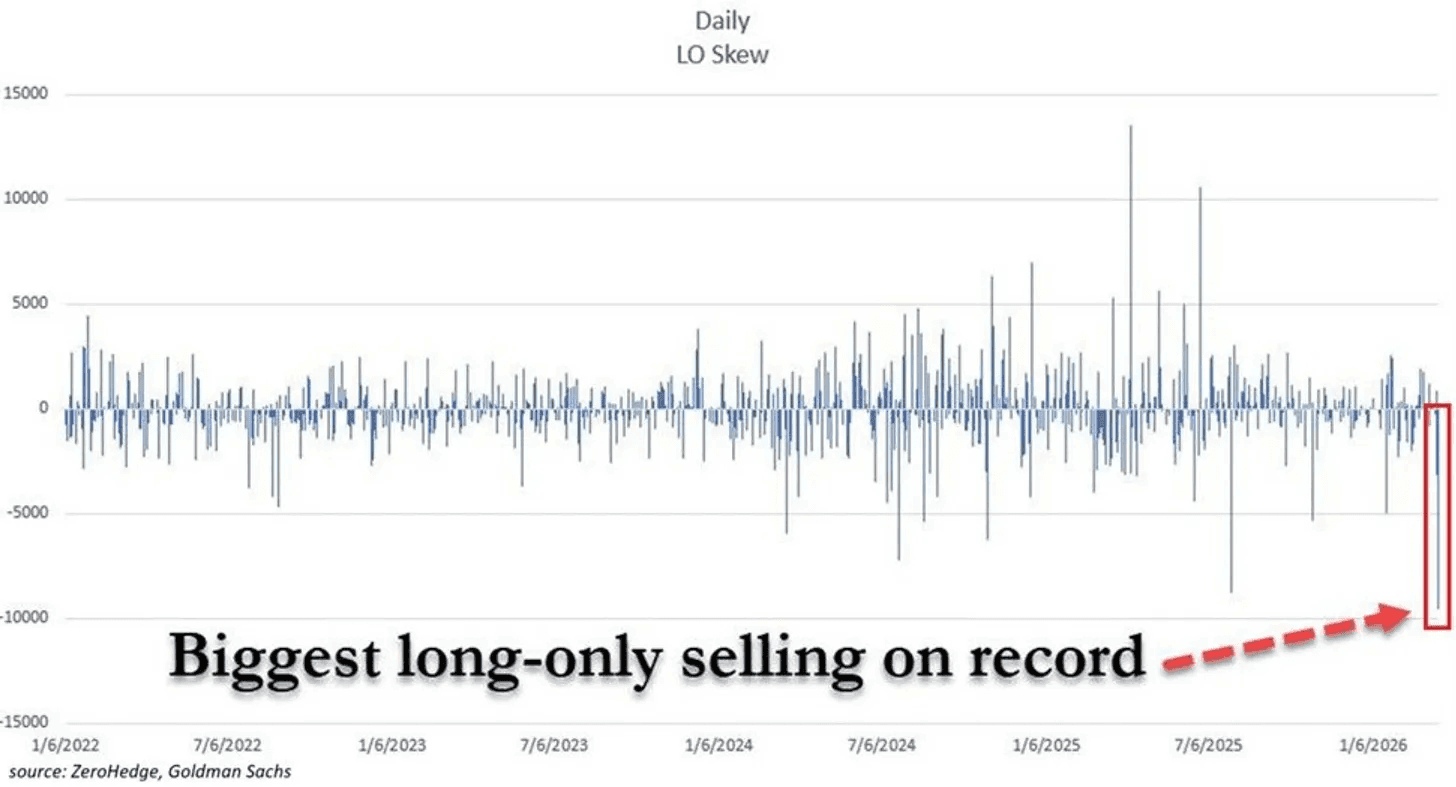
And long-only funds unloaded nearly $10 billion in US stocks during the morning session alone, the largest single-day long-only sell-off on record.
The largest on record.
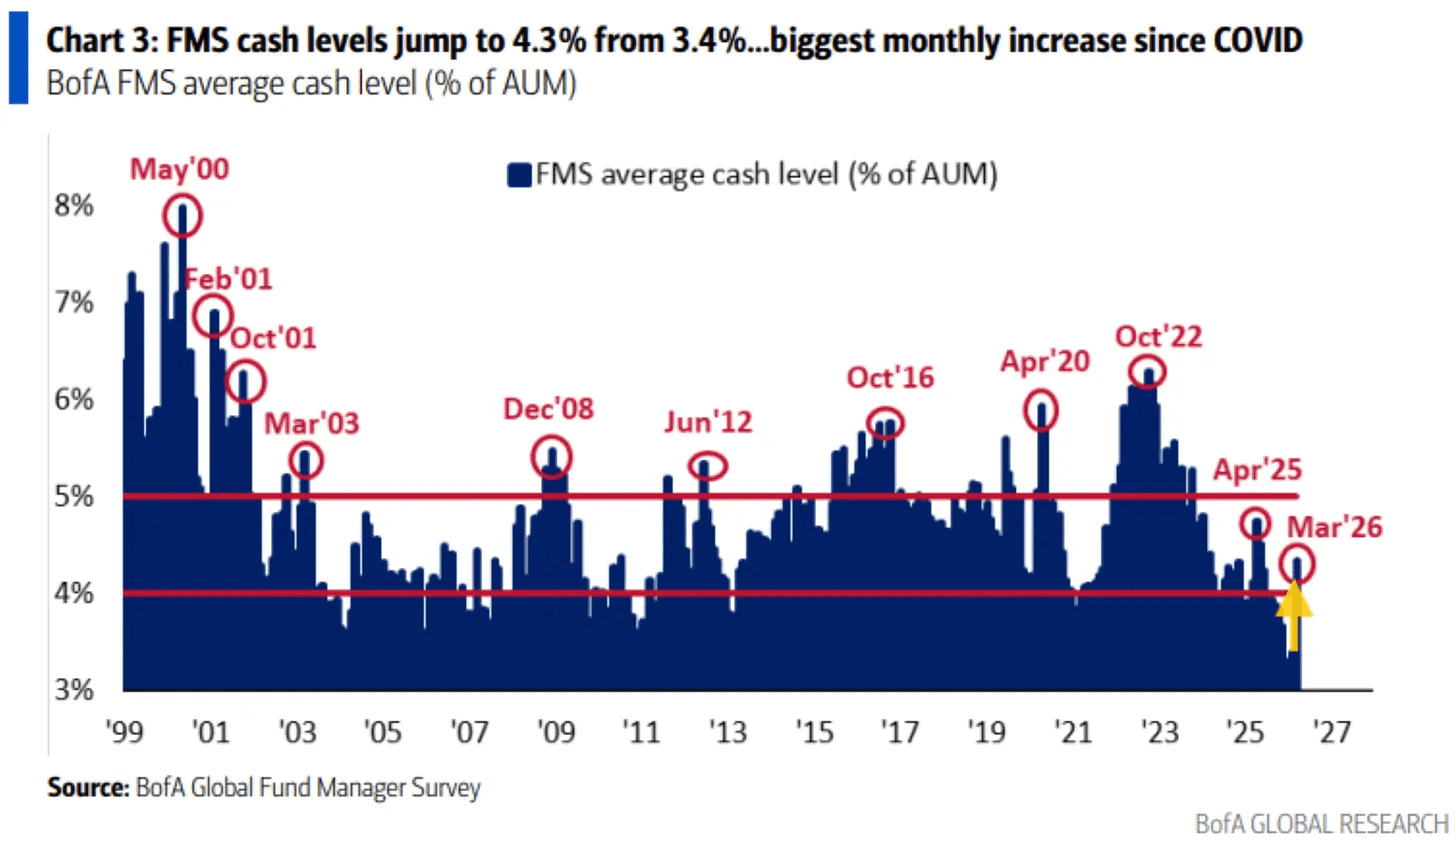
Fund manager cash levels surged from 3.4% to 4.3% in March, the biggest single-month jump since the early days of COVID. That is money leaving the market and moving to the sidelines. And at some point, it is likely to come back.
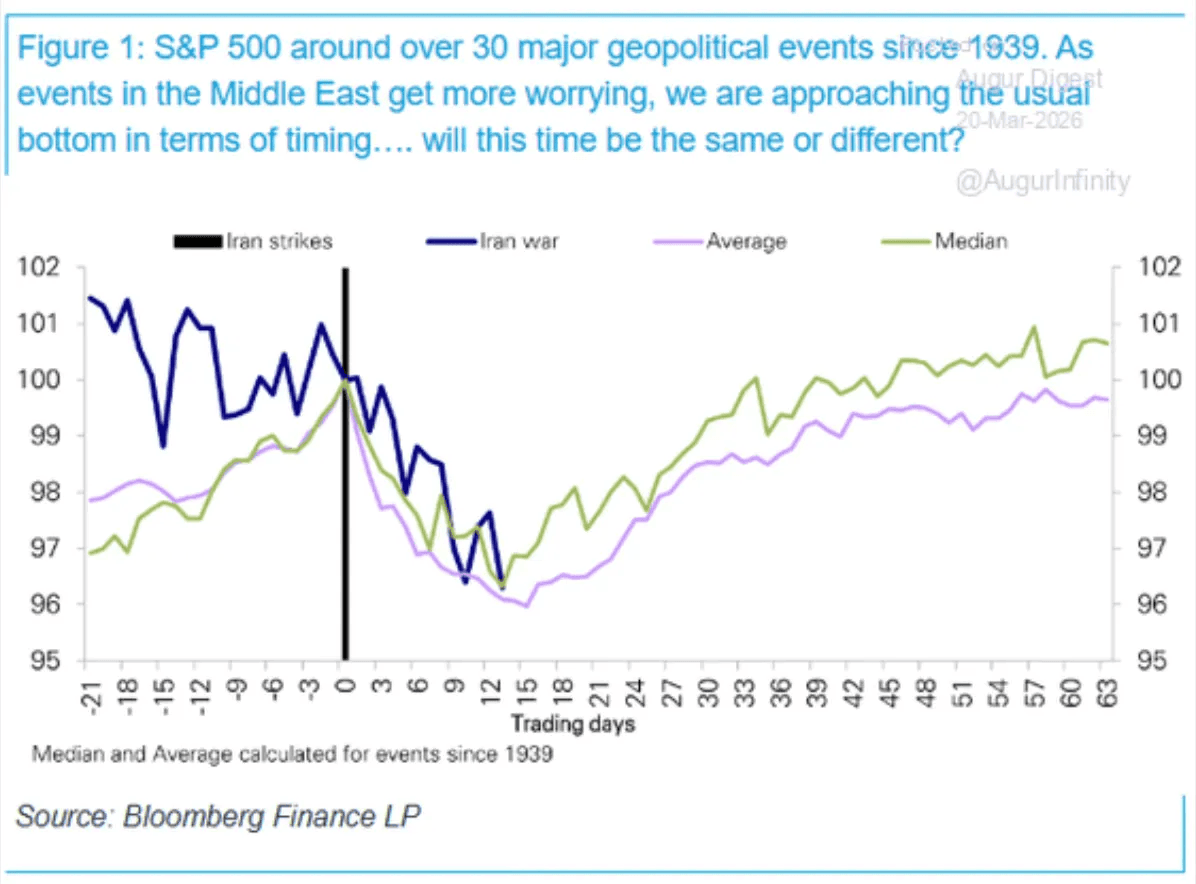
And historically, looking at more than 30 major geopolitical events going back to 1939, the S&P 500 has tended to bottom out roughly 15 trading days after an event begins. We’re getting close to that window. We are getting close to that window.
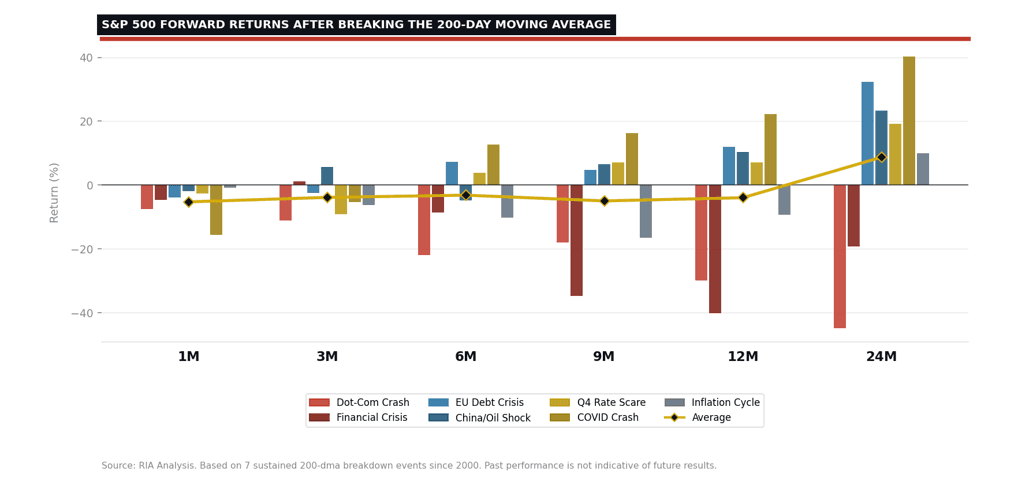
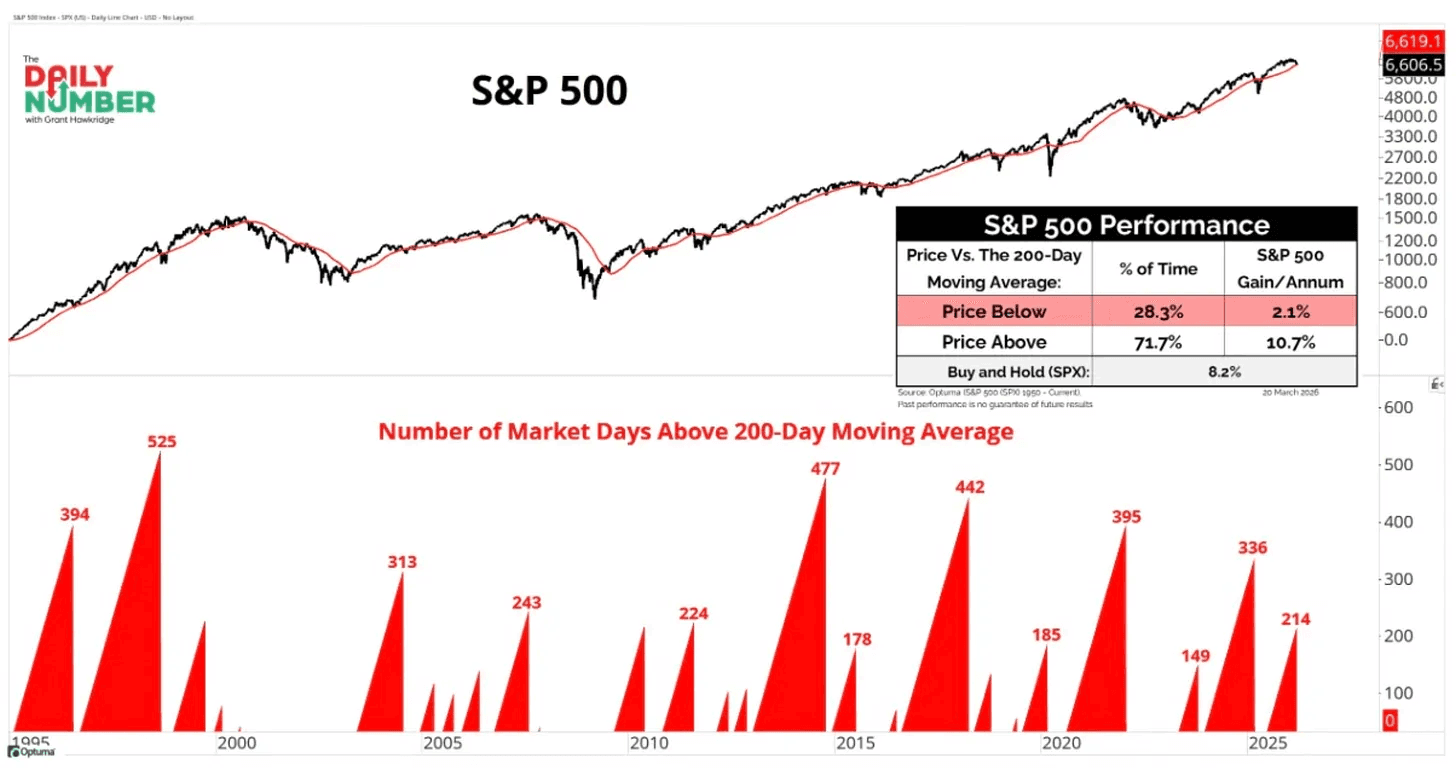
But even with this large gap up today, it is still below its 200-day moving average.
The 200-day moving average is one of the most widely followed technical levels in the market, and for good reason. Since 2000, the first month after a break below this level has been almost universally negative. Across all 7 instances, the market did not post a single gain in the following month.
The average 1-month return is -5.3%, and the best outcome was still negative at -0.8%.
The 200-day moving average is the line that separates bull market behavior from everything else.
When the S&P 500 is above it, the market is on your side. The index spends roughly 72% of its time above that level and generates annualized returns of around 10.7% when it does.
As long as we stay below it, this is not the environment to be aggressive.
Nothing good ever happens below the 200-day.
So a simple rule of thumb:
good = above the 200-day SMA bad = below the 200-day SMA
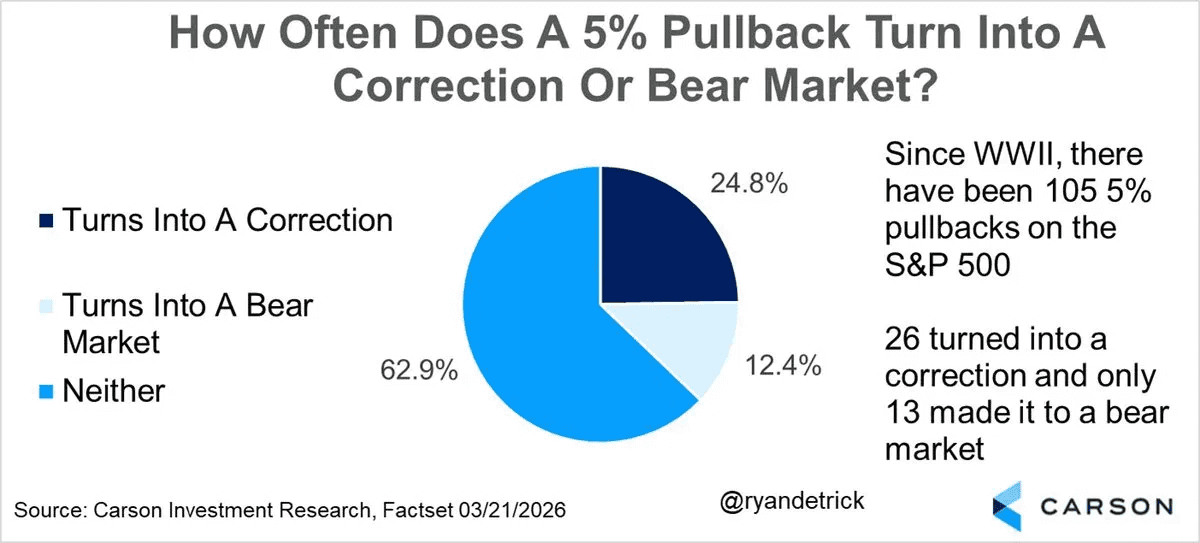
But a full-fledged bear market still seems unlikely.
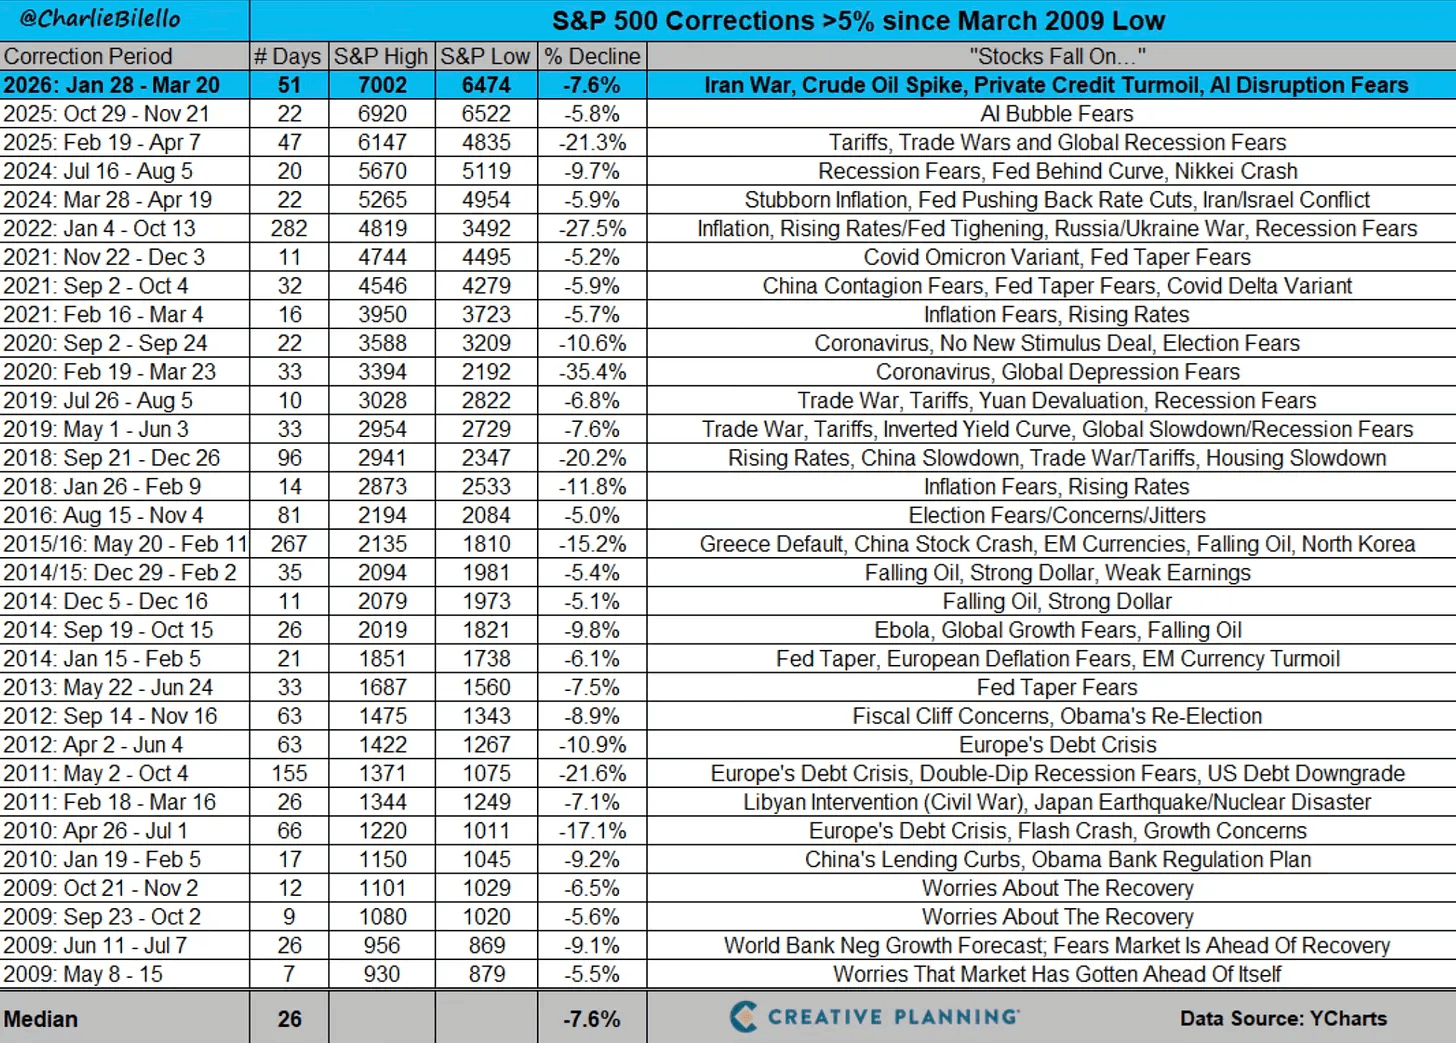
Since WWII, the market has experienced 105 pullbacks of 5% or more. About 25% of those declines went on to become 10% corrections, while only 12.4% ultimately developed into bear markets.
Across the board, the major indices are telling the same story I highlighted last week. It is time to slow down: smaller position sizes, less trading, more observing, and more cash.
The S&P 500 and Nasdaq are both clearly rolling over, with rounding tops, consistent lower highs and lower lows, and now trading below major moving averages for the first time since April 2025.
Sentiment is clearly shifting toward fear, but in my view, it has not reached the kind of full capitulation typically seen at true bottoms. Across multiple indicators, positioning is getting lighter, and you can feel pessimism slowly starting to build in the overall market sentiment.
My big picture takeaway is that conditions are moving in the right direction for a bottom to start forming. The market will eventually turn, but that day is not today. Bottoms are a process and this one is likely not finished yet. And as long as we are below the 200-day SMA, there is not much to do on the long. If anything large gap ups can be used to reduce exposure.
Until then wait, observe, and most importantly, prepare.
Previous Updates
View All
- Market Update: The FinTech Comeback
- Weekly Market Update: Halftime
- Market Update: The Robots Are Coming
- Weekly Market Update: The Broadening
- Market Update: The Break Point
- Weekly Market Update: Patience
- Market Update: The Memory Crunch
- Weekly Market Update: The First Trillionaire
- Market Update: In Focus
- Weekly Market Update: Deleveraging
- Market Update: A Change of Character
- Market Update: The Next Quantum Leap
- A Few Portfolio Changes