Company or ticker...
Company or ticker...
Company or ticker...
The Best Platform For
Active Investors
"I always print your posts and study it one by one."
Trusted by +
investors
What’s Inside


Turn Noise into Action
Investing starts with a lot of confusing information.
The Fullstack Investor helps you spot the patterns that reveal the structure.
Noise becomes structure, and structure leads to action.
Thematic Portfolios

Space
The Space Economy

Founder-Led Companies
Bet on the Visionaries

Quantum Computers
The Future of Computing

Nuclear
The Future of Energy

Rare Earth Elements
The Metals Behind Everything

Drones
The Future of Warfare

Air Taxis
The Future of Air Mobility
Coming Soon

AI Agents
The Future of Work

Humanoid Robots
The Future of Labor

AI Infrastructure
Powering the Future

Autonomous Vehicles
The Future of Mobility
Portfolio Tracker
Action
Ticker
Price
Date
Return
Setup
Add
BRK
$
21.27
May 28, 2025
714.48%
Breakout
Buy
BRK
$
11.84
May 28, 2025
794.76%
Breakout
Add
BRK
$
42.68
May 28, 2025
148.22%
Breakout
Add
BRK
$
21.27
May 28, 2025
714.48%
Breakout
Buy
BRK
$
11.84
May 28, 2025
794.76%
Breakout
Add
BRK
$
42.68
May 28, 2025
148.22%
Breakout
Add
BRK
$
21.27
May 28, 2025
714.48%
Breakout
Buy
BRK
$
11.84
May 28, 2025
794.76%
Breakout
Add
BRK
$
42.68
May 28, 2025
148.22%
Breakout
Buy

ORCL
$
176.38
Jun 11, 2025
41.06%
Breakout
Buy
ORCL
$
176.38
Jun 11, 2025
41.06%
Breakout
Buy
ORCL
$
176.38
Jun 11, 2025
41.06%
Breakout
Add
BRK
$
21.27
May 28, 2025
714.48%
Breakout
Buy
BRK
$
11.84
May 28, 2025
794.76%
Breakout
Add
BRK
$
42.68
May 28, 2025
148.22%
Breakout
Add
BRK
$
21.27
May 28, 2025
714.48%
Breakout
Buy
BRK
$
11.84
May 28, 2025
794.76%
Breakout
Add
BRK
$
42.68
May 28, 2025
148.22%
Breakout
Add
BRK
$
21.27
May 28, 2025
714.48%
Breakout
Buy
BRK
$
11.84
May 28, 2025
794.76%
Breakout
Add
BRK
$
42.68
May 28, 2025
148.22%
Breakout
Real-Time Market Updates

Lin
Jan 18, 2026
Weekly Market Update: Rotation
We’re not even 3 weeks into 2026, and it already feels like 3 months have passed.
A lot has already happened. Over the last decade the markets have started to move much faster now. News. Reactions. Pullbacks, rallies, rotations. Everything is compressed.
This week the broader market pulled back a bit even though we saw record earnings from TSMC. The selloff came from somewhere else. Rising yields and fresh talk about who the next Fed Chair might be.
That’s how markets work. The story changes every day.
One day it’s rates. The next it’s geopolitics. Then central banks. Then tariffs. And so forth.
Just over the weekend, Trump announced new tariffs targeting Europe, tied to the US pushing to buy Greenland. This is the environment we’re in right now. There is always a new headline. Always a new reason for fear or excitement.With earnings season starting again, so expect volatility to return.
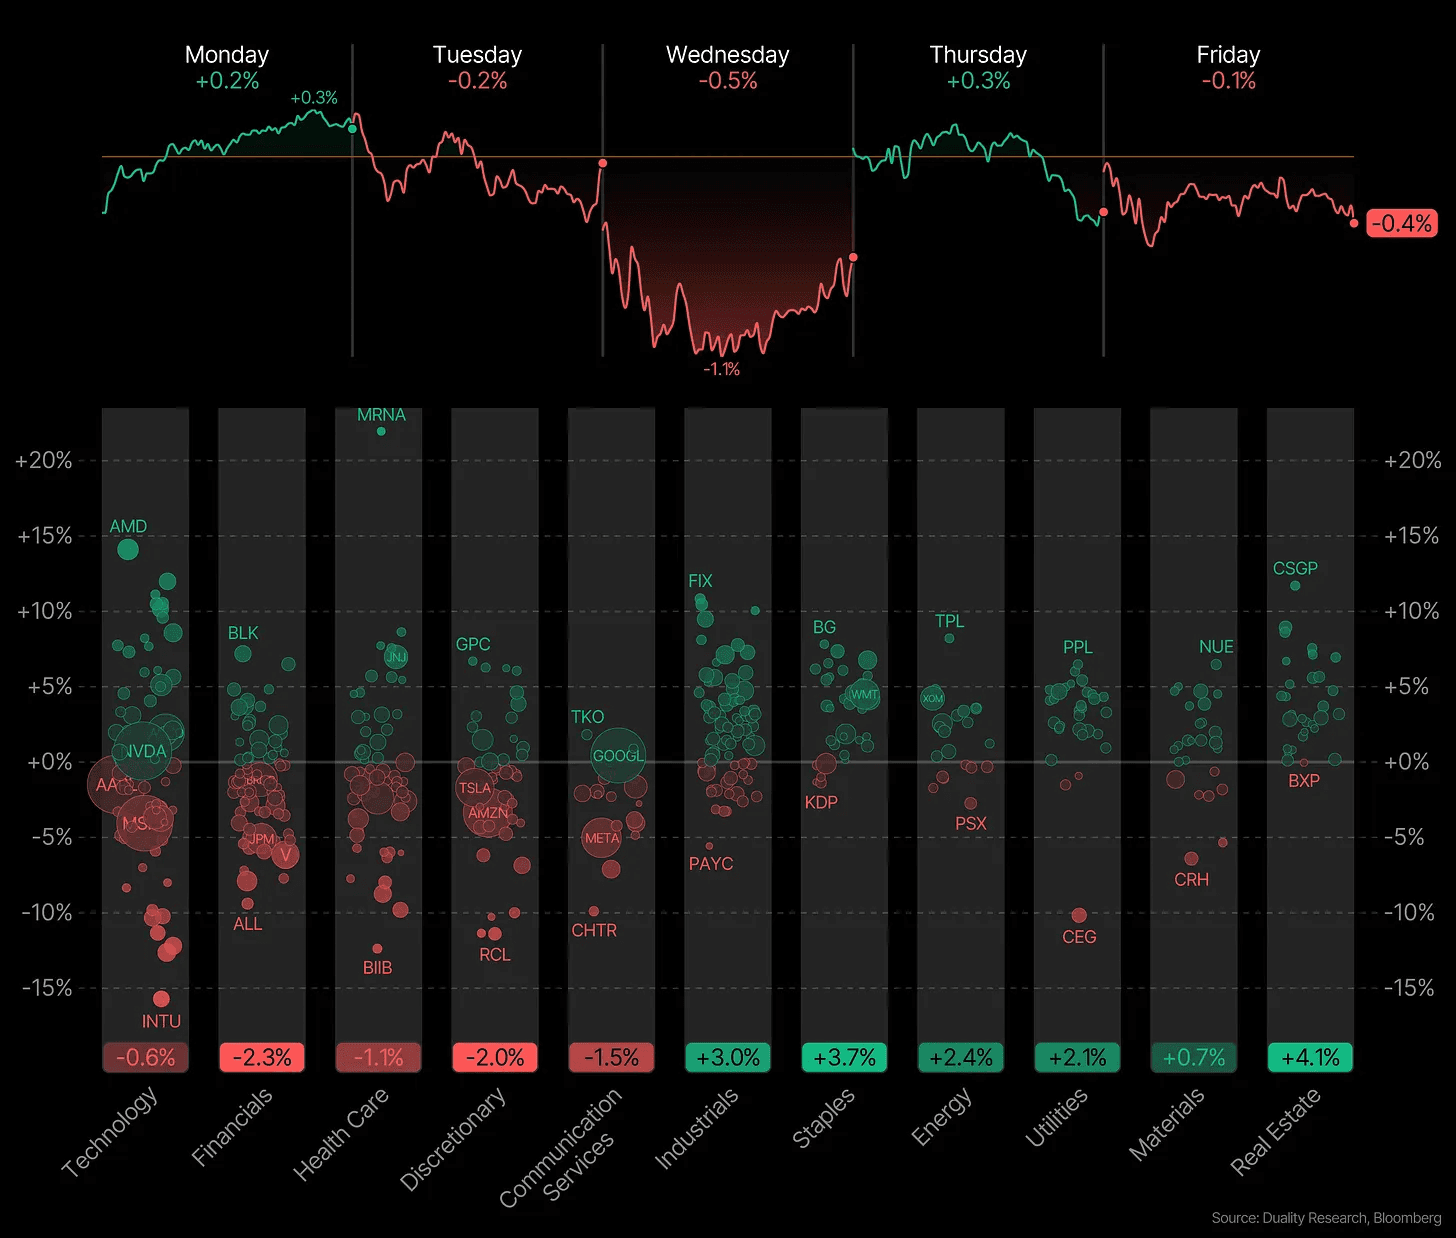
All major indices ended the week in the red. But not everything was down. Bitcoin, gold, and Small caps were up. That tells you money did not leave the market. It just rotated.
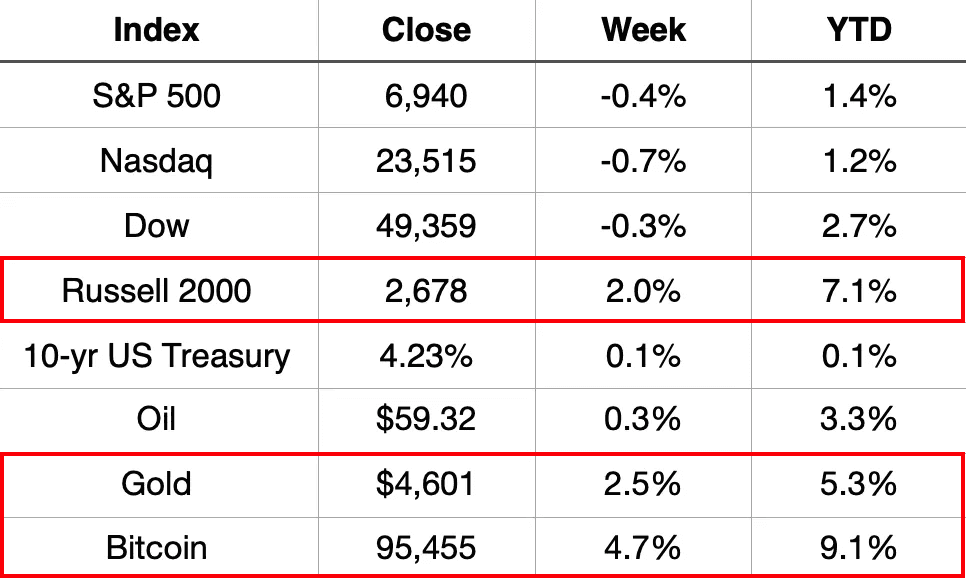
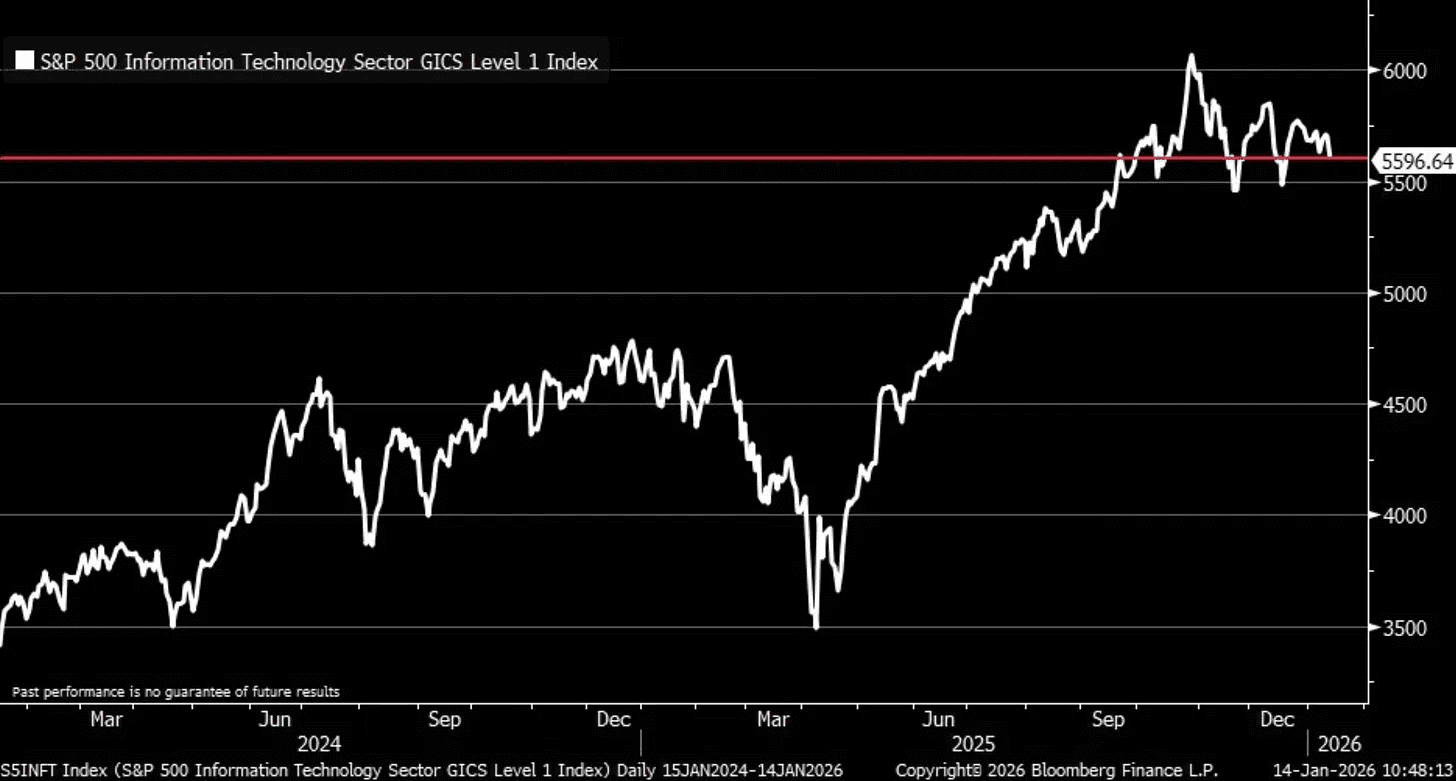
The Nasdaq and S&P 500 are essentially flat over the last four months.
Long periods of consolidation usually don’t last forever. They tend to lead to a big expansion move. The only question is the direction.
Ideally, we see QQQ break out of this range. But a breakdown is also possible. That’s the reality of markets. Nobody knows anything for sure. What we can do is study history, look at the data, and consider different scenarios to form a hypothesis.
Only time will tell. But it will likely be coming sooner rather than later.
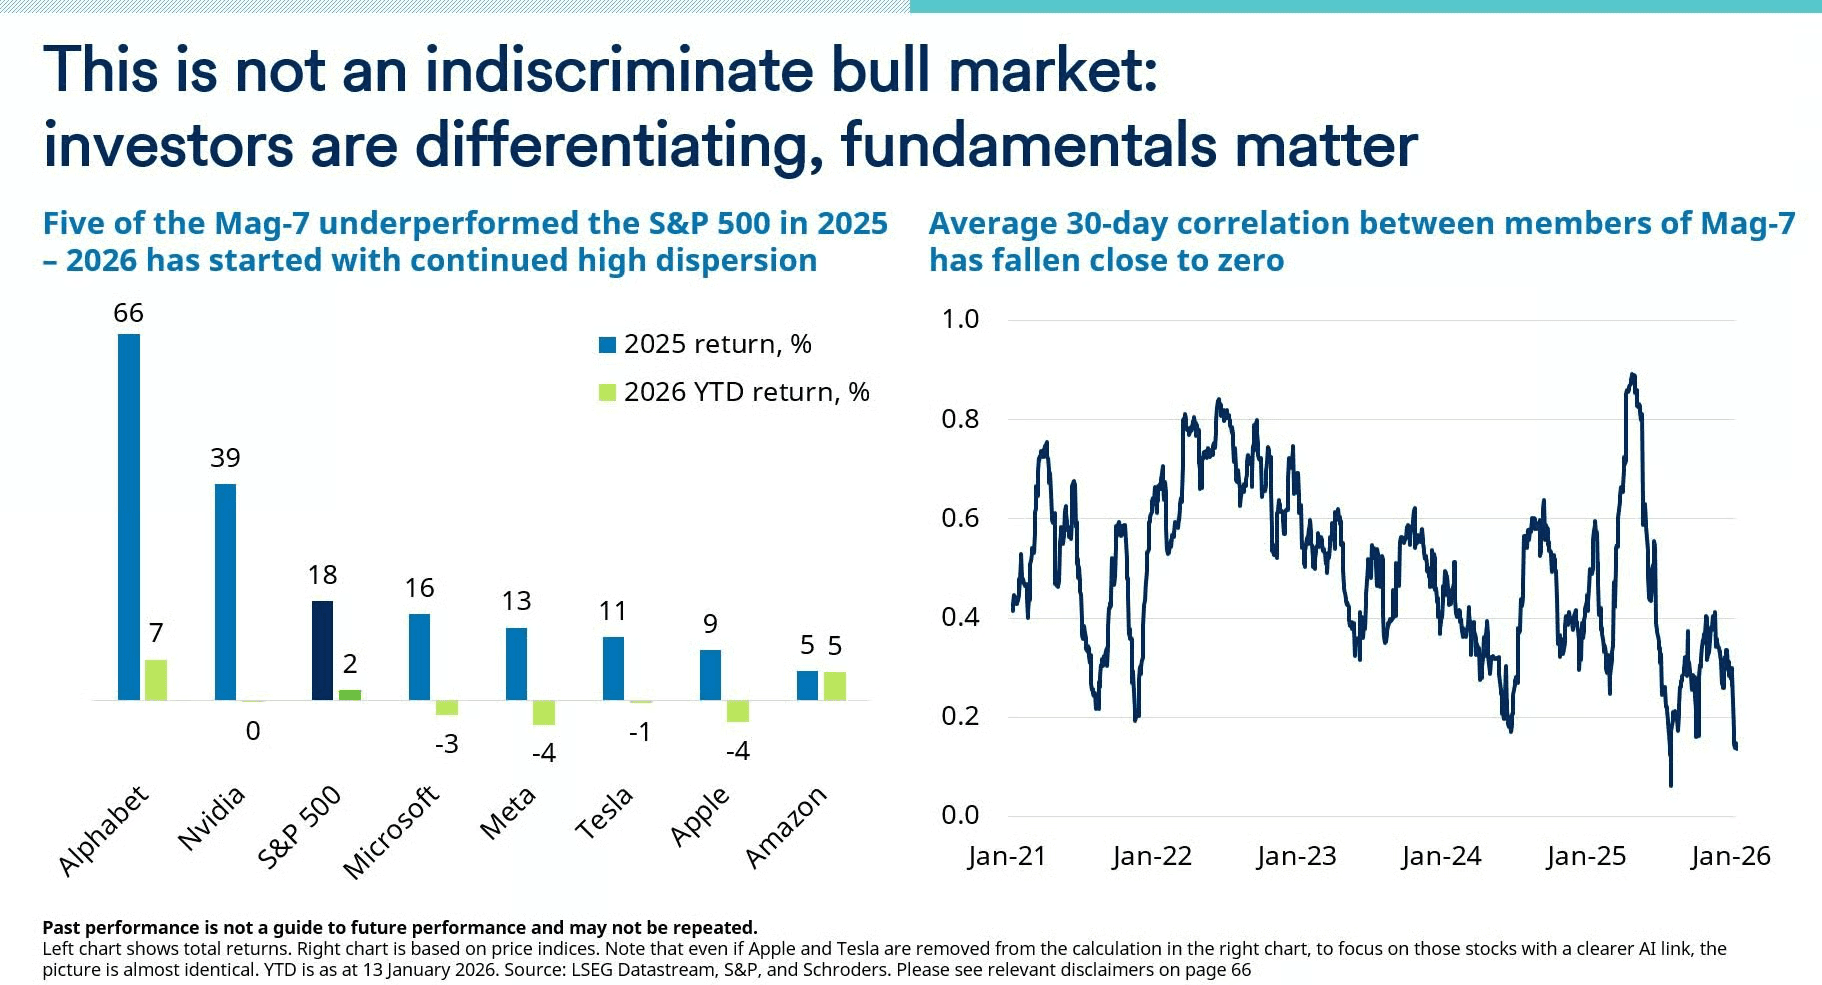
Interestingly, the big tech stocks aren’t really moving together anymore. The average correlation between the Mag 7 is close to 0. In simple terms, they’re no longer acting like one big group. Investors are trying to separate the winners from the losers. Right now, Google and Amazon are the ones holding up best.
Except for some weakness in a few areas, most other sectors are actually doing fine.
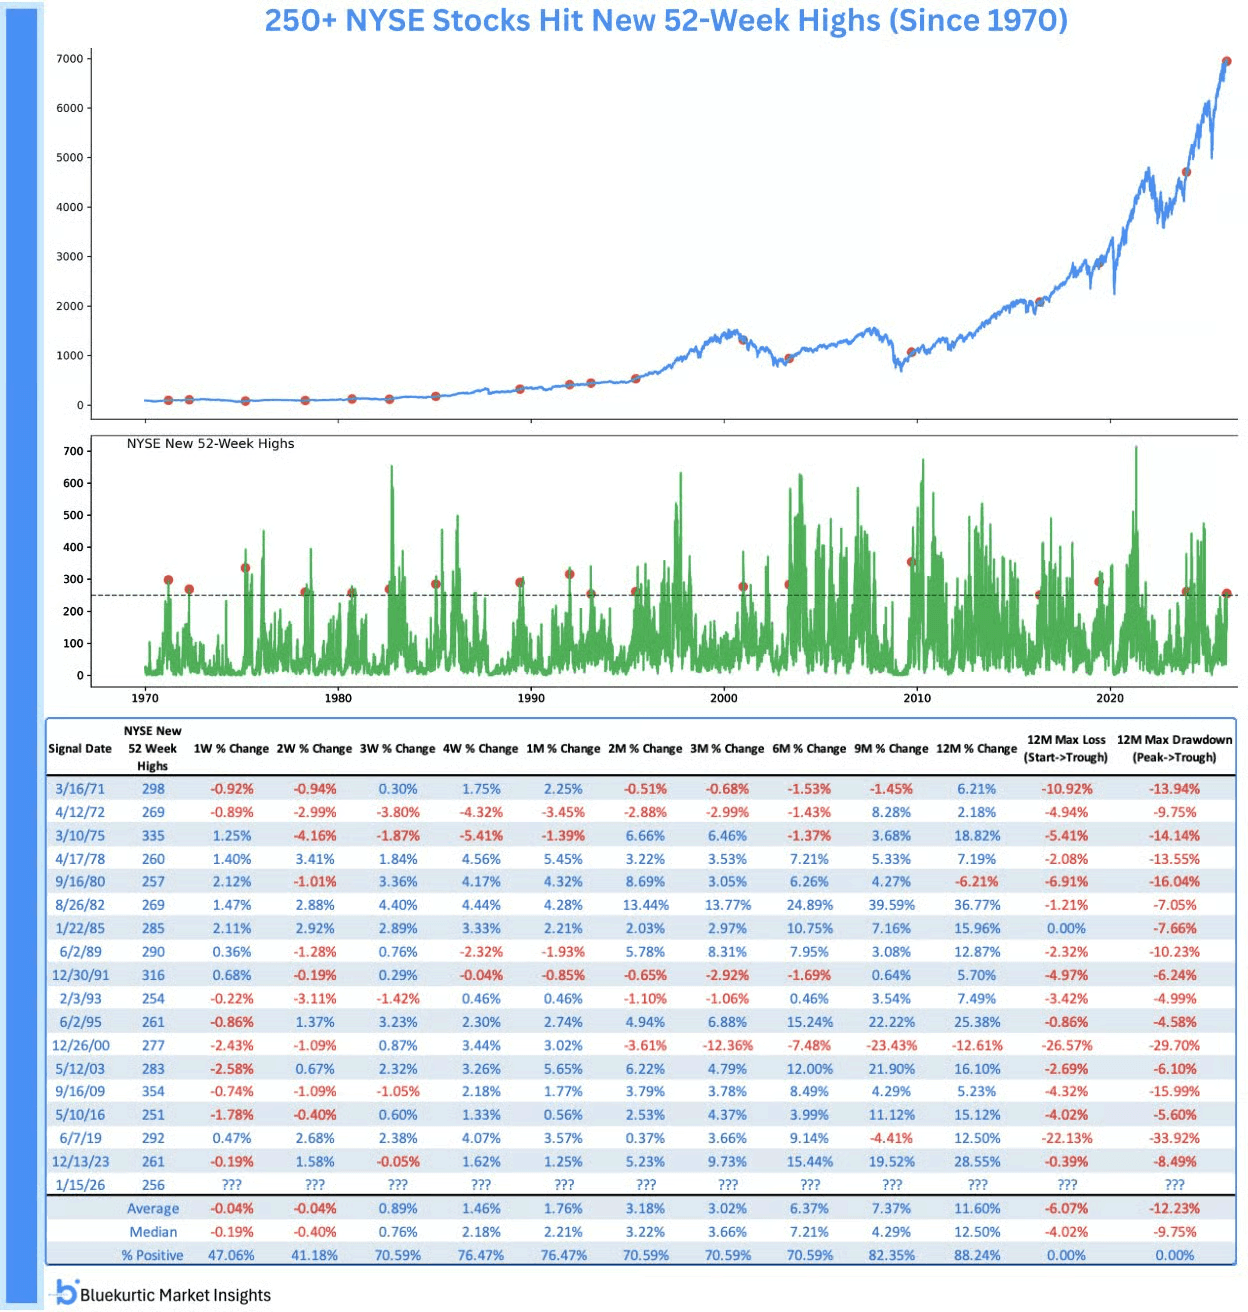
Market breadth keeps getting better, and that’s important. More stocks are participating. Last week, more than 250 NYSE stocks hit new 52 week highs. That’s rare. It has only happened 18 times since 1970.
History is pretty clear here. In the prior 17 cases, the S&P 500 was higher 12 months later 88% of the time. Of course, nothing is ever guaranteed, but improving market breadth like this usually shows the market is healthier than the headlines may make it seem.
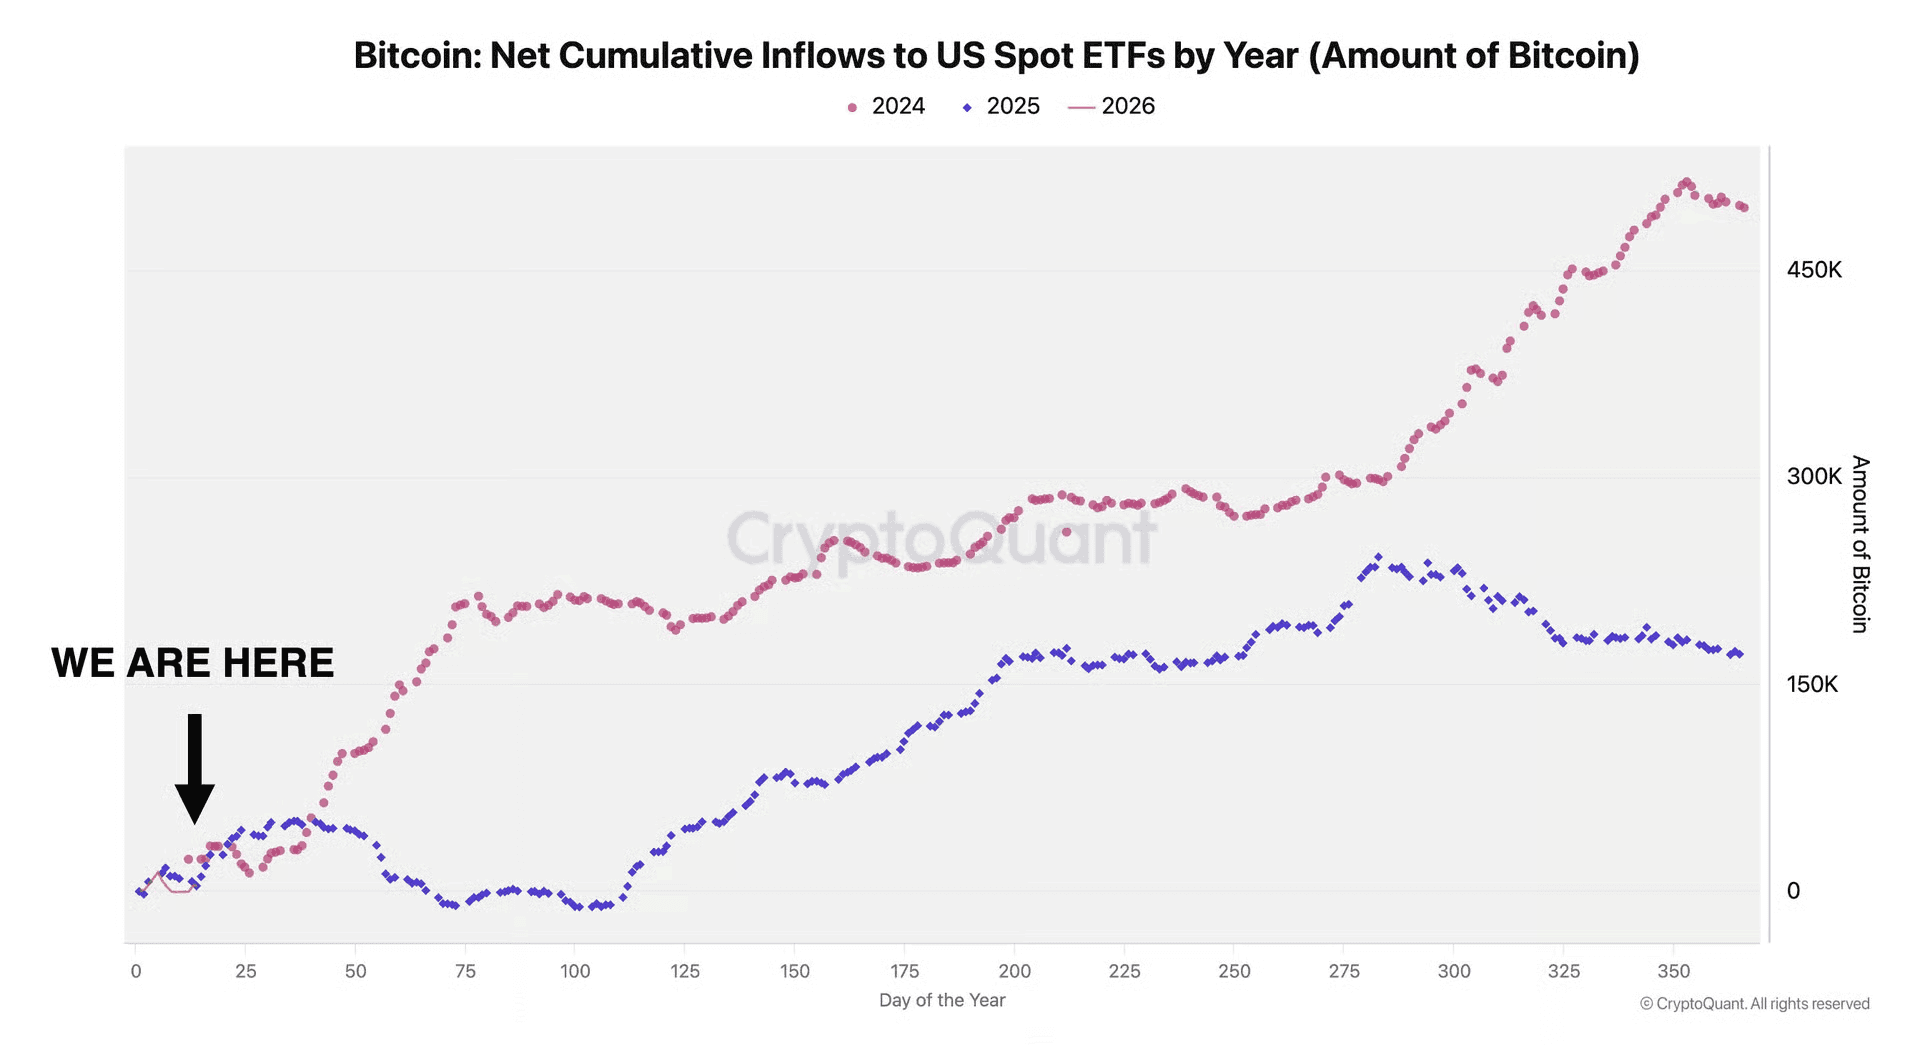
Even crypto is starting to come back to life.
Bitcoin ETF inflows this year have reached about 3.8K BTC. That’s slightly more than the 3.5K BTC we saw in the same period last year. This is still early in the year. That’s important because January is usually quiet for crypto flows. The bigger inflows tend to show up later, often between February and April.
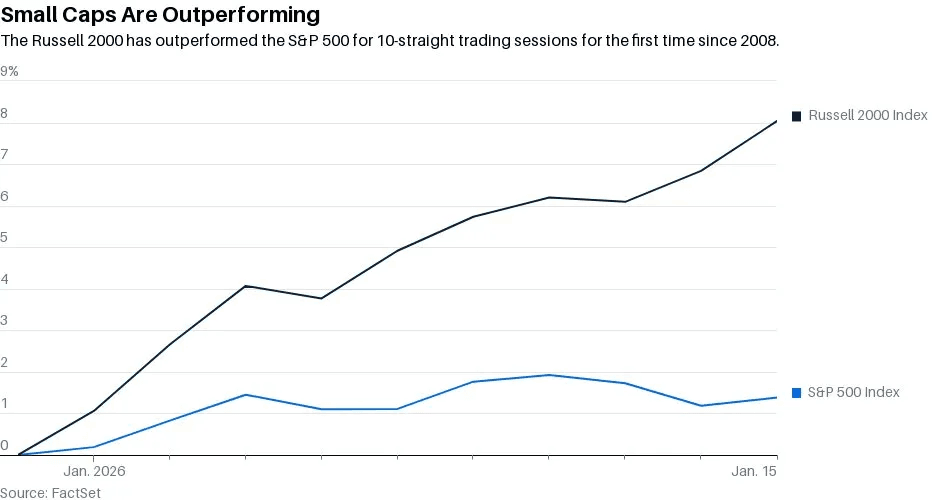
Small caps are off to a strong start.
The Russell 2000 is up more than 7% to start 2026. That’s the best first 10 days of a year since 1987. A very uncommon move. In fact, the Russell 2000 has now outperformed the S&P 500 over the last 3 months.
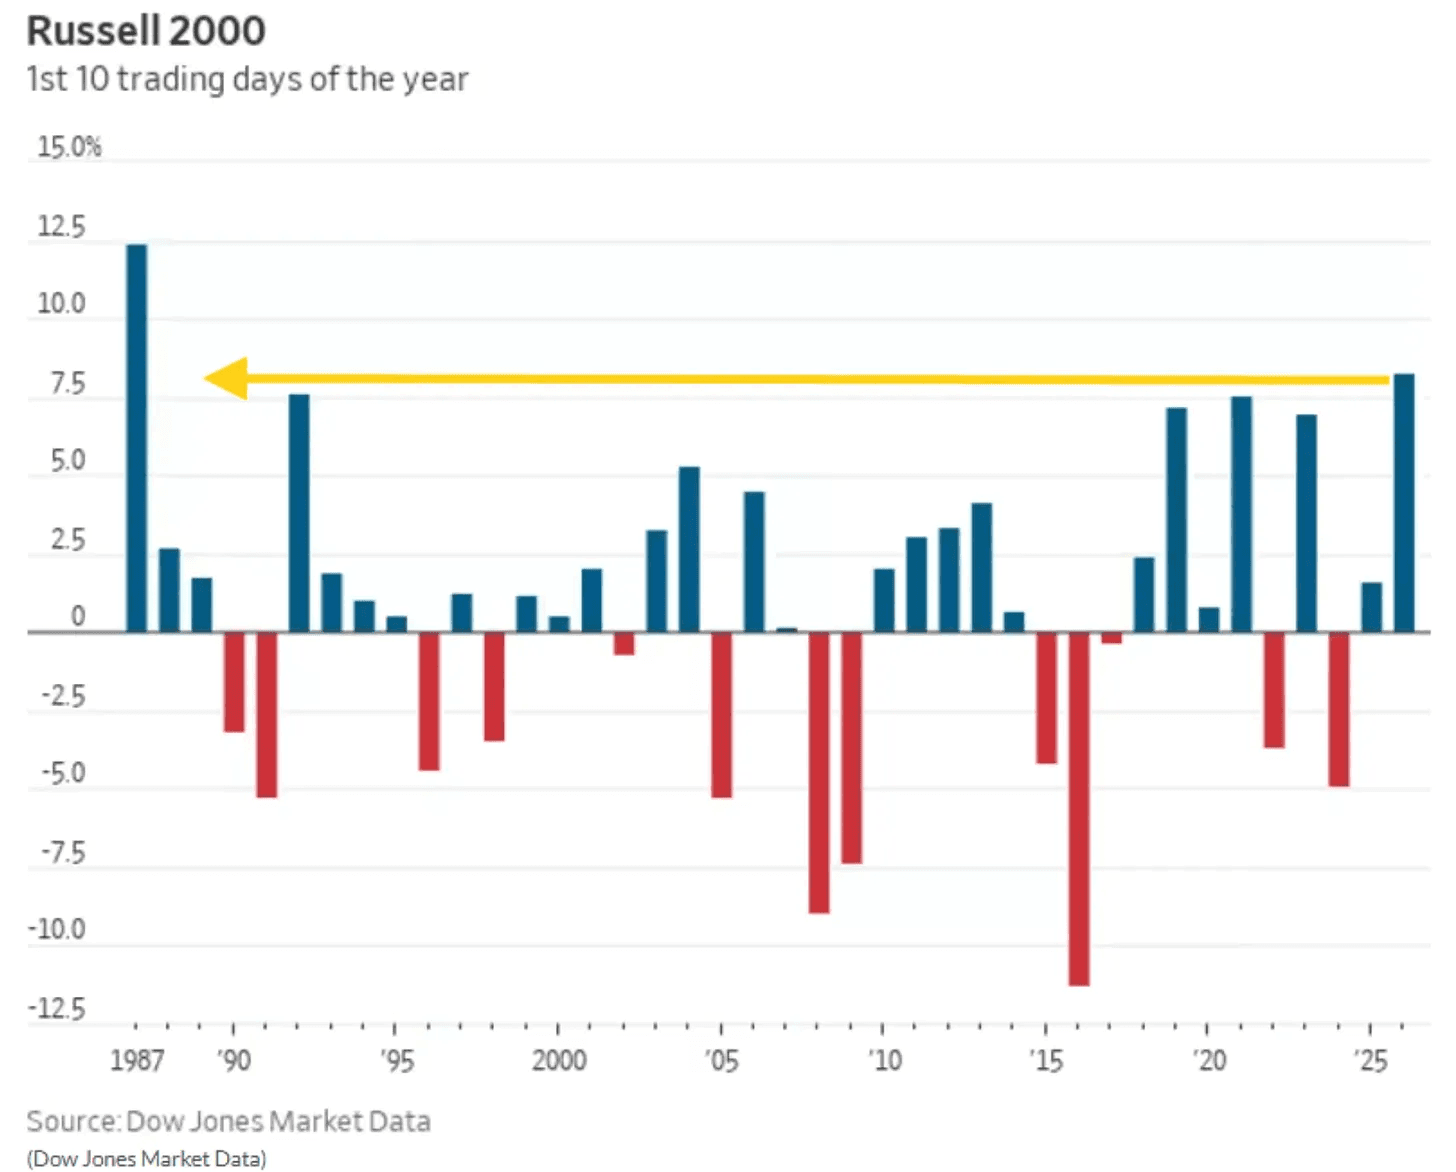
Small caps are clearly leading. And there’s a good chance that leadership continues through the year. It’s another sign the market is broadening out, not narrowing.
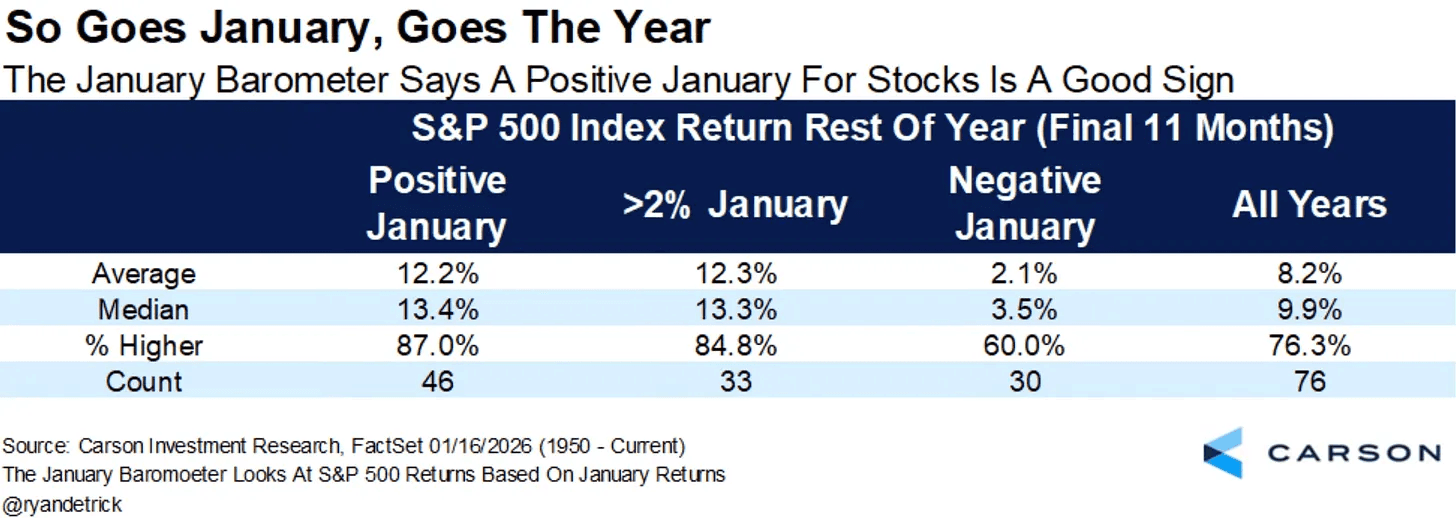
January’s performance is worth paying attention to, mostly because history has been pretty clear on this.
If January finishes higher, it’s usually a good sign for the rest of the year. When January is up, the final 11 months tend to do even better. And when January is up more than 2%, the rest of the year is higher almost 85% of the time, with returns of more than 12% on average.
Of course, nothing is guaranteed. But it’s worth keeping on the radar.
Wall Street is very bullish on 2026. And when you zoom out, it’s not hard to see why.
Stocks are at record highs.
Gold is at a record high.
Silver is at a record high.
Home prices are at record highs.
Copper is at a record high.
Platinum is at a record high.
Money market funds are at record highs.
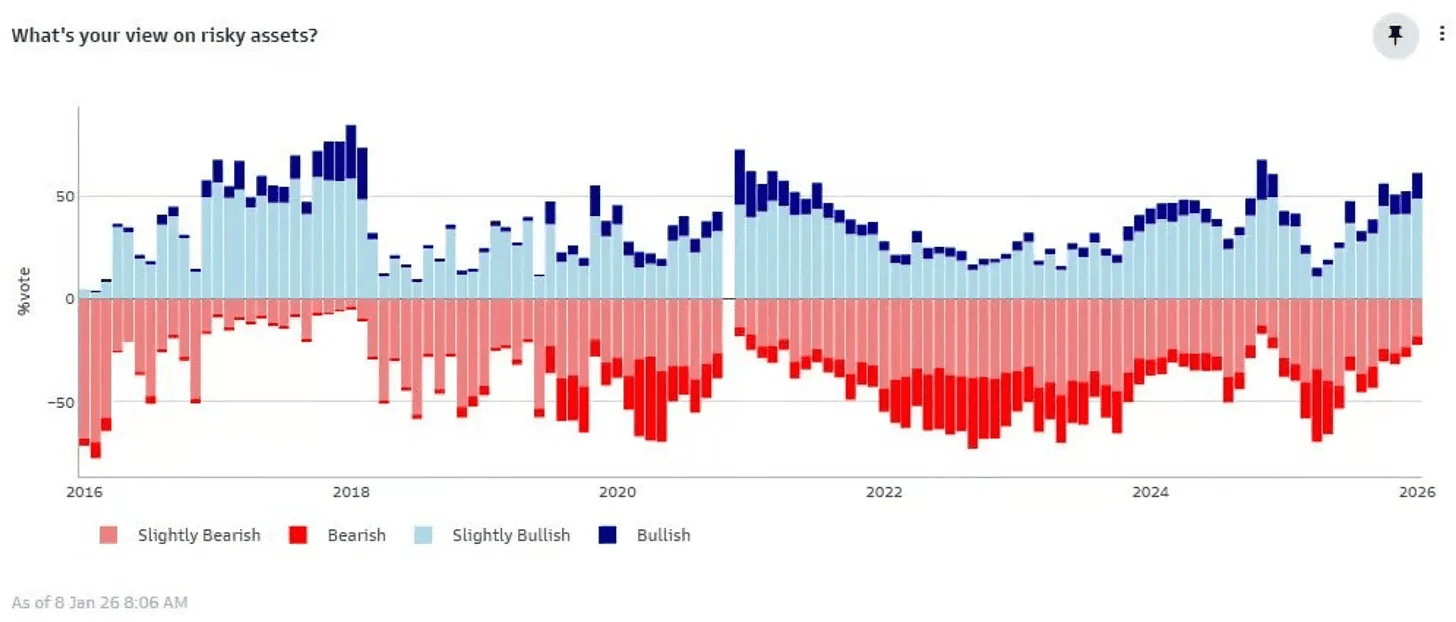
Almost everything you look at is sitting at or near an all time high. So it really shouldn’t surprise anyone that bullishness is also at a record level.
The only thing that’s a bit worrying is when almost everyone is bullish and on the same side of the boat. There aren’t many new buyers left, expectations get really high, and even a small surprise can move the market more than people expect.
And it’s not surprising that risk appetite has increased a lot. You can see it clearly in the market. More speculative themes like rare earths, space, robotics, biotech, nuclear, crypto, drones, and quantum are all starting to take off.
By itself, that’s not a bad thing. You can actually benefit from it if you play it right. But you have to manage risk and your exposure at all times.
This is a big change from where things were just a month ago.
The AAII sentiment survey is now at 49.5%, the highest level we’ve seen in the past year. The Fear and Greed index has also flipped back to Greed for the first time in what feels like forever. On top of that, the BofA Bull and Bear indicator is now at 9.3.
It’s worth paying attention. That’s enough to start being a bit more cautious.
Goldman’s Marquee client poll shows bullishness at levels we’ve only seen three other times in the past decade. Late 2017, late 2020, and late 2024. In 2 of those cases, the market saw a correction within about 3 months.
For now though, the music is still playing. And there’s no clear sign that it’s about to stop.
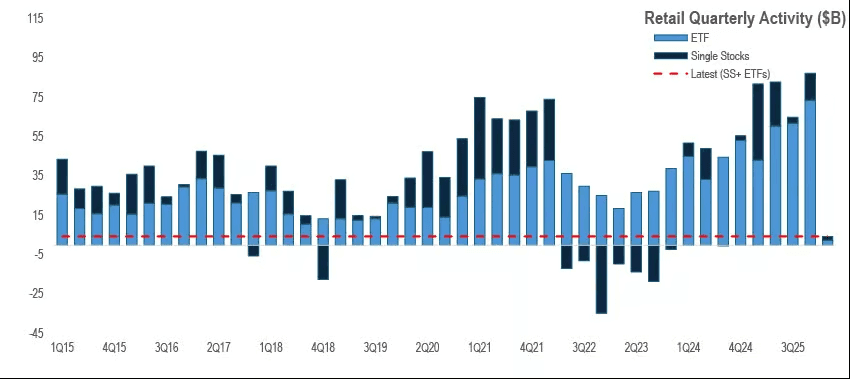
Retail traders have carried their buying streak into the new year after a record 2025. In the first 4 trading days of January, purchases hit the second highest level in almost 8 months.
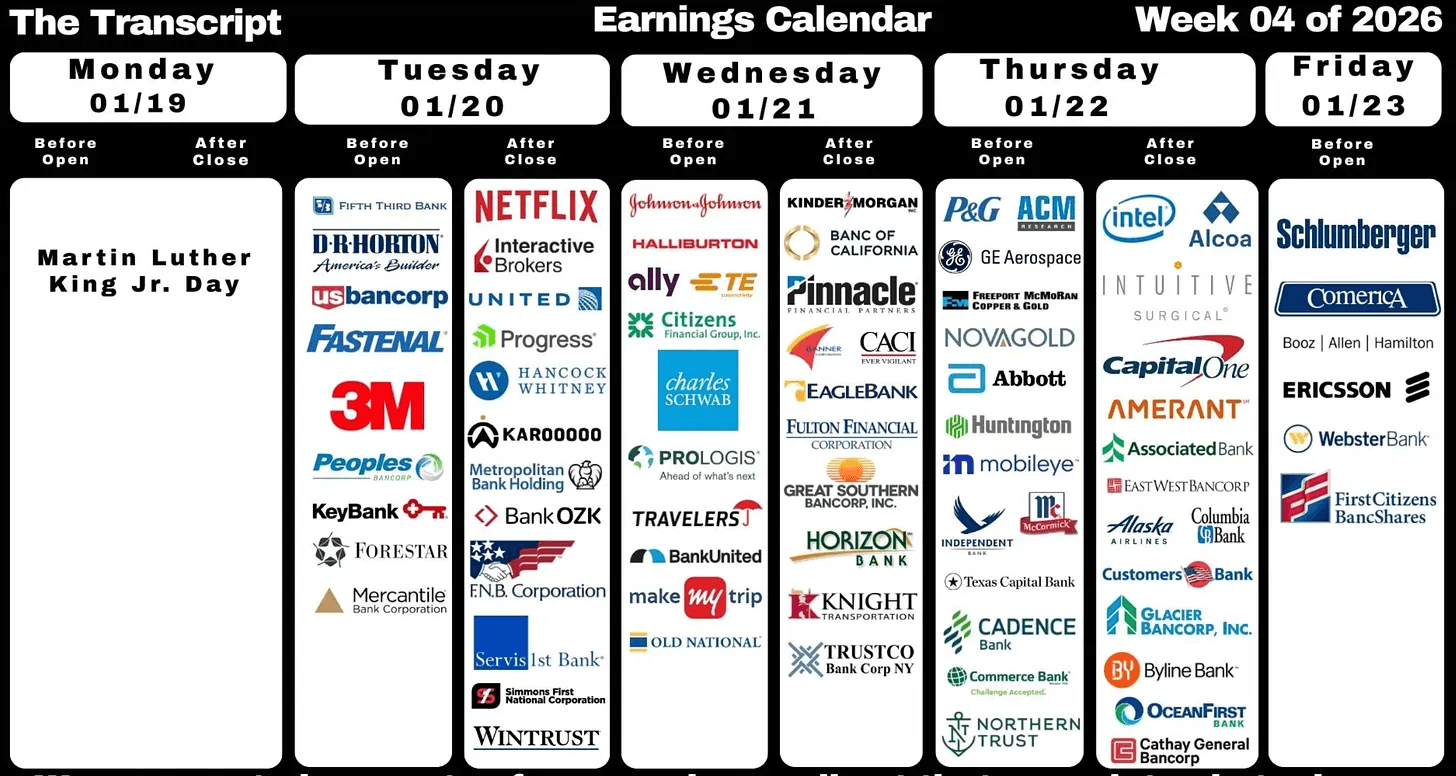
Earnings season is well underway, and this week brings a few important reports.
Netflix will give us a good read on the consumer and whether discretionary spending is still holding up. Intel is another key one. Expectations are high after its recent stock run, so the bar is set pretty high.
I’ll be paying more attention to the guidance and management commentary than just the headline numbers. Intuitive Surgical is also worth watching. Last quarter it had a huge earnings gap, and the market will be looking to see if it can deliver something similar again this time.
A lot of banks are reporting as well, along with a few smaller names like Mobileye ($MBLY).
Wars, unemployment, the Fed, Greenland. There is always noise in the market, and there always will be.
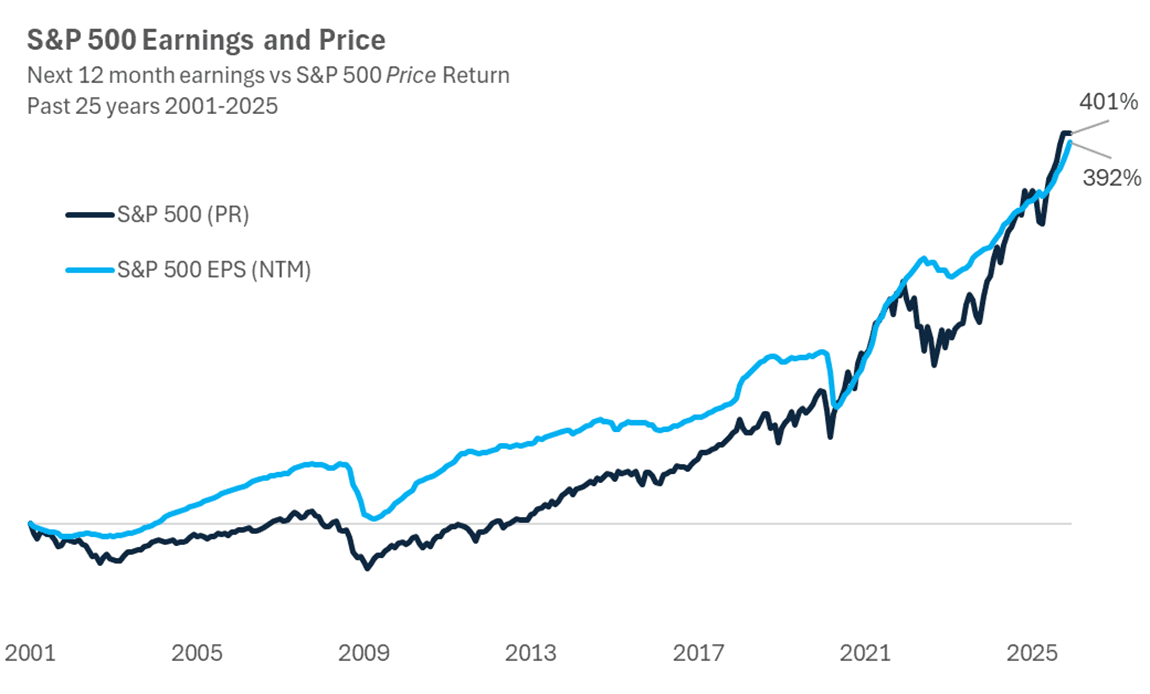
That noise isn’t all bad. But at the end of the day, what really matters for stocks is earnings. A lot of things affect earnings, but the direction of those earnings is the long term driver of stock prices.
Over time, prices follow profits.
The chart below shows this clearly over the last 25 years. Forward looking earnings move closely with stock prices. There are ups and downs, times when the market runs ahead or falls behind, but over the long run, earnings and prices tend to move together.
This bull market isn’t ending anytime soon, but it does suggest we could see some short term volatility.
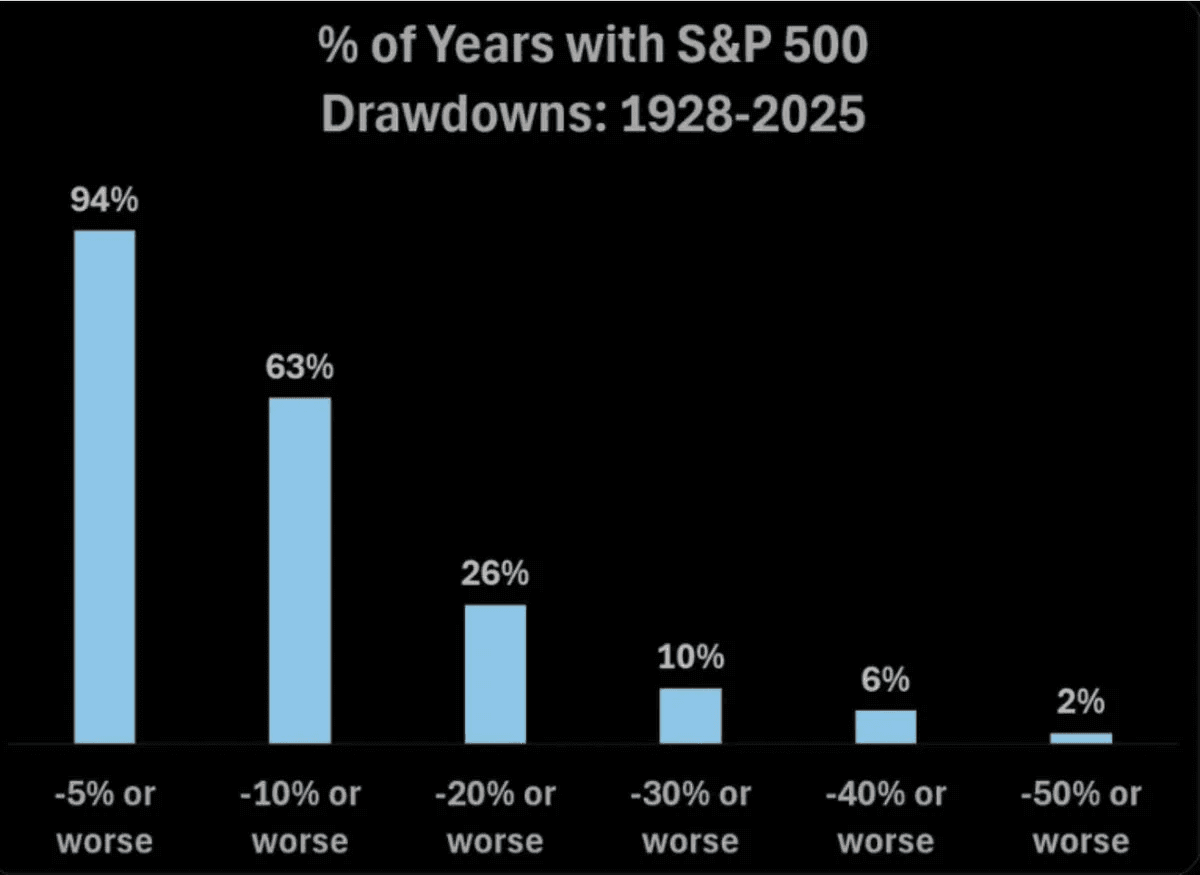
Pullbacks are normal. In fact, 94% of years see at least a 5% pullback in the S&P 500. And about 63% of the time, we get a pullback of 10% or more.
Volatility is the price of admission. If you want to take part in the greatest wealth building machine on earth, you have to accept those swings. If the market were risk free, everyone would be doing it. Unfortunately, t’s not.
There are a few things to watch. Earnings are coming up. On the macro side, we have new tariff threats, Iran, and the whole Greenland situation. To me, this is mostly noise. It can create some short term volatility, but nothing that changes the bigger picture. If we were to get another pullback like we saw in April because of headlines like this, that would be a gift. I think the market has learned its lesson, and a selloff like that feels unlikely. Some volatility, though, makes sense.
There are clear pockets of excitement and froth in areas like space and drones. That said, the bigger macro trend still points higher, even if we run into some bumps in the short term.
Overall, this price action looks healthy. I don’t see any major red flags yet. What we’re seeing is rotation, and rotation is the fuel of a long lasting bull market. Money is moving into new stocks and new sectors.
Lin
Jan 18, 2026
Weekly Market Update: Rotation
We’re not even 3 weeks into 2026, and it already feels like 3 months have passed.
A lot has already happened. Over the last decade the markets have started to move much faster now. News. Reactions. Pullbacks, rallies, rotations. Everything is compressed.
This week the broader market pulled back a bit even though we saw record earnings from TSMC. The selloff came from somewhere else. Rising yields and fresh talk about who the next Fed Chair might be.
That’s how markets work. The story changes every day.
One day it’s rates. The next it’s geopolitics. Then central banks. Then tariffs. And so forth.
Just over the weekend, Trump announced new tariffs targeting Europe, tied to the US pushing to buy Greenland. This is the environment we’re in right now. There is always a new headline. Always a new reason for fear or excitement.With earnings season starting again, so expect volatility to return.
All major indices ended the week in the red. But not everything was down. Bitcoin, gold, and Small caps were up. That tells you money did not leave the market. It just rotated.
The Nasdaq and S&P 500 are essentially flat over the last four months.
Long periods of consolidation usually don’t last forever. They tend to lead to a big expansion move. The only question is the direction.
Ideally, we see QQQ break out of this range. But a breakdown is also possible. That’s the reality of markets. Nobody knows anything for sure. What we can do is study history, look at the data, and consider different scenarios to form a hypothesis.
Only time will tell. But it will likely be coming sooner rather than later.
Interestingly, the big tech stocks aren’t really moving together anymore. The average correlation between the Mag 7 is close to 0. In simple terms, they’re no longer acting like one big group. Investors are trying to separate the winners from the losers. Right now, Google and Amazon are the ones holding up best.
Except for some weakness in a few areas, most other sectors are actually doing fine.
Market breadth keeps getting better, and that’s important. More stocks are participating. Last week, more than 250 NYSE stocks hit new 52 week highs. That’s rare. It has only happened 18 times since 1970.
History is pretty clear here. In the prior 17 cases, the S&P 500 was higher 12 months later 88% of the time. Of course, nothing is ever guaranteed, but improving market breadth like this usually shows the market is healthier than the headlines may make it seem.
Even crypto is starting to come back to life.
Bitcoin ETF inflows this year have reached about 3.8K BTC. That’s slightly more than the 3.5K BTC we saw in the same period last year. This is still early in the year. That’s important because January is usually quiet for crypto flows. The bigger inflows tend to show up later, often between February and April.
Small caps are off to a strong start.
The Russell 2000 is up more than 7% to start 2026. That’s the best first 10 days of a year since 1987. A very uncommon move. In fact, the Russell 2000 has now outperformed the S&P 500 over the last 3 months.
Small caps are clearly leading. And there’s a good chance that leadership continues through the year. It’s another sign the market is broadening out, not narrowing.
January’s performance is worth paying attention to, mostly because history has been pretty clear on this.
If January finishes higher, it’s usually a good sign for the rest of the year. When January is up, the final 11 months tend to do even better. And when January is up more than 2%, the rest of the year is higher almost 85% of the time, with returns of more than 12% on average.
Of course, nothing is guaranteed. But it’s worth keeping on the radar.
Wall Street is very bullish on 2026. And when you zoom out, it’s not hard to see why.
Stocks are at record highs.
Gold is at a record high.
Silver is at a record high.
Home prices are at record highs.
Copper is at a record high.
Platinum is at a record high.
Money market funds are at record highs.
Almost everything you look at is sitting at or near an all time high. So it really shouldn’t surprise anyone that bullishness is also at a record level.
The only thing that’s a bit worrying is when almost everyone is bullish and on the same side of the boat. There aren’t many new buyers left, expectations get really high, and even a small surprise can move the market more than people expect.
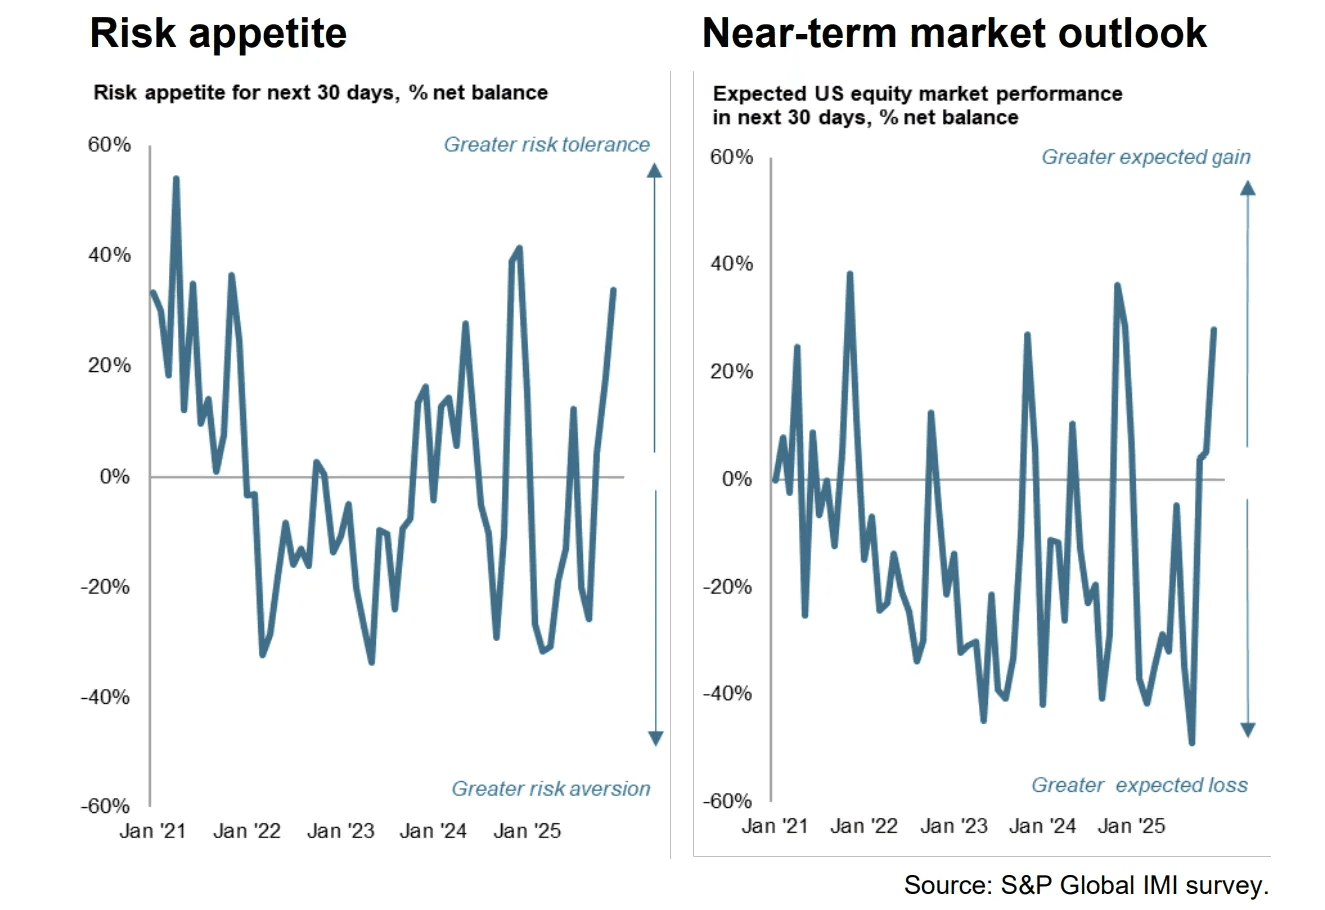
And it’s not surprising that risk appetite has increased a lot. You can see it clearly in the market. More speculative themes like rare earths, space, robotics, biotech, nuclear, crypto, drones, and quantum are all starting to take off.
By itself, that’s not a bad thing. You can actually benefit from it if you play it right. But you have to manage risk and your exposure at all times.
This is a big change from where things were just a month ago.
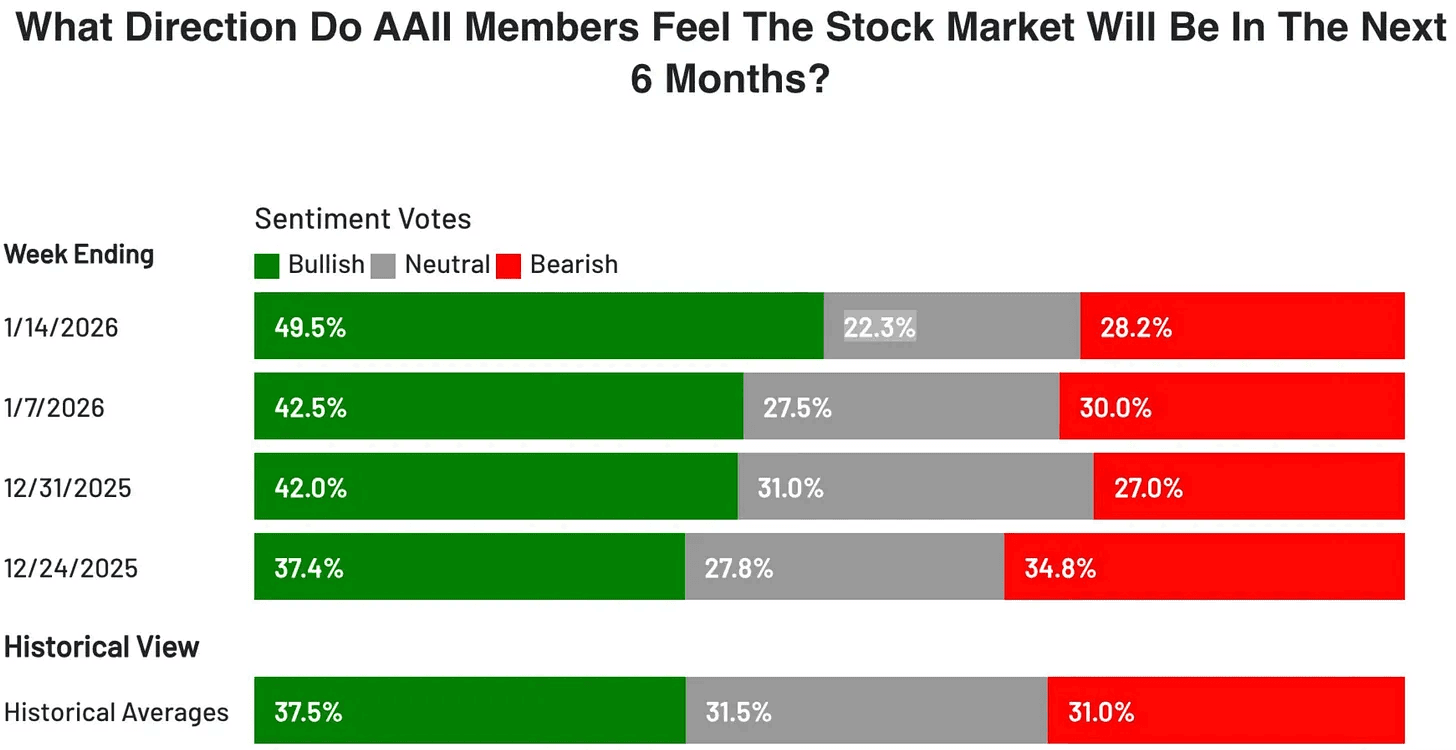
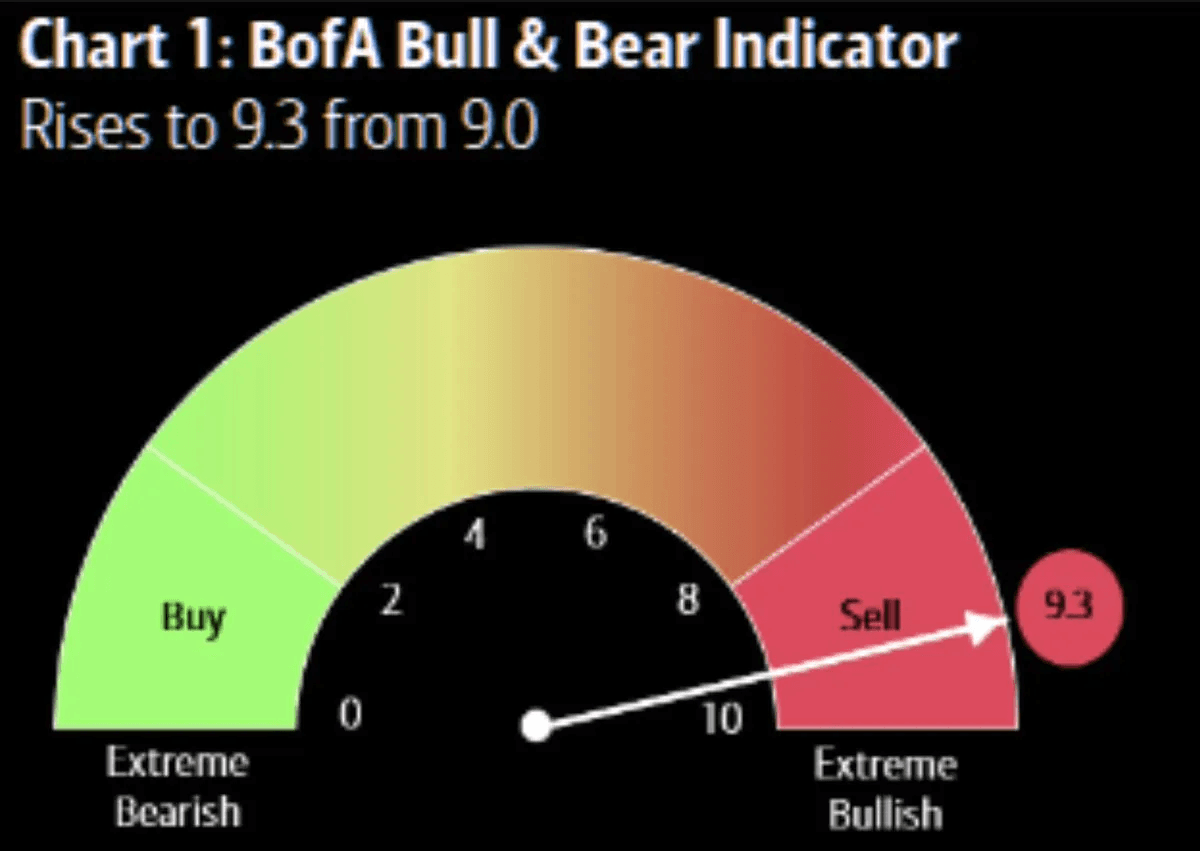
The AAII sentiment survey is now at 49.5%, the highest level we’ve seen in the past year. The Fear and Greed index has also flipped back to Greed for the first time in what feels like forever. On top of that, the BofA Bull and Bear indicator is now at 9.3.
It’s worth paying attention. That’s enough to start being a bit more cautious.
Goldman’s Marquee client poll shows bullishness at levels we’ve only seen three other times in the past decade. Late 2017, late 2020, and late 2024. In 2 of those cases, the market saw a correction within about 3 months.
For now though, the music is still playing. And there’s no clear sign that it’s about to stop.
Retail traders have carried their buying streak into the new year after a record 2025. In the first 4 trading days of January, purchases hit the second highest level in almost 8 months.
Earnings season is well underway, and this week brings a few important reports.
Netflix will give us a good read on the consumer and whether discretionary spending is still holding up. Intel is another key one. Expectations are high after its recent stock run, so the bar is set pretty high.
I’ll be paying more attention to the guidance and management commentary than just the headline numbers. Intuitive Surgical is also worth watching. Last quarter it had a huge earnings gap, and the market will be looking to see if it can deliver something similar again this time.
A lot of banks are reporting as well, along with a few smaller names like Mobileye ($MBLY).
Wars, unemployment, the Fed, Greenland. There is always noise in the market, and there always will be.
That noise isn’t all bad. But at the end of the day, what really matters for stocks is earnings. A lot of things affect earnings, but the direction of those earnings is the long term driver of stock prices.
Over time, prices follow profits.
The chart below shows this clearly over the last 25 years. Forward looking earnings move closely with stock prices. There are ups and downs, times when the market runs ahead or falls behind, but over the long run, earnings and prices tend to move together.
This bull market isn’t ending anytime soon, but it does suggest we could see some short term volatility.
Pullbacks are normal. In fact, 94% of years see at least a 5% pullback in the S&P 500. And about 63% of the time, we get a pullback of 10% or more.
Volatility is the price of admission. If you want to take part in the greatest wealth building machine on earth, you have to accept those swings. If the market were risk free, everyone would be doing it. Unfortunately, t’s not.
There are a few things to watch. Earnings are coming up. On the macro side, we have new tariff threats, Iran, and the whole Greenland situation. To me, this is mostly noise. It can create some short term volatility, but nothing that changes the bigger picture. If we were to get another pullback like we saw in April because of headlines like this, that would be a gift. I think the market has learned its lesson, and a selloff like that feels unlikely. Some volatility, though, makes sense.
There are clear pockets of excitement and froth in areas like space and drones. That said, the bigger macro trend still points higher, even if we run into some bumps in the short term.
Overall, this price action looks healthy. I don’t see any major red flags yet. What we’re seeing is rotation, and rotation is the fuel of a long lasting bull market. Money is moving into new stocks and new sectors.
Lin
Jan 18, 2026
Weekly Market Update: Rotation
We’re not even 3 weeks into 2026, and it already feels like 3 months have passed.
A lot has already happened. Over the last decade the markets have started to move much faster now. News. Reactions. Pullbacks, rallies, rotations. Everything is compressed.
This week the broader market pulled back a bit even though we saw record earnings from TSMC. The selloff came from somewhere else. Rising yields and fresh talk about who the next Fed Chair might be.
That’s how markets work. The story changes every day.
One day it’s rates. The next it’s geopolitics. Then central banks. Then tariffs. And so forth.
Just over the weekend, Trump announced new tariffs targeting Europe, tied to the US pushing to buy Greenland. This is the environment we’re in right now. There is always a new headline. Always a new reason for fear or excitement.With earnings season starting again, so expect volatility to return.
All major indices ended the week in the red. But not everything was down. Bitcoin, gold, and Small caps were up. That tells you money did not leave the market. It just rotated.
The Nasdaq and S&P 500 are essentially flat over the last four months.
Long periods of consolidation usually don’t last forever. They tend to lead to a big expansion move. The only question is the direction.
Ideally, we see QQQ break out of this range. But a breakdown is also possible. That’s the reality of markets. Nobody knows anything for sure. What we can do is study history, look at the data, and consider different scenarios to form a hypothesis.
Only time will tell. But it will likely be coming sooner rather than later.
Interestingly, the big tech stocks aren’t really moving together anymore. The average correlation between the Mag 7 is close to 0. In simple terms, they’re no longer acting like one big group. Investors are trying to separate the winners from the losers. Right now, Google and Amazon are the ones holding up best.
Except for some weakness in a few areas, most other sectors are actually doing fine.
Market breadth keeps getting better, and that’s important. More stocks are participating. Last week, more than 250 NYSE stocks hit new 52 week highs. That’s rare. It has only happened 18 times since 1970.
History is pretty clear here. In the prior 17 cases, the S&P 500 was higher 12 months later 88% of the time. Of course, nothing is ever guaranteed, but improving market breadth like this usually shows the market is healthier than the headlines may make it seem.
Even crypto is starting to come back to life.
Bitcoin ETF inflows this year have reached about 3.8K BTC. That’s slightly more than the 3.5K BTC we saw in the same period last year. This is still early in the year. That’s important because January is usually quiet for crypto flows. The bigger inflows tend to show up later, often between February and April.
Small caps are off to a strong start.
The Russell 2000 is up more than 7% to start 2026. That’s the best first 10 days of a year since 1987. A very uncommon move. In fact, the Russell 2000 has now outperformed the S&P 500 over the last 3 months.
Small caps are clearly leading. And there’s a good chance that leadership continues through the year. It’s another sign the market is broadening out, not narrowing.
January’s performance is worth paying attention to, mostly because history has been pretty clear on this.
If January finishes higher, it’s usually a good sign for the rest of the year. When January is up, the final 11 months tend to do even better. And when January is up more than 2%, the rest of the year is higher almost 85% of the time, with returns of more than 12% on average.
Of course, nothing is guaranteed. But it’s worth keeping on the radar.
Wall Street is very bullish on 2026. And when you zoom out, it’s not hard to see why.
Stocks are at record highs.
Gold is at a record high.
Silver is at a record high.
Home prices are at record highs.
Copper is at a record high.
Platinum is at a record high.
Money market funds are at record highs.
Almost everything you look at is sitting at or near an all time high. So it really shouldn’t surprise anyone that bullishness is also at a record level.
The only thing that’s a bit worrying is when almost everyone is bullish and on the same side of the boat. There aren’t many new buyers left, expectations get really high, and even a small surprise can move the market more than people expect.
And it’s not surprising that risk appetite has increased a lot. You can see it clearly in the market. More speculative themes like rare earths, space, robotics, biotech, nuclear, crypto, drones, and quantum are all starting to take off.
By itself, that’s not a bad thing. You can actually benefit from it if you play it right. But you have to manage risk and your exposure at all times.
This is a big change from where things were just a month ago.
The AAII sentiment survey is now at 49.5%, the highest level we’ve seen in the past year. The Fear and Greed index has also flipped back to Greed for the first time in what feels like forever. On top of that, the BofA Bull and Bear indicator is now at 9.3.
It’s worth paying attention. That’s enough to start being a bit more cautious.
Goldman’s Marquee client poll shows bullishness at levels we’ve only seen three other times in the past decade. Late 2017, late 2020, and late 2024. In 2 of those cases, the market saw a correction within about 3 months.
For now though, the music is still playing. And there’s no clear sign that it’s about to stop.
Retail traders have carried their buying streak into the new year after a record 2025. In the first 4 trading days of January, purchases hit the second highest level in almost 8 months.
Earnings season is well underway, and this week brings a few important reports.
Netflix will give us a good read on the consumer and whether discretionary spending is still holding up. Intel is another key one. Expectations are high after its recent stock run, so the bar is set pretty high.
I’ll be paying more attention to the guidance and management commentary than just the headline numbers. Intuitive Surgical is also worth watching. Last quarter it had a huge earnings gap, and the market will be looking to see if it can deliver something similar again this time.
A lot of banks are reporting as well, along with a few smaller names like Mobileye ($MBLY).
Wars, unemployment, the Fed, Greenland. There is always noise in the market, and there always will be.
That noise isn’t all bad. But at the end of the day, what really matters for stocks is earnings. A lot of things affect earnings, but the direction of those earnings is the long term driver of stock prices.
Over time, prices follow profits.
The chart below shows this clearly over the last 25 years. Forward looking earnings move closely with stock prices. There are ups and downs, times when the market runs ahead or falls behind, but over the long run, earnings and prices tend to move together.
This bull market isn’t ending anytime soon, but it does suggest we could see some short term volatility.
Pullbacks are normal. In fact, 94% of years see at least a 5% pullback in the S&P 500. And about 63% of the time, we get a pullback of 10% or more.
Volatility is the price of admission. If you want to take part in the greatest wealth building machine on earth, you have to accept those swings. If the market were risk free, everyone would be doing it. Unfortunately, t’s not.
There are a few things to watch. Earnings are coming up. On the macro side, we have new tariff threats, Iran, and the whole Greenland situation. To me, this is mostly noise. It can create some short term volatility, but nothing that changes the bigger picture. If we were to get another pullback like we saw in April because of headlines like this, that would be a gift. I think the market has learned its lesson, and a selloff like that feels unlikely. Some volatility, though, makes sense.
There are clear pockets of excitement and froth in areas like space and drones. That said, the bigger macro trend still points higher, even if we run into some bumps in the short term.
Overall, this price action looks healthy. I don’t see any major red flags yet. What we’re seeing is rotation, and rotation is the fuel of a long lasting bull market. Money is moving into new stocks and new sectors.
Exposure Level
Guidance:
Buy
0%
100%
Trend Indicator
Long-Term:
Up
Intermediate-Term:
Sideways
Short-Term:
Sideways
Risk Indicators
Volatility:
Elevated
Sentiment:
Neutral
Momentum:
Risk-On
Leading Sectors
View All
Chips
Space
Drones
BioTech
Defense
Batteries
Rare Earths
AI Infrastructure
Exposure Level
Guidance:
Buy
0%
100%
Trend Indicator
Long-Term:
Up
Intermediate-Term:
Sideways
Short-Term:
Sideways
Risk Indicators
Volatility:
Elevated
Sentiment:
Neutral
Momentum:
Risk-On
Leading Sectors
View All
Chips
Space
Drones
BioTech
Defense
Batteries
Rare Earths
AI Infrastructure
Exposure Level
Guidance:
Buy
0%
100%
Trend Indicator
Long-Term:
Up
Intermediate-Term:
Sideways
Short-Term:
Sideways
Risk Indicators
Volatility:
Elevated
Sentiment:
Neutral
Momentum:
Risk-On
Leading Sectors
View All
Chips
Space
Drones
BioTech
Defense
Batteries
Rare Earths
AI Infrastructure