Live Feed
Live Feed
Real-Time Market Updates
Real-Time Market Updates
Turn on notifications to stay updated in real time
here.
Market Opportunities
View All

Lin
NVT
Bullish
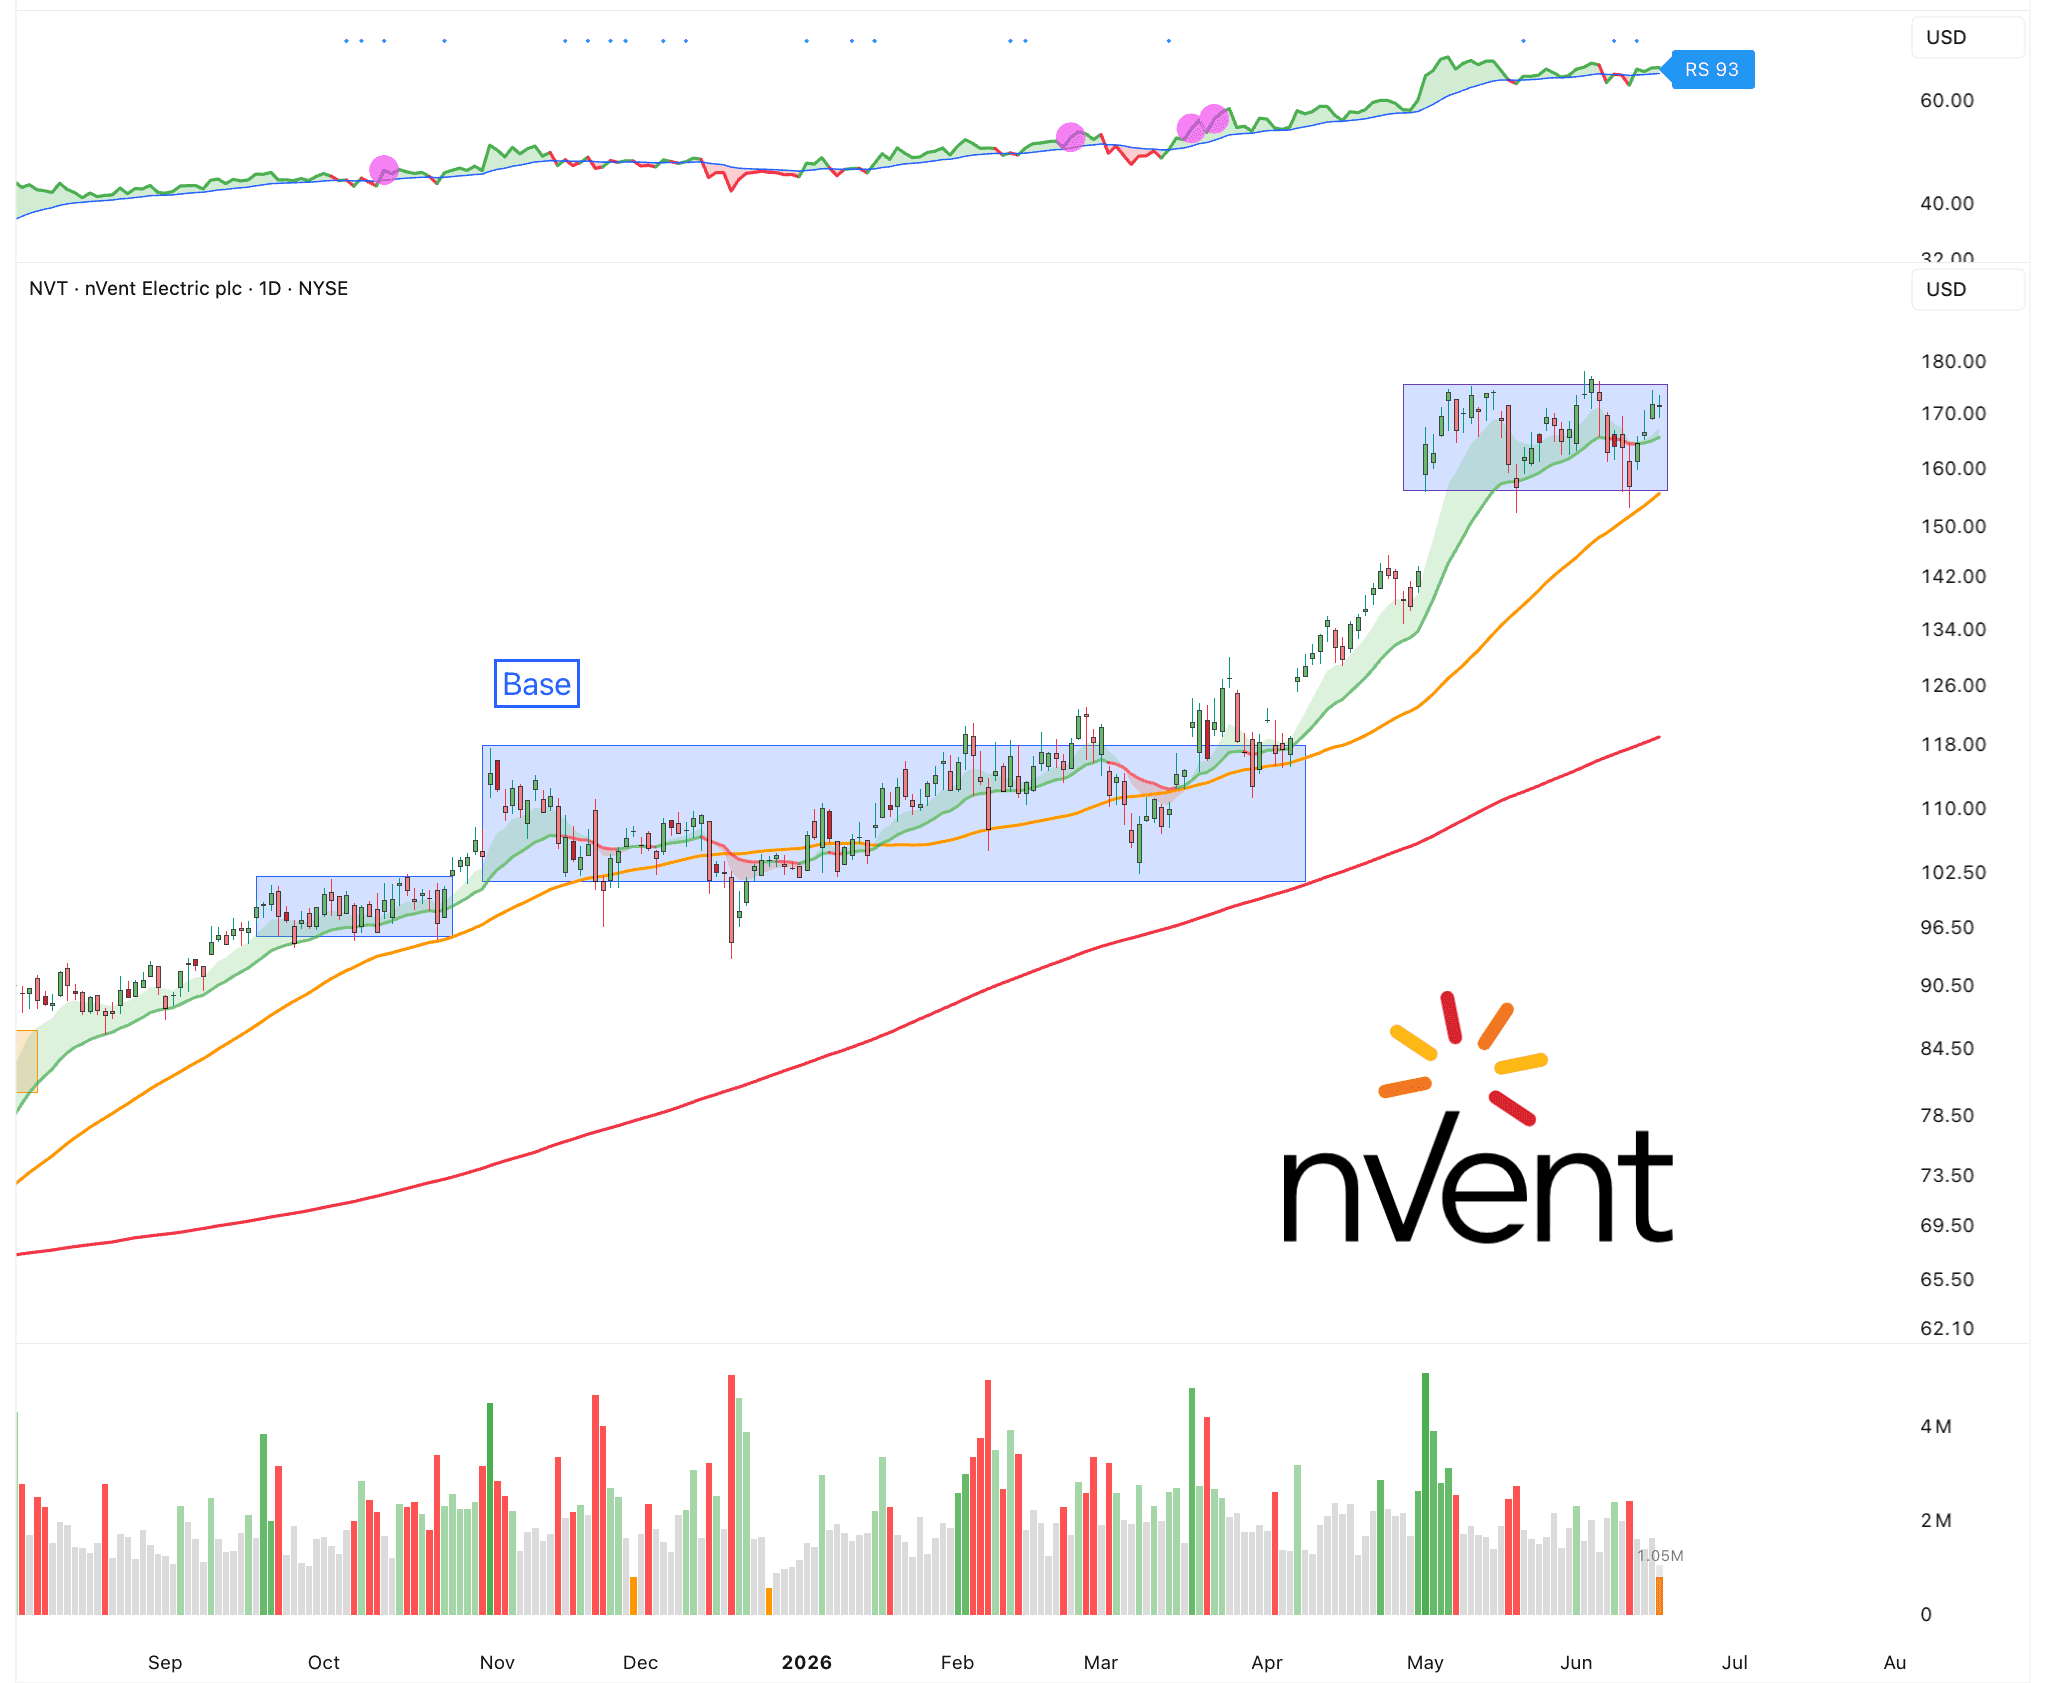
nVent Electric $NVT
AI needs physical infrastructure. Chips are critical, but chips alone are not enough. AI computer requires power, racks, cooling, enclosures, and protection.
nVent makes electrical connection and protection products that sit inside mission-critical infrastructure. That includes enclosures, racks, power connections, fastening systems, liquid cooling infrastructure, modular electrical buildings, and protection solutions for data centers, utilities, industrial facilities, and commercial buildings.
AI workloads require dense compute clusters. Dense compute creates more heat, more electrical load, and more complexity inside the data center. That creates demand for liquid cooling, racks, enclosures, power distribution, and protection systems. nVent sells into all of that. It help customers connect, protect, cool, and manage electrical systems safely.
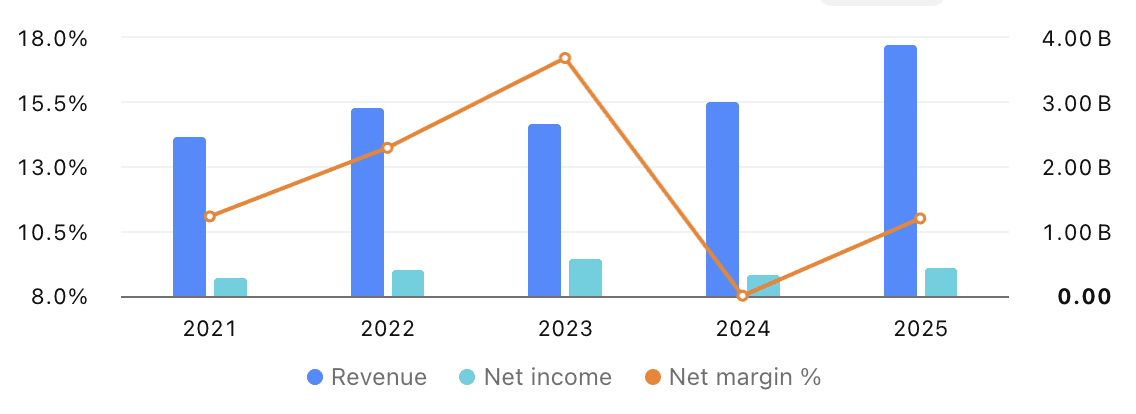
It’s Q1 2026 earnings result was very strong.
Revenue was $1.2 billion, up 53% year over year. Organic growth was 34%. Adjusted EPS was $1.09, up 63%. Adjusted operating margin stayed at 20%. The standout segment was Systems Protection. Sales grew 76%, with 50% organic growth. Segment income grew 95%, and margin expanded to 22.7%.
But The most important number was backlog: $2.6 billion. Data center demand is clearly propelling demand for the company to new heights.
And right now it’s been building a textbook base and setting up for a breakout.
Company
nVent Electric
Sector
Power Electronics
Grade
B+
Setup
Base
Volatility
Moderate-High
Timeframe
Mid-Term
Read More
Lin
NVT
Bullish
nVent Electric $NVT
AI needs physical infrastructure. Chips are critical, but chips alone are not enough. AI computer requires power, racks, cooling, enclosures, and protection.
nVent makes electrical connection and protection products that sit inside mission-critical infrastructure. That includes enclosures, racks, power connections, fastening systems, liquid cooling infrastructure, modular electrical buildings, and protection solutions for data centers, utilities, industrial facilities, and commercial buildings.
AI workloads require dense compute clusters. Dense compute creates more heat, more electrical load, and more complexity inside the data center. That creates demand for liquid cooling, racks, enclosures, power distribution, and protection systems. nVent sells into all of that. It help customers connect, protect, cool, and manage electrical systems safely.
It’s Q1 2026 earnings result was very strong.
Revenue was $1.2 billion, up 53% year over year. Organic growth was 34%. Adjusted EPS was $1.09, up 63%. Adjusted operating margin stayed at 20%. The standout segment was Systems Protection. Sales grew 76%, with 50% organic growth. Segment income grew 95%, and margin expanded to 22.7%.
But The most important number was backlog: $2.6 billion. Data center demand is clearly propelling demand for the company to new heights.
And right now it’s been building a textbook base and setting up for a breakout.
Company
nVent Electric
Sector
Power Electronics
Grade
B+
Setup
Base
Volatility
Moderate-High
Timeframe
Mid-Term
Read More
Lin
AAOI
Bullish
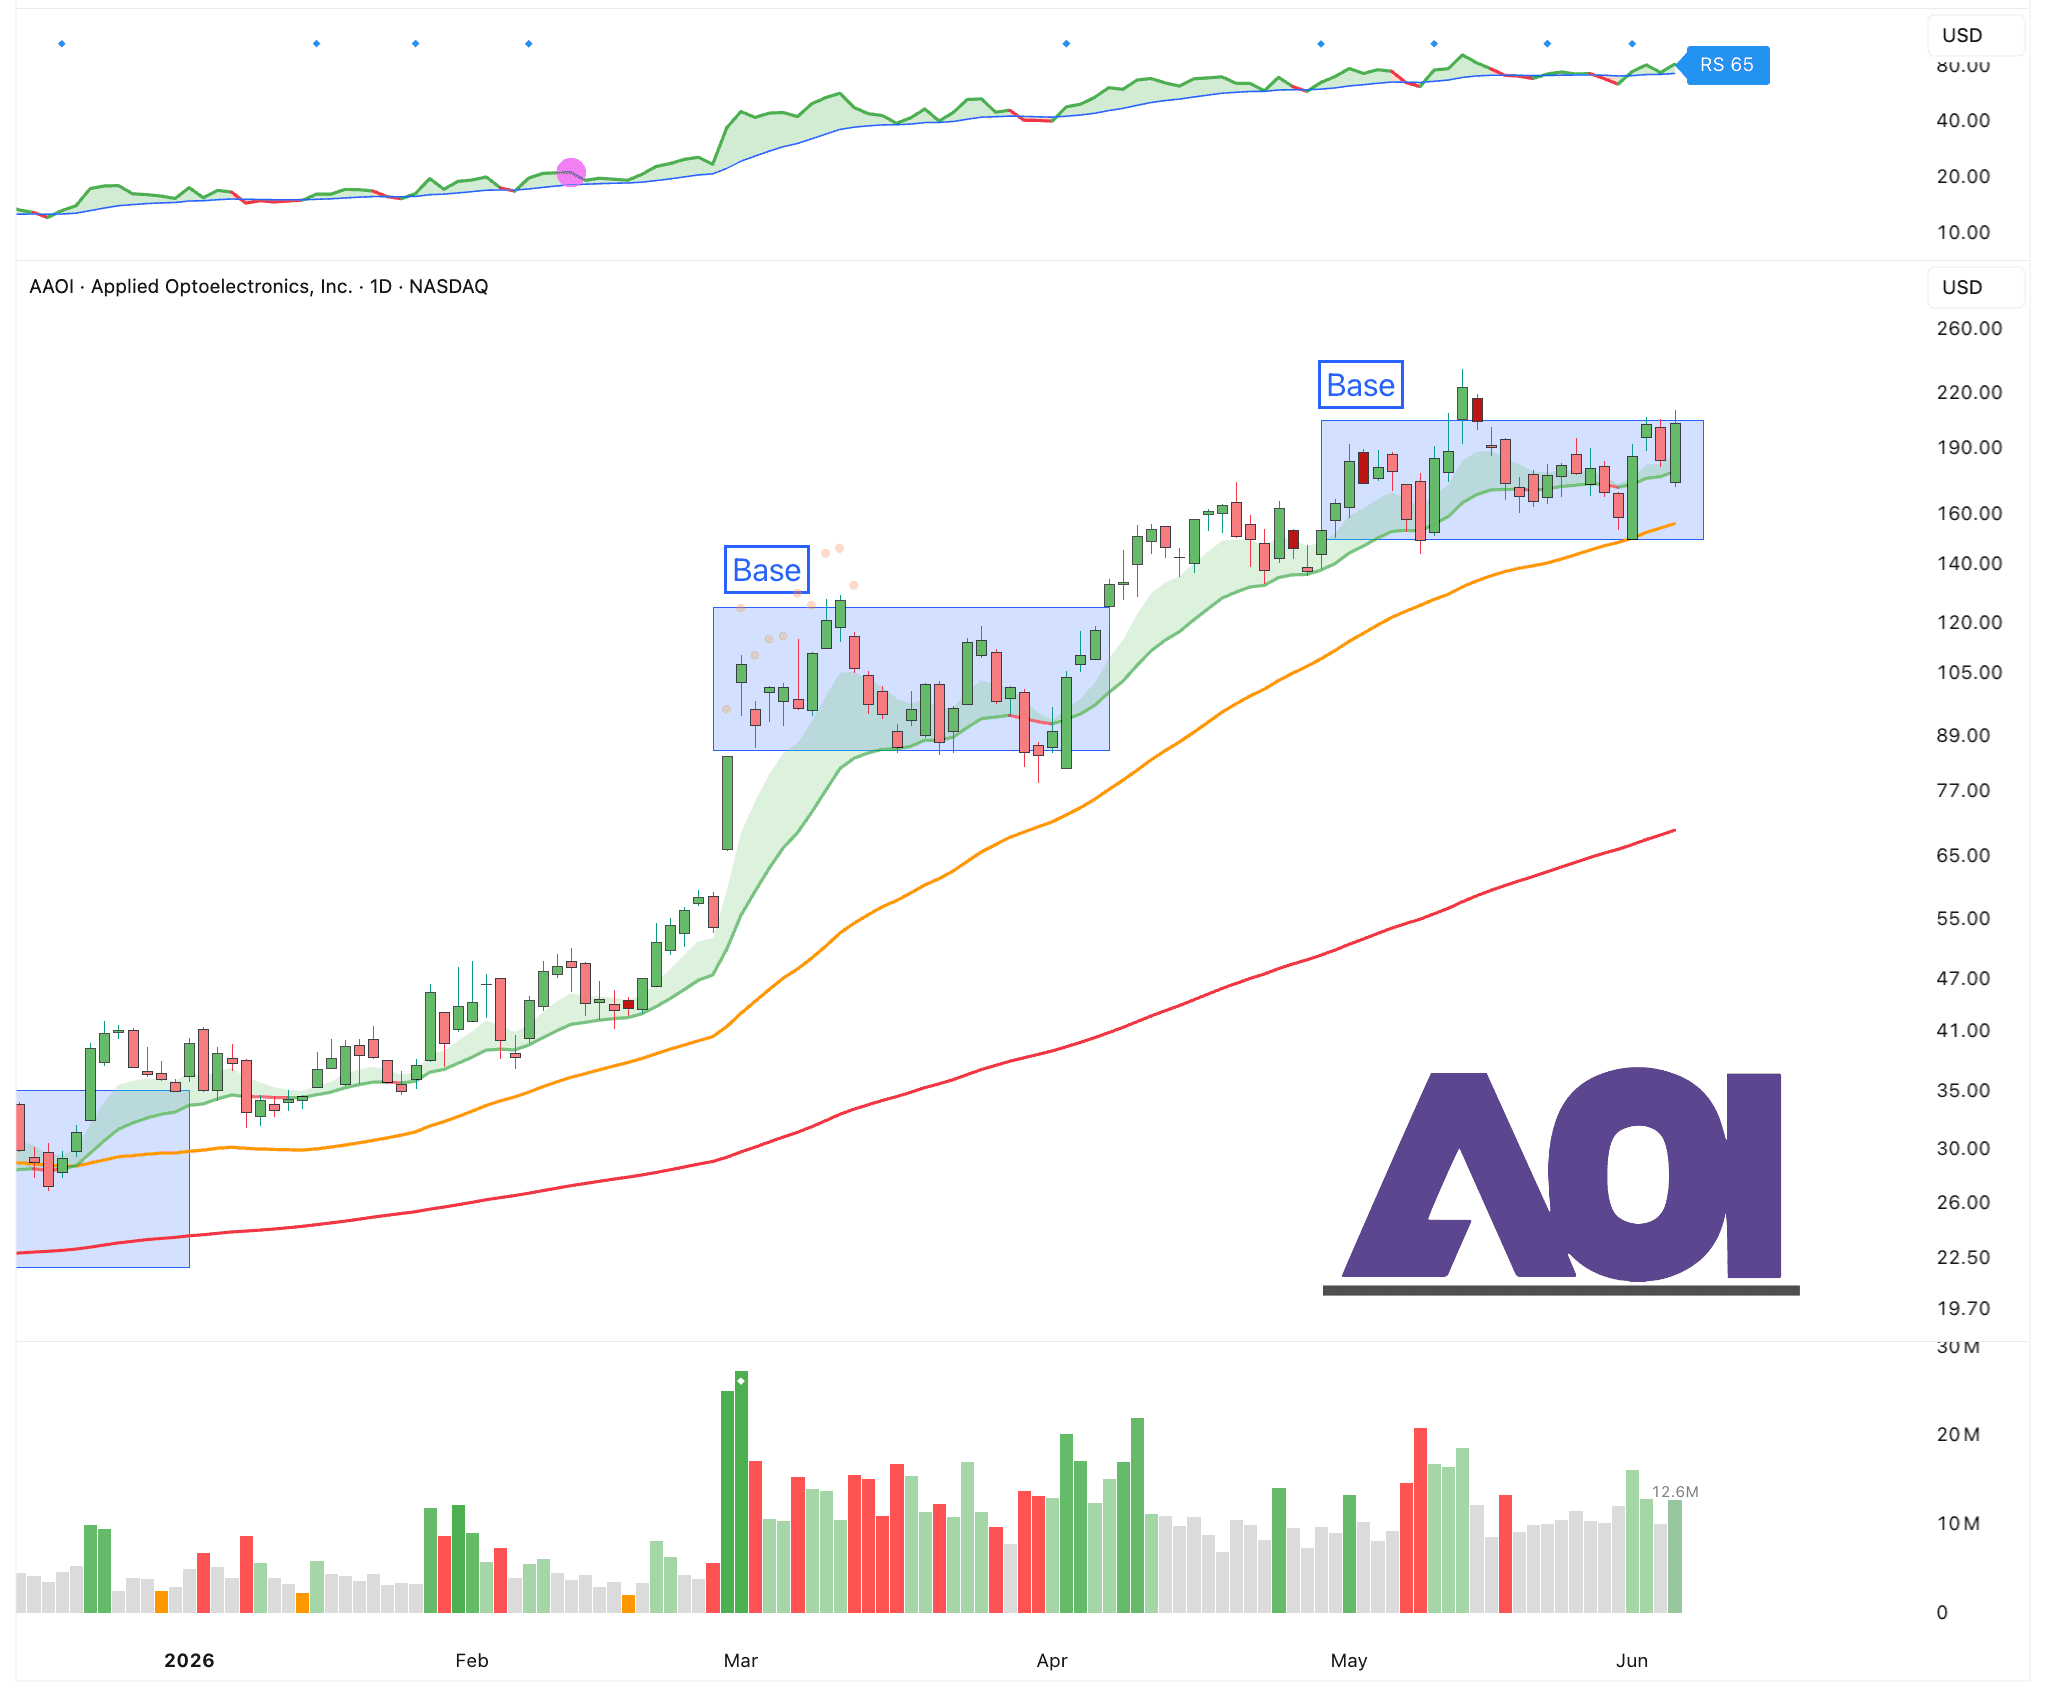
Applied Optoelectronics $AAOI
Applied Optoelectronics $AAOI is one of the more interesting picks-and-shovels names in the AI infrastructure trade.
Every new AI data center needs more GPUs, more power, more cooling, and much faster connections between servers. The larger the clusters get, the more important optical networking becomes. As AI models get bigger and training clusters scale, the amount of data moving through the network explodes. That makes optical networking less of a boring hardware category and more of a core AI infrastructure layer.
Applied Optoelectronics makes optical transceivers, laser components, and networking products used in AI data centers, cable networks, telecom, and fiber access. AI workloads are forcing hyperscalers to upgrade their networks faster, and AAOI is becoming one of the suppliers tied directly to that upgrade cycle. The key product cycle is 800G, with 1.6T coming after that. These are high-speed optical transceivers that help move massive amounts of data inside and between data centers.
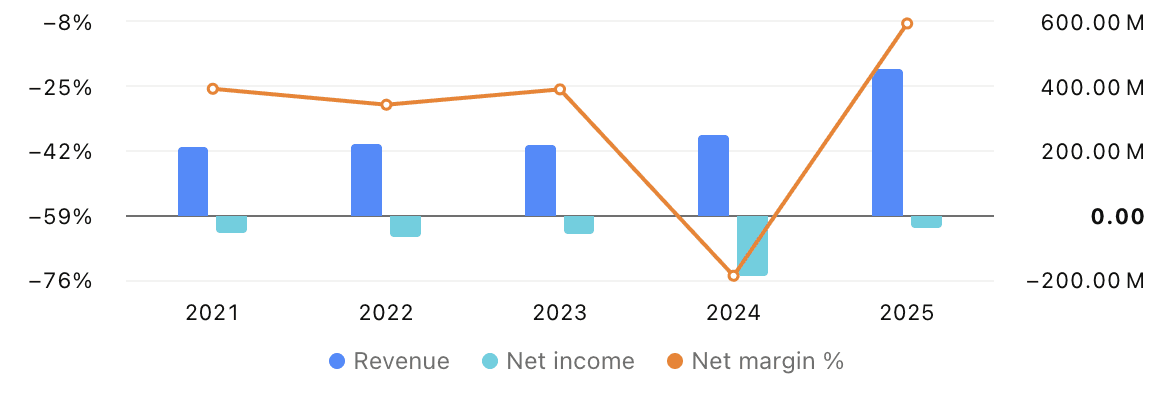
The numbers are starting to show that shift. In Q1 2026, AAOI reported record revenue of about $151 million, up from about $100 million in the prior year period. Data center revenue was about $81 million, making it the largest segment in the quarter.
The most important part of the earnings story was the ramp. Management said it completed the first volume shipment of 800G products to a large hyperscale customer in Q1 and expects a stronger volume ramp starting in Q2. They also guided for Q2 revenue of $180 million to $198 million, which implies another step up from Q1. Even more important, management expects sequential growth through the year, with bigger growth starting in Q3 as more capacity comes online.
This is not a small company selling into weak end markets. It is selling into the biggest AI infrastructure buyers in the world. The company has received new 800G orders from major hyperscale customers, including a $71 million order announced in April 2026. These customers demand quality, volume, reliability, and price. So, this is a meaningful validation point.
It is not the safest way to play AI, but it may be one of the most direct ways to play the optical networking bottleneck. So far, the stock has also been holding up incredibly well and now looks like it is setting up for a potential breakout for its next leg higher.
Company
Applied Optoelectronics
Sector
Networking
Grade
B+
Setup
Breakout
Volatility
Moderate-High
Timeframe
Mid-Term
Read More
Lin
AAOI
Bullish
Applied Optoelectronics $AAOI
Applied Optoelectronics $AAOI is one of the more interesting picks-and-shovels names in the AI infrastructure trade.
Every new AI data center needs more GPUs, more power, more cooling, and much faster connections between servers. The larger the clusters get, the more important optical networking becomes. As AI models get bigger and training clusters scale, the amount of data moving through the network explodes. That makes optical networking less of a boring hardware category and more of a core AI infrastructure layer.
Applied Optoelectronics makes optical transceivers, laser components, and networking products used in AI data centers, cable networks, telecom, and fiber access. AI workloads are forcing hyperscalers to upgrade their networks faster, and AAOI is becoming one of the suppliers tied directly to that upgrade cycle. The key product cycle is 800G, with 1.6T coming after that. These are high-speed optical transceivers that help move massive amounts of data inside and between data centers.
The numbers are starting to show that shift. In Q1 2026, AAOI reported record revenue of about $151 million, up from about $100 million in the prior year period. Data center revenue was about $81 million, making it the largest segment in the quarter.
The most important part of the earnings story was the ramp. Management said it completed the first volume shipment of 800G products to a large hyperscale customer in Q1 and expects a stronger volume ramp starting in Q2. They also guided for Q2 revenue of $180 million to $198 million, which implies another step up from Q1. Even more important, management expects sequential growth through the year, with bigger growth starting in Q3 as more capacity comes online.
This is not a small company selling into weak end markets. It is selling into the biggest AI infrastructure buyers in the world. The company has received new 800G orders from major hyperscale customers, including a $71 million order announced in April 2026. These customers demand quality, volume, reliability, and price. So, this is a meaningful validation point.
It is not the safest way to play AI, but it may be one of the most direct ways to play the optical networking bottleneck. So far, the stock has also been holding up incredibly well and now looks like it is setting up for a potential breakout for its next leg higher.
Company
Applied Optoelectronics
Sector
Networking
Grade
B+
Setup
Breakout
Volatility
Moderate-High
Timeframe
Mid-Term
Read More
Market Updates
View All
Lin
Weekly Market Update: The First Trillionaire
The U.S and Iran reached a peace deal.
Things change quickly in this environment. Every week it’s something new. Tariffs, Iran, inflation, the Fed, recession odds, take your pick.
But the de-escalation in the Middle East removes one of the bigger tail risks investors have been pricing in.
The market also absorbed the SpaceX IPO much better than many expected. There was a lot of talk that a $75B raise would suck liquidity out of the market, but that clearly did not happen.
The last 2 weeks were volatile, but when you zoom out, the bigger picture has not changed. Nothing broke structurally. The bull market is still intact.
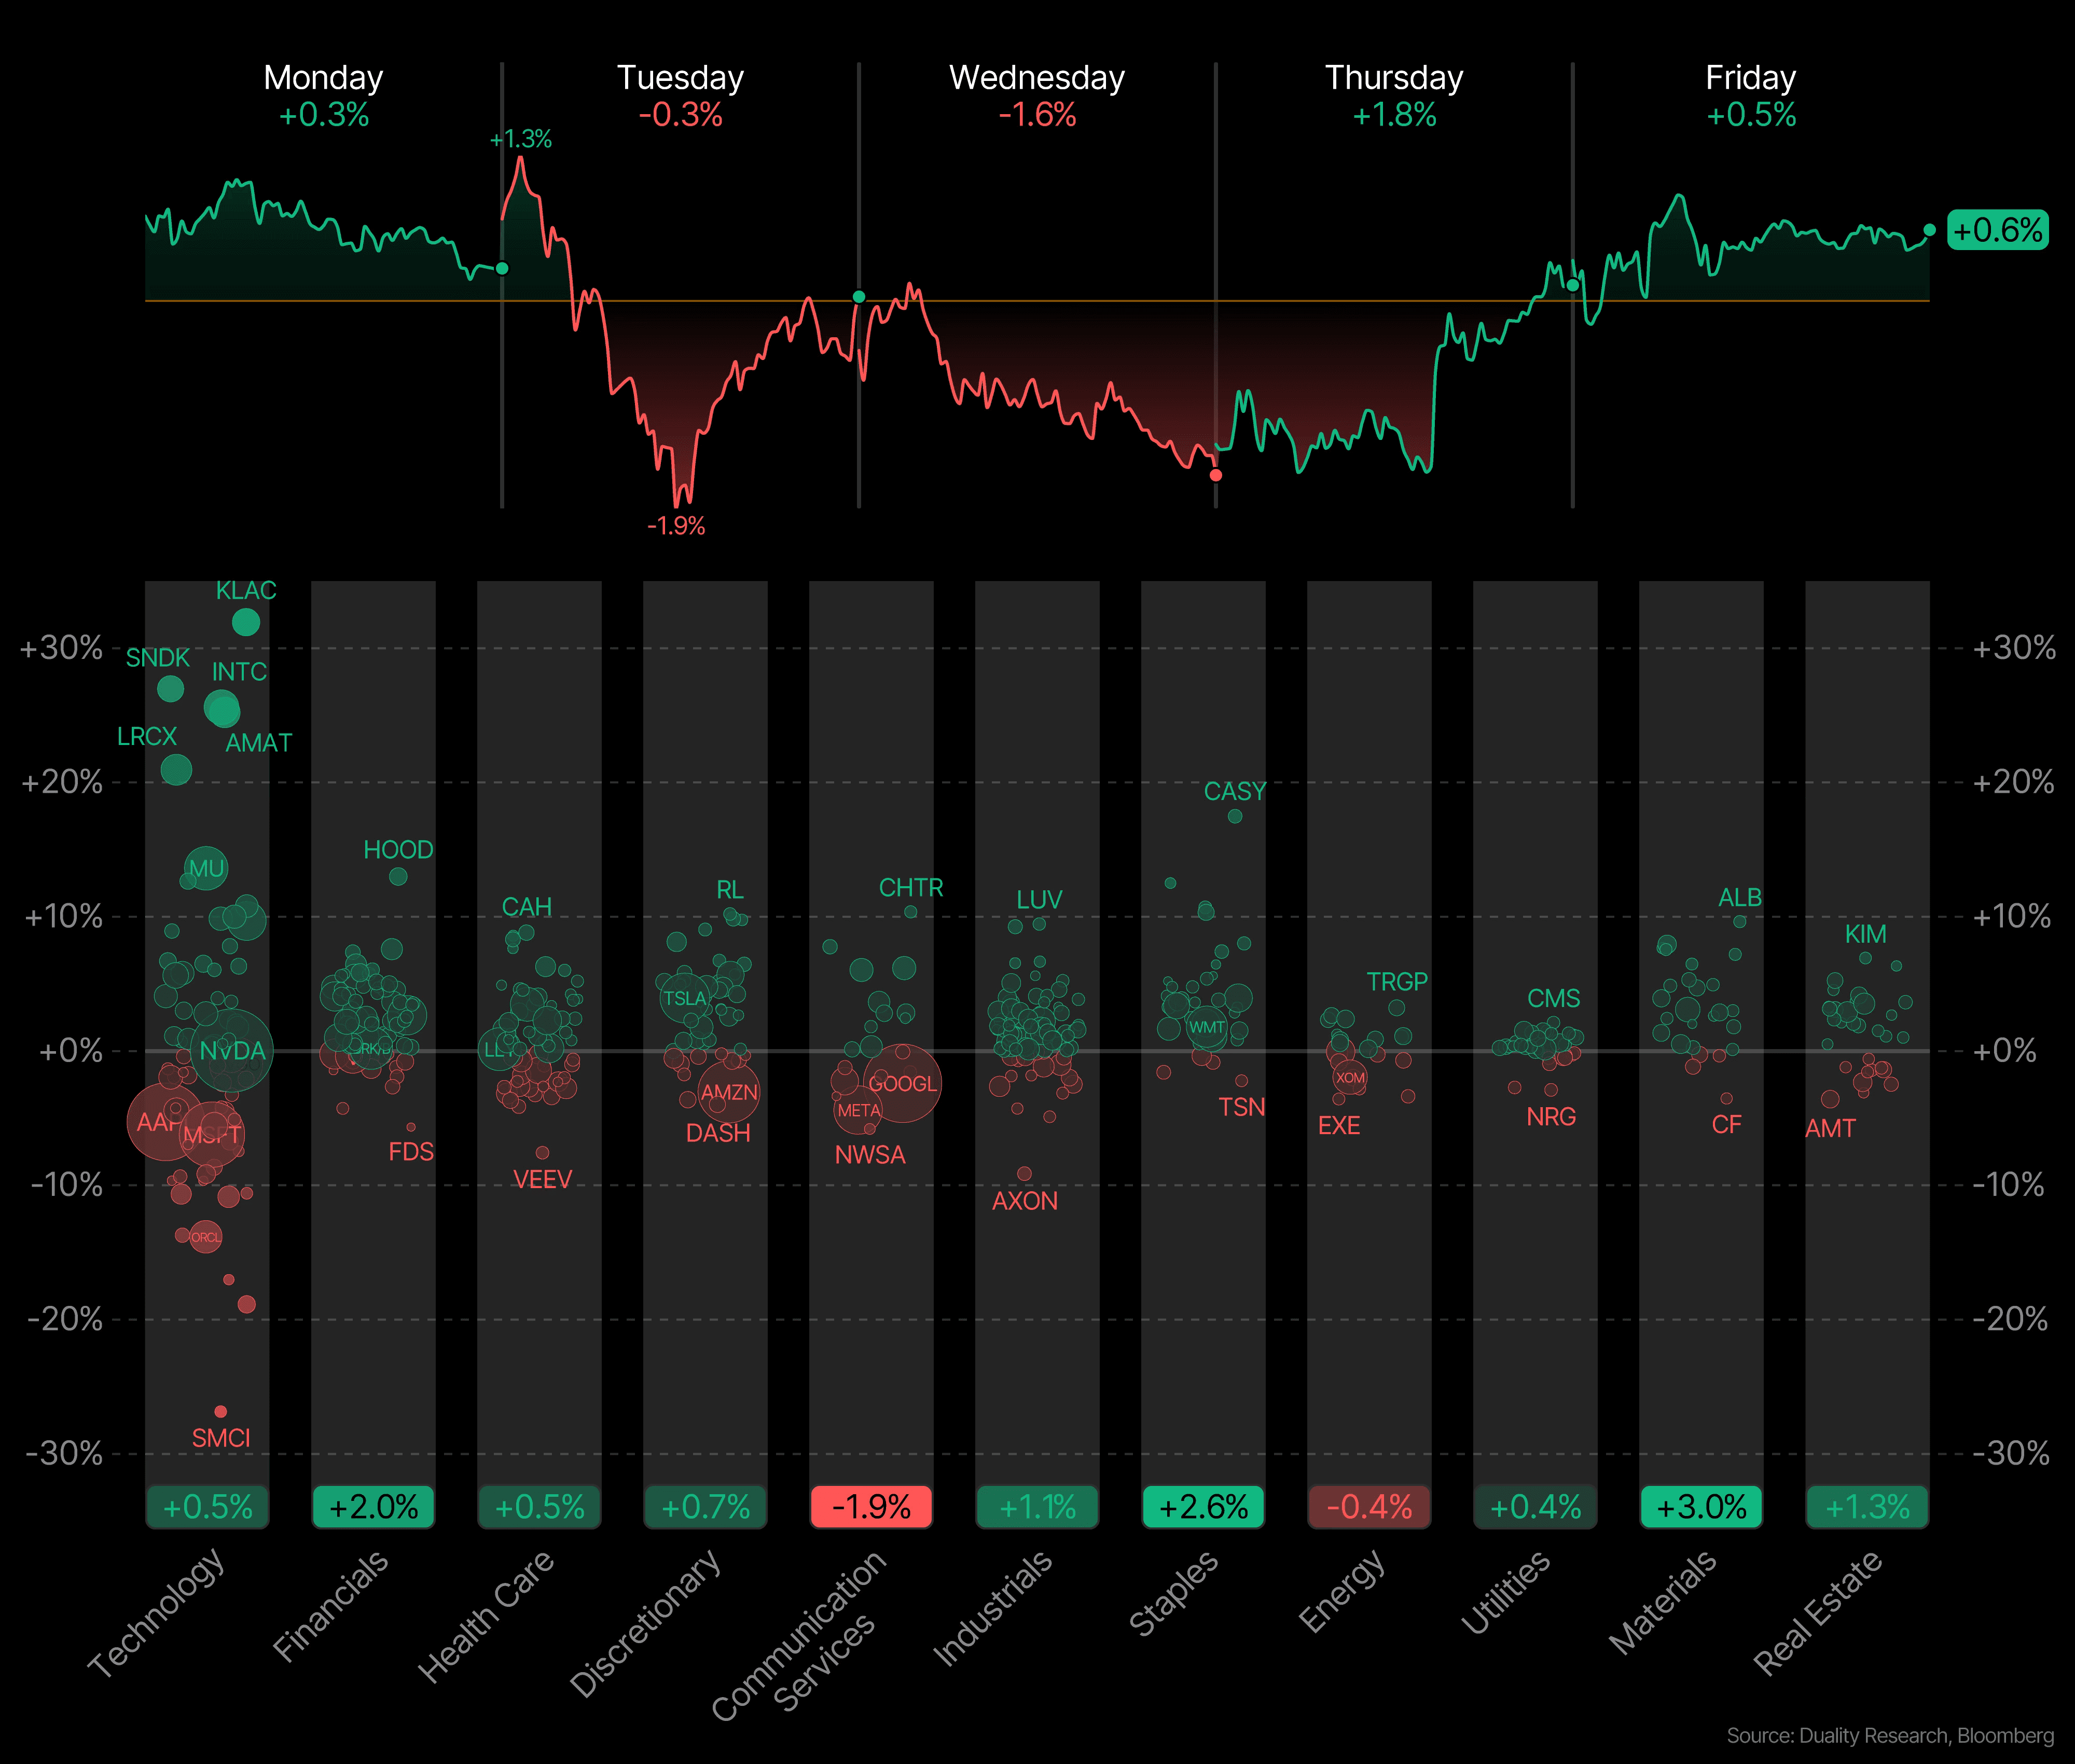
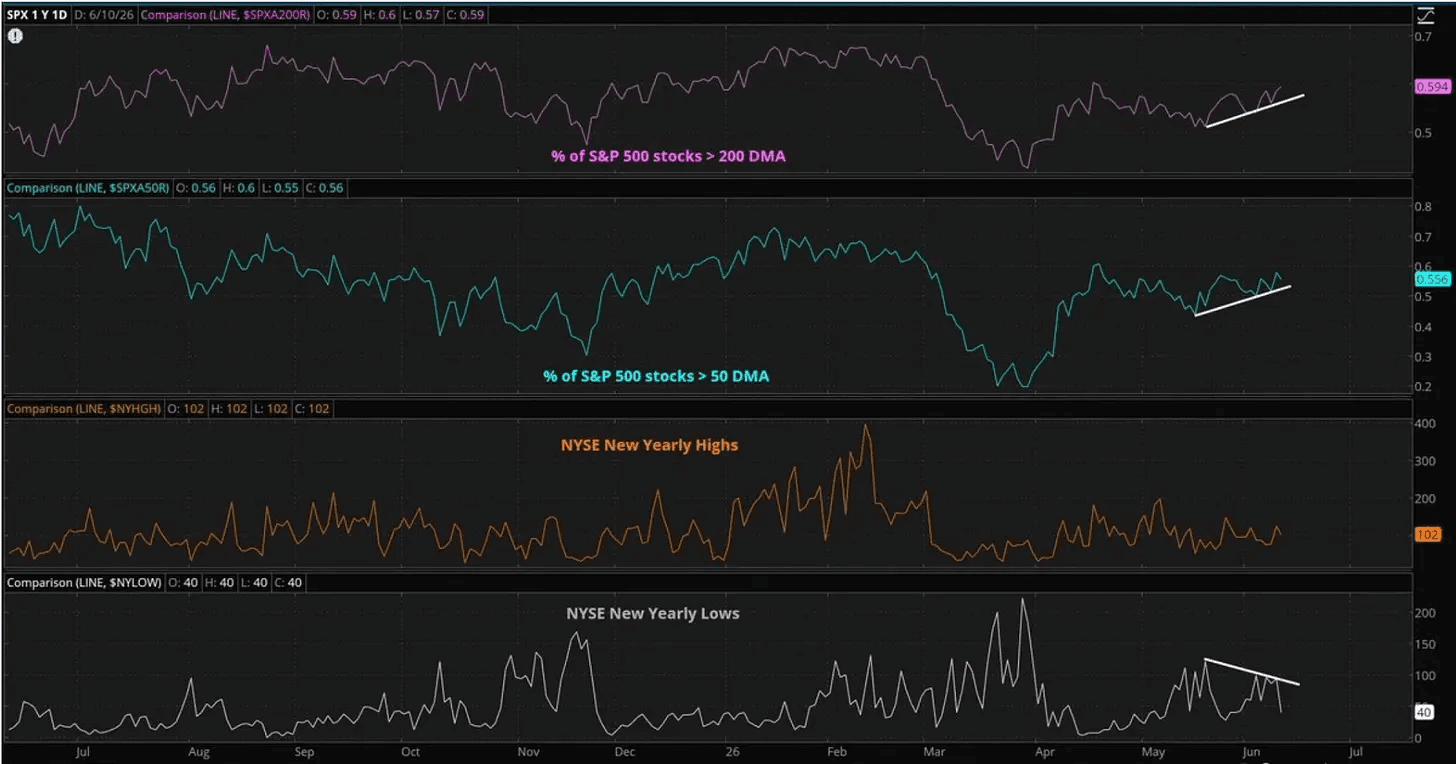
While the S&P 500 was heading for its second weekly decline in a row, the market looked better under the surface. More stocks moved back above their 20-day and 50-day moving averages over the past 2 weeks. At the same time, NYSE new lows kept falling.
It means fewer stocks were breaking down, even though the index looked weak. Money was not leaving the market. It was simply moving into areas that had been lagging. Rotation is what keeps the bull market alive and is often what you want to see during a normal pullback in an uptrend.
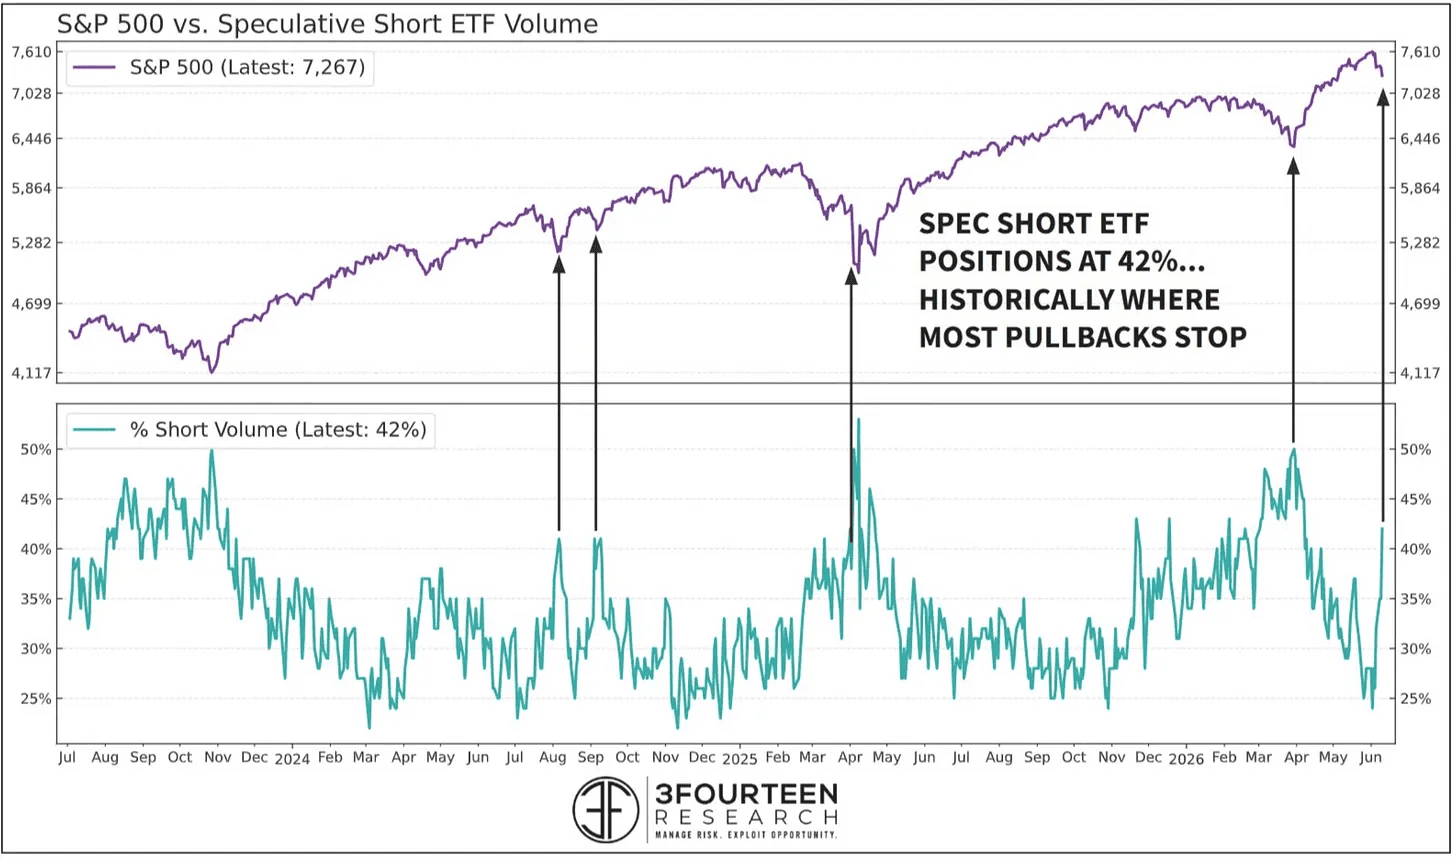
Coming into this week, speculative short ETF volume reached 42% of total short volume. That is a very high level. A lot of investors were betting on more downside. Typically, this is where pullbacks start to stabilize, as long as there is no major negative catalyst.
This is what probably matters most for where stocks go over the next 1 to 2 years.
The market ultimately follows earnings. In the short term, stocks can move on news, rates, and sentiment. But over longer periods, earnings drive stock prices. And earnings are heavily influenced by margins.
So, earnings are not just good. They are historically strong.
S&P 500 profit margins hit 15.6% in Q1 2026 and expected to reach 16.7% in 2027. That is an all-time record.
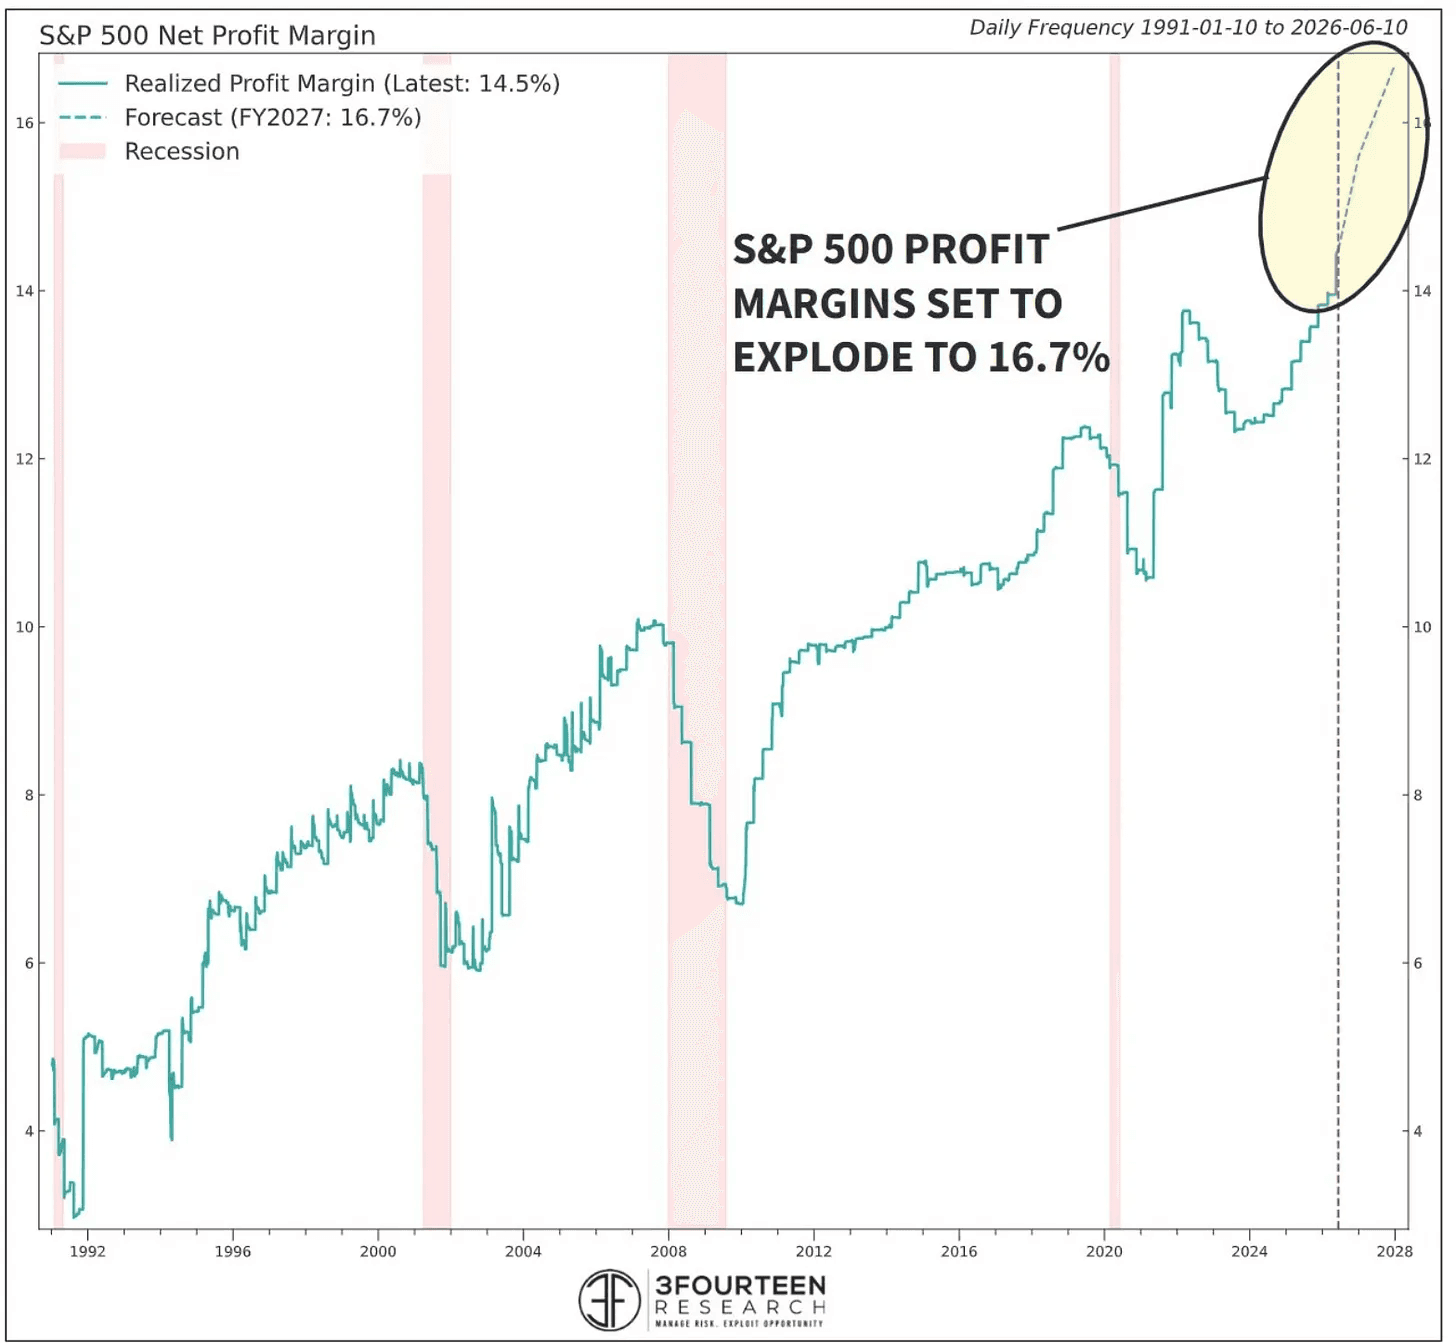
For every dollar of revenue the S&P 500 companies bring in, they are keeping more of it than at almost any point in modern history. More than during the dot-com boom. More than before the financial crisis. More than most periods over the past 20 years.
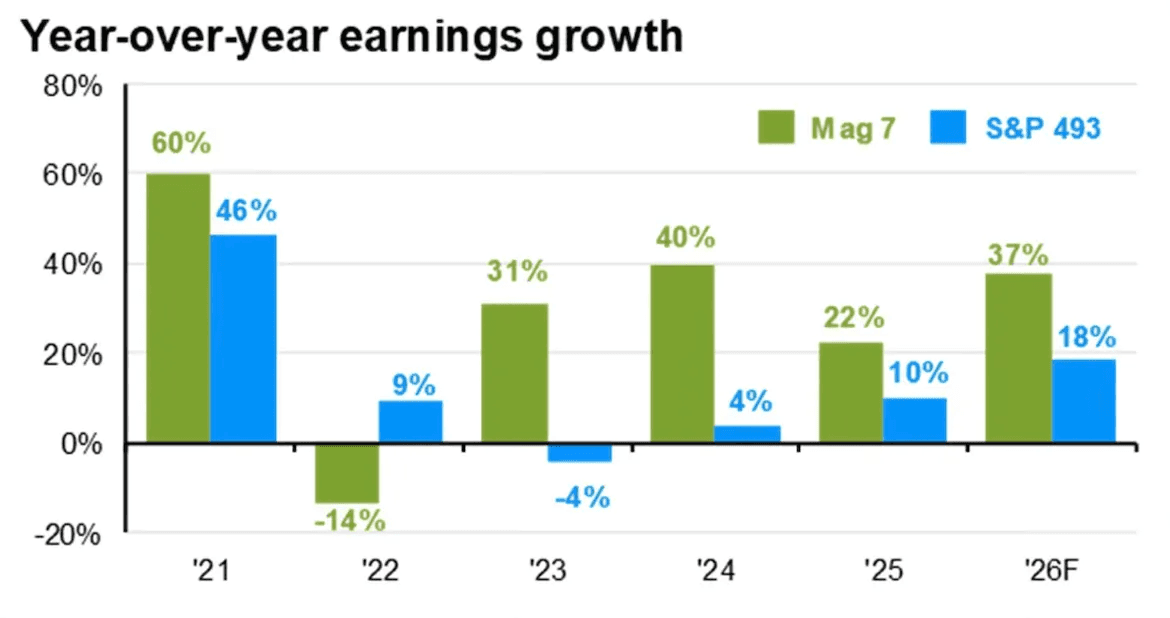
AI is now accelerating that trend. It’s not only helping the Mag 7. It’s spreading across every sector and industry. The other 493 companies are no longer just along for the ride. In fact, he rest of the S&P 500 is now projected to grow earnings by 18% in 2026.
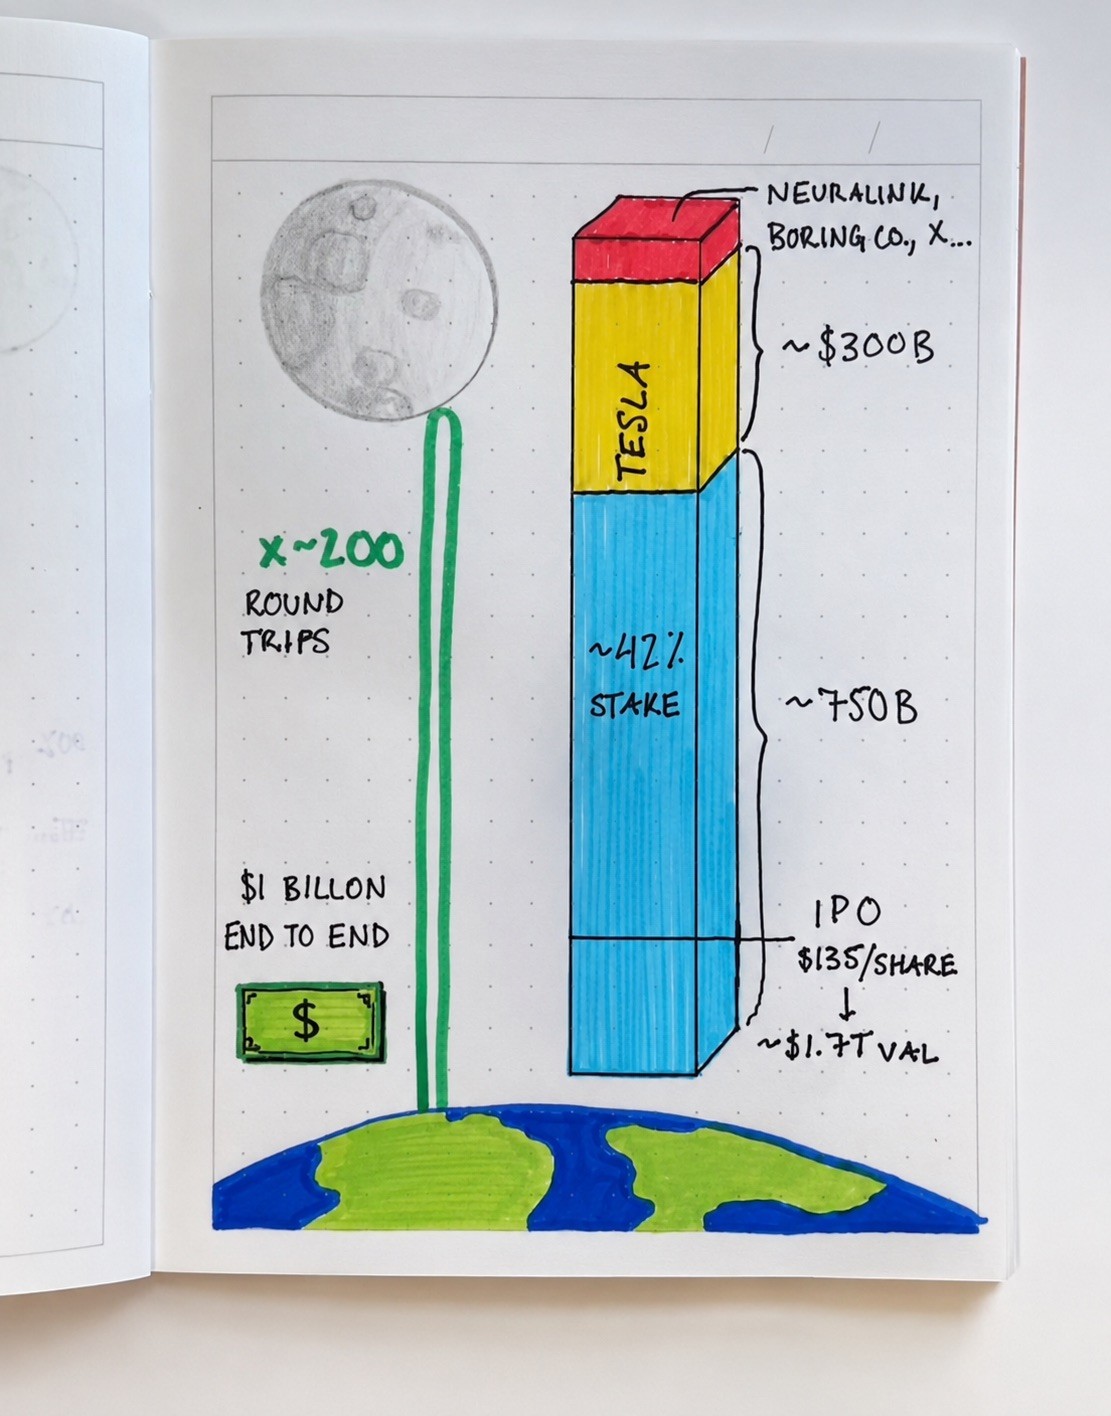
Elon Musk became the world's first trillionaire on Friday, following the record-breaking stock market debut of SpaceX $SPCX.
What’s truly insane is how fast that happened.
In January 2020, Musk was only the 35th richest person in the world, with a fortune of around $28B. 6 years later, he crossed $1T.
But it’s a good reminder of the power of entrepreneurship and compounding.
Musk did not get there by owning a slightly better version of an old business. He got there by building companies around the biggest markets of the next century: electric vehicles, rockets, satellites, energy storage, robotics, AI, and space infrastructure.
The biggest fortunes are created through ownership and compounding.
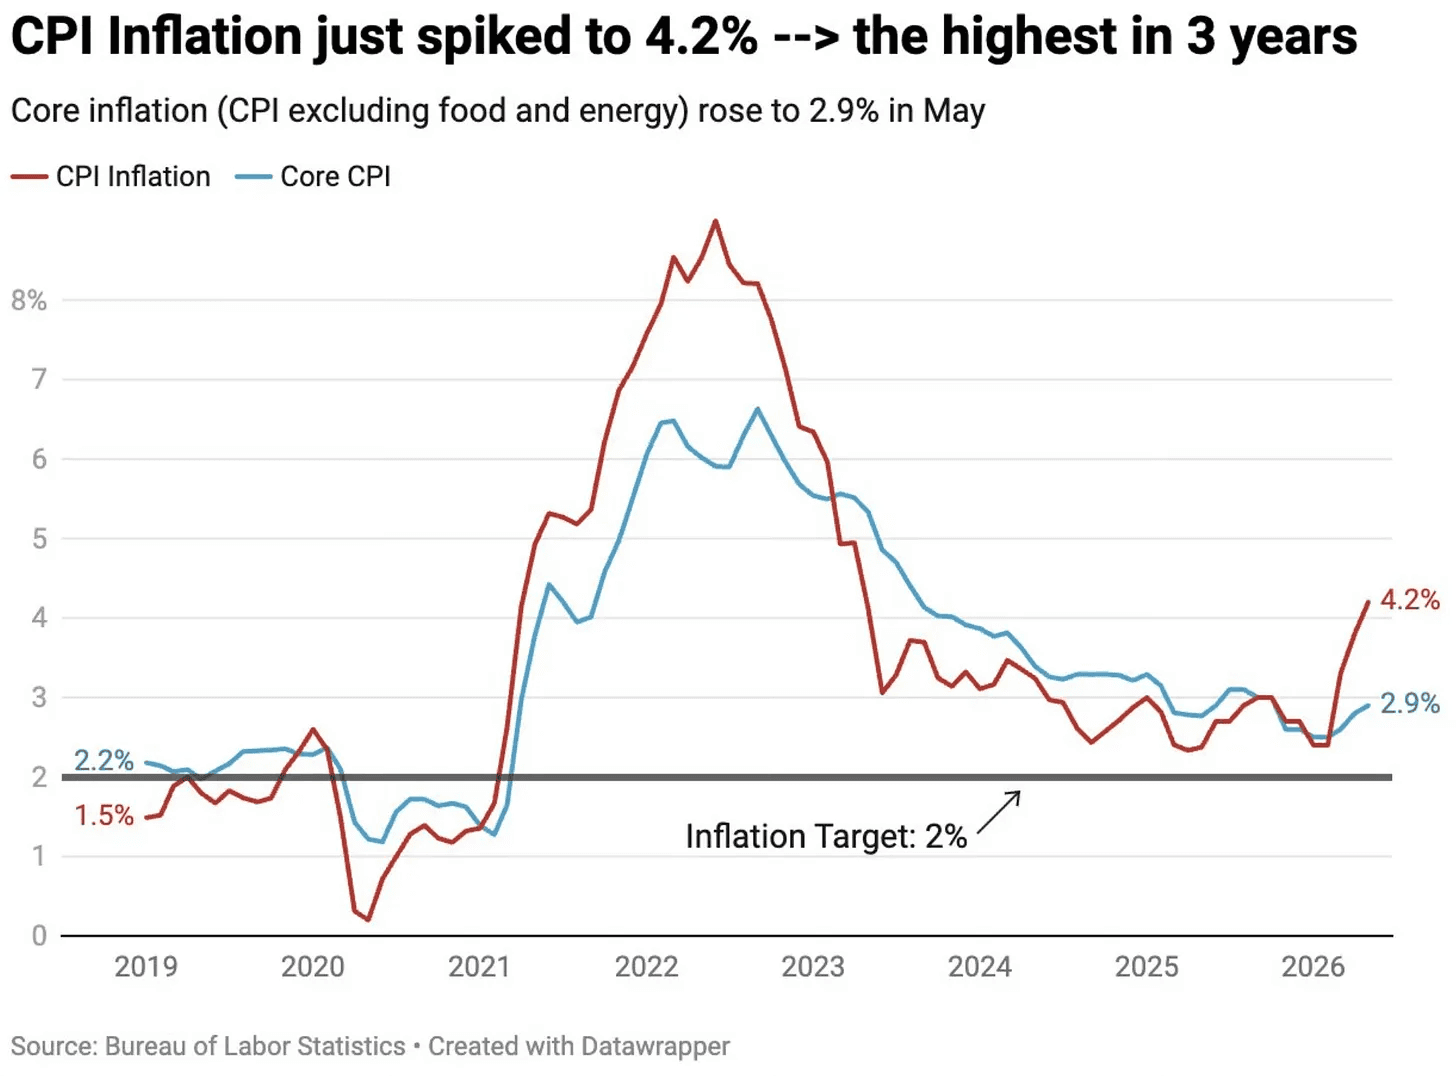
The only major worry right now is inflation. It is moving in the wrong direction again.
4.2% CPI is far above the Fed’s 2% target, and it is the highest reading since April 2023. It also jumped from 2.4% in February to 3.3% in March, 3.8% in April, and 4.2% in May. It has been accelerating for several months.
Higher rates make future earnings worth less today. The Fed has less room to cut rates. Input costs are rising and households have less money to spend.
For now that is no reason to panic but it will be important to monitor going forward.
As mentioned a few days ago there is no reason to believe that this bull market is over.
The market simply reminded everyone this week that stocks do not go straight up forever. And honestly that reset was needed. Pullbacks are difficult to manage in real time, but they are often where the best opportunities lie. Staying involved and managing volatility when things start to feel uncomfortable is one of the hardest things to do. That is the process I tried to lay out in the last Market Update here and why preparation is important. Pretty much all of the names in focus have moved sharply higher.
So, the bigger picture still looks constructive. Hence, I’m still focused on tech because that remains where the strongest earnings growth, margin expansion, and leadership are showing up. Until that changes, I do not see a reason to overcomplicate it.
One important to event to watch this week is Keven Warsh’s first FOMC meeting as Fed Chair. So, that will be important and set the tone for the next few months, especially around inflation, rates, and forward guidance.
The market will be watching the decision, but even more importantly, it will be watching the language. Does the Fed sound more hawkish? Does it leave the door open for cuts? Does it push back against inflation expectations?
Read More
Lin
Weekly Market Update: The First Trillionaire
The U.S and Iran reached a peace deal.
Things change quickly in this environment. Every week it’s something new. Tariffs, Iran, inflation, the Fed, recession odds, take your pick.
But the de-escalation in the Middle East removes one of the bigger tail risks investors have been pricing in.
The market also absorbed the SpaceX IPO much better than many expected. There was a lot of talk that a $75B raise would suck liquidity out of the market, but that clearly did not happen.
The last 2 weeks were volatile, but when you zoom out, the bigger picture has not changed. Nothing broke structurally. The bull market is still intact.
While the S&P 500 was heading for its second weekly decline in a row, the market looked better under the surface. More stocks moved back above their 20-day and 50-day moving averages over the past 2 weeks. At the same time, NYSE new lows kept falling.
It means fewer stocks were breaking down, even though the index looked weak. Money was not leaving the market. It was simply moving into areas that had been lagging. Rotation is what keeps the bull market alive and is often what you want to see during a normal pullback in an uptrend.
Coming into this week, speculative short ETF volume reached 42% of total short volume. That is a very high level. A lot of investors were betting on more downside. Typically, this is where pullbacks start to stabilize, as long as there is no major negative catalyst.
This is what probably matters most for where stocks go over the next 1 to 2 years.
The market ultimately follows earnings. In the short term, stocks can move on news, rates, and sentiment. But over longer periods, earnings drive stock prices. And earnings are heavily influenced by margins.
So, earnings are not just good. They are historically strong.
S&P 500 profit margins hit 15.6% in Q1 2026 and expected to reach 16.7% in 2027. That is an all-time record.
For every dollar of revenue the S&P 500 companies bring in, they are keeping more of it than at almost any point in modern history. More than during the dot-com boom. More than before the financial crisis. More than most periods over the past 20 years.
AI is now accelerating that trend. It’s not only helping the Mag 7. It’s spreading across every sector and industry. The other 493 companies are no longer just along for the ride. In fact, he rest of the S&P 500 is now projected to grow earnings by 18% in 2026.
Elon Musk became the world's first trillionaire on Friday, following the record-breaking stock market debut of SpaceX $SPCX.
What’s truly insane is how fast that happened.
In January 2020, Musk was only the 35th richest person in the world, with a fortune of around $28B. 6 years later, he crossed $1T.
But it’s a good reminder of the power of entrepreneurship and compounding.
Musk did not get there by owning a slightly better version of an old business. He got there by building companies around the biggest markets of the next century: electric vehicles, rockets, satellites, energy storage, robotics, AI, and space infrastructure.
The biggest fortunes are created through ownership and compounding.
The only major worry right now is inflation. It is moving in the wrong direction again.
4.2% CPI is far above the Fed’s 2% target, and it is the highest reading since April 2023. It also jumped from 2.4% in February to 3.3% in March, 3.8% in April, and 4.2% in May. It has been accelerating for several months.
Higher rates make future earnings worth less today. The Fed has less room to cut rates. Input costs are rising and households have less money to spend.
For now that is no reason to panic but it will be important to monitor going forward.
As mentioned a few days ago there is no reason to believe that this bull market is over.
The market simply reminded everyone this week that stocks do not go straight up forever. And honestly that reset was needed. Pullbacks are difficult to manage in real time, but they are often where the best opportunities lie. Staying involved and managing volatility when things start to feel uncomfortable is one of the hardest things to do. That is the process I tried to lay out in the last Market Update here and why preparation is important. Pretty much all of the names in focus have moved sharply higher.
So, the bigger picture still looks constructive. Hence, I’m still focused on tech because that remains where the strongest earnings growth, margin expansion, and leadership are showing up. Until that changes, I do not see a reason to overcomplicate it.
One important to event to watch this week is Keven Warsh’s first FOMC meeting as Fed Chair. So, that will be important and set the tone for the next few months, especially around inflation, rates, and forward guidance.
The market will be watching the decision, but even more importantly, it will be watching the language. Does the Fed sound more hawkish? Does it leave the door open for cuts? Does it push back against inflation expectations?
Read More
Lin
Market Update: In Focus
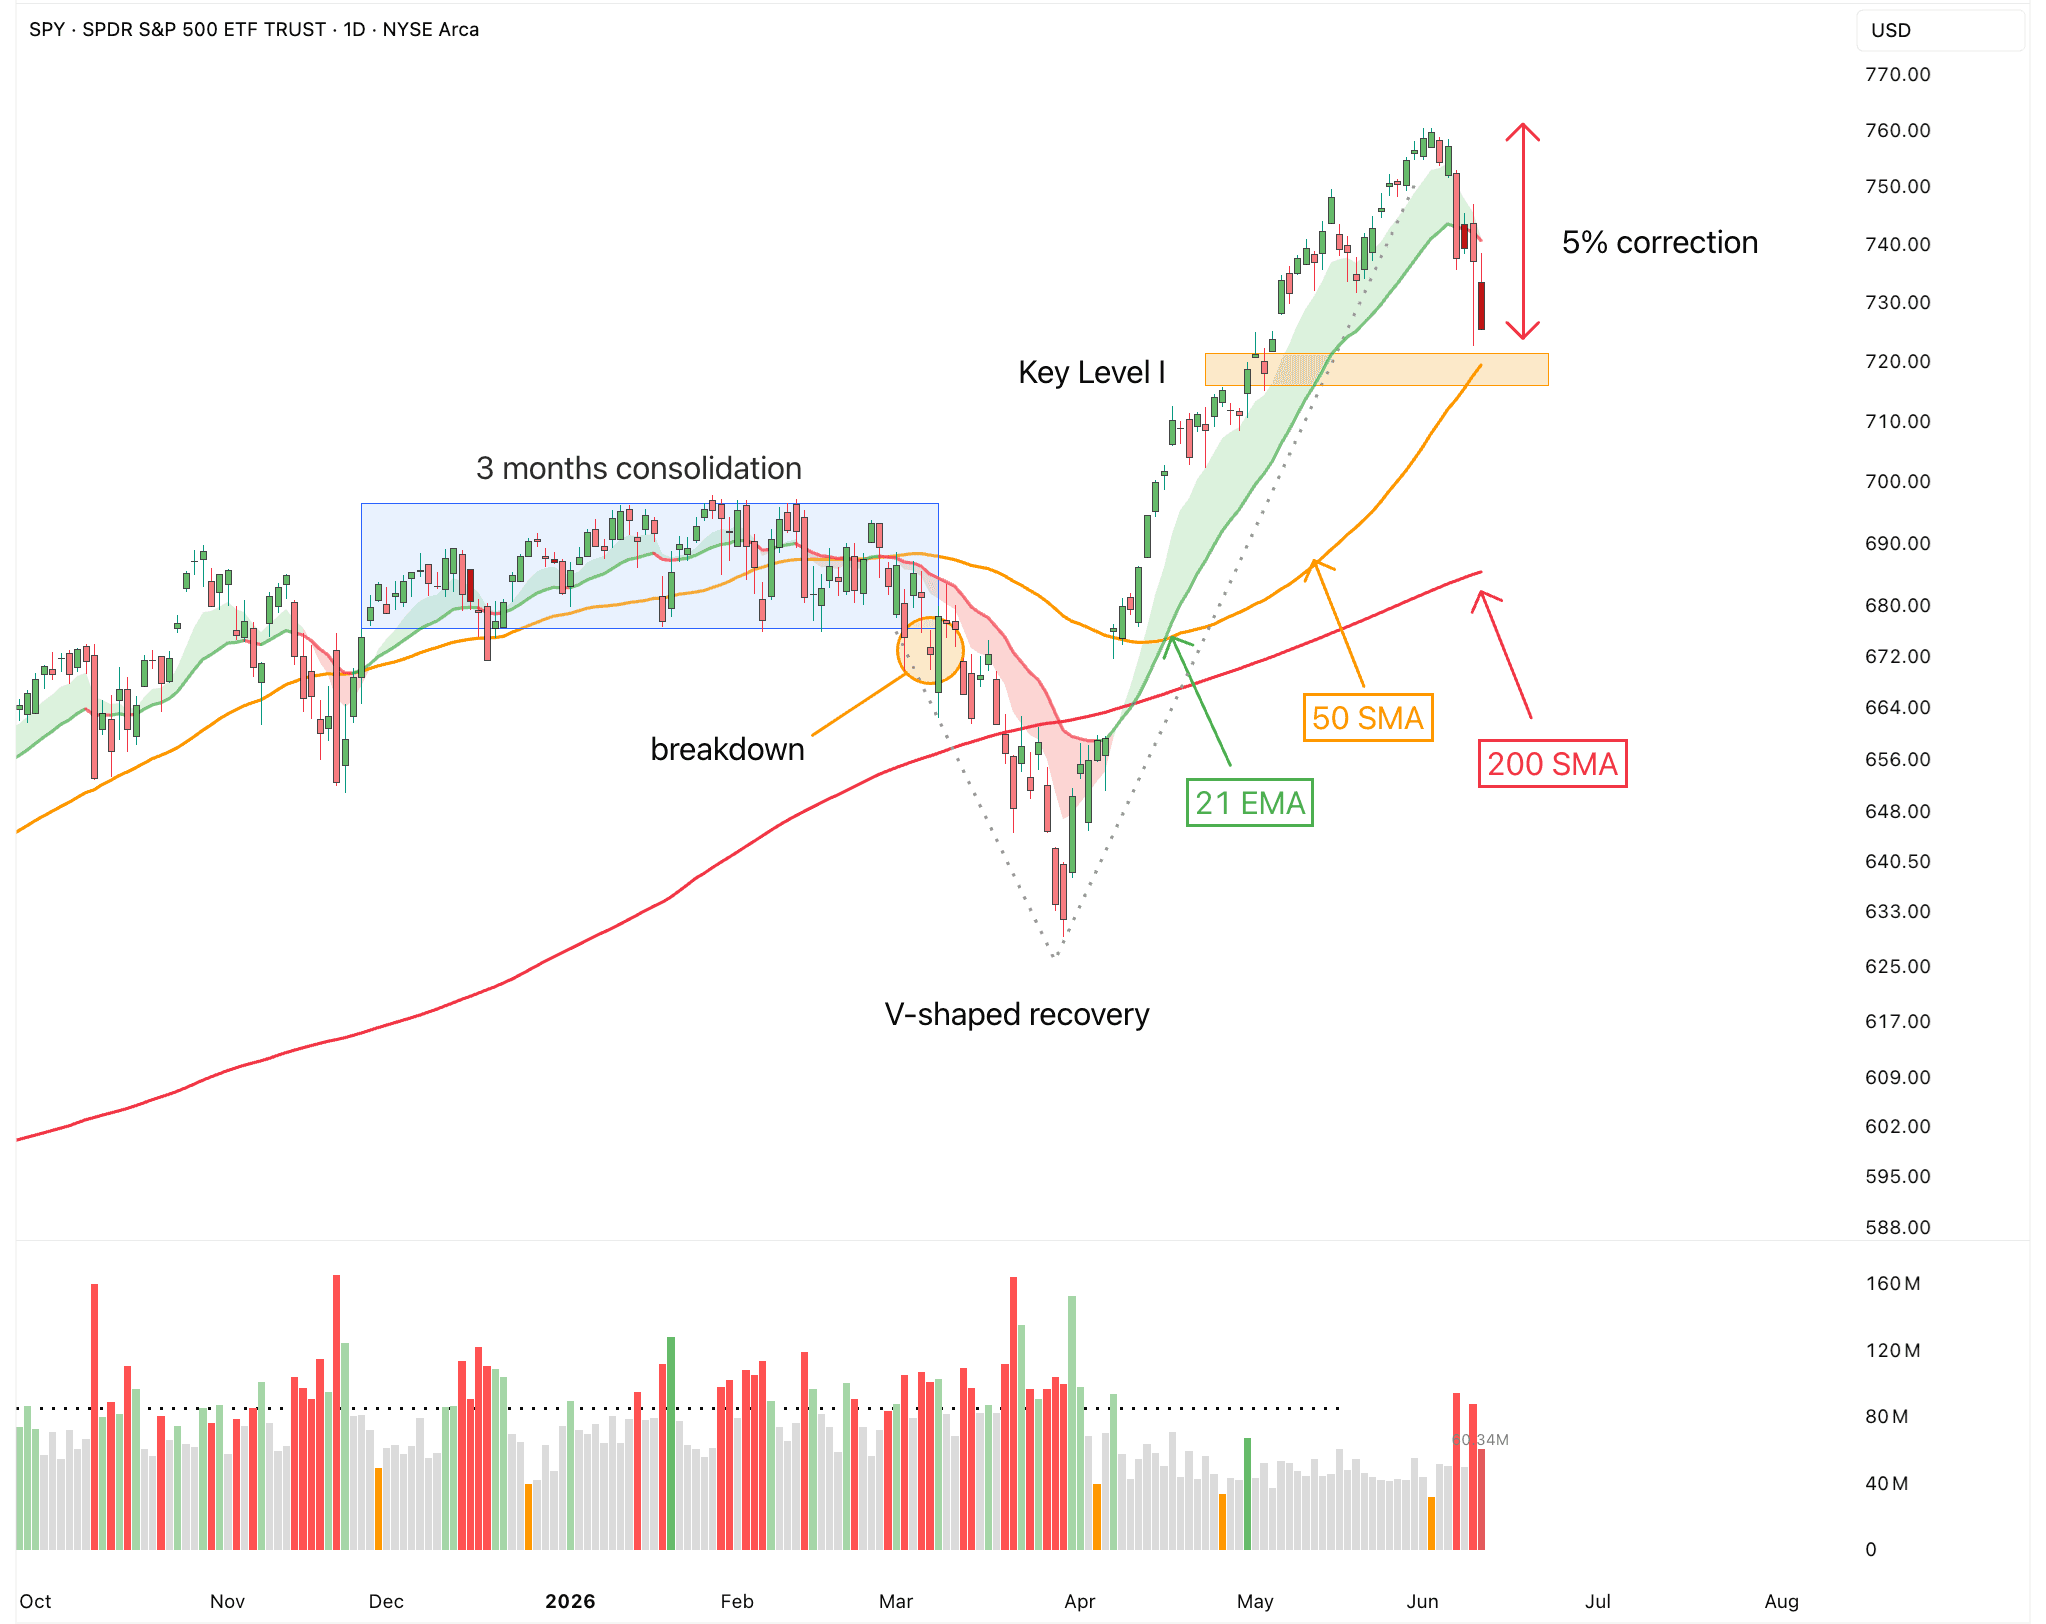
The general market has now gone through a 5% correction in less than two weeks.
We haven’t seen a move like this since the March lows, so of course it feels uncomfortable. But so far, there is still no reason to believe this is anything more than a normal correction.
We’ve just been spoiled over the last few months. The market pretty much went straight up for weeks, and every small dip got bought quickly. After a period like that, even a normal pullback suddenly feels like something is wrong.
But these kinds of moves are normal.
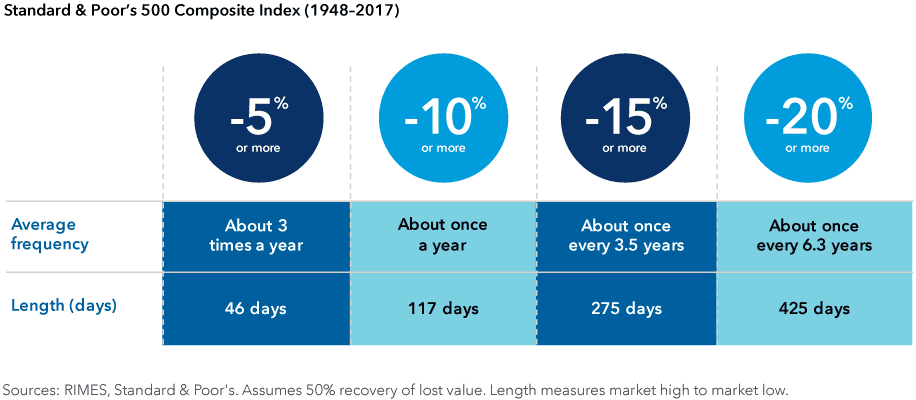
In a typical year, you should expect a few 5% pullbacks and at least 1 larger correction of around 10%. Even in bull markets, stocks need time to cool down. They cannot move higher every week forever.
We’re now about 5% off the highs and at a key level above the 50d SMA. That would be important to hold, at least short term. So, this could be an interesting spot for the market to bounce from.
Of course, there is also the possibility that we go even lower and maybe even revisit the 200d SMA, which would be a 10% correction. That’s important to keep in mind to maintain mental flexibility. But this is the less likely scenario.
One of the most important things to do during a pullback is to build a focus list or watchlist.
The goal is to prepare. A pullback gives you a second chance to buy leading stocks you might have missed initially. It also helps you identify the next set of potential leaders. They fall less, hold key moving averages, recover faster, and show relative strength while the broader market is under pressure.
This is incredibly valuable because you already know which names you want to focus on, where they become actionable, and where your risk is defined.
Here’s how that would look in practice.
Start with stocks that already had a strong trend before the pullback. Then check which ones are still above important moving averages, which ones are holding prior breakout areas, and which ones are refusing to make new lows while the index is falling. Those stocks are showing relative strength. Relative strength is important because it shows institutional demand. If everything is selling off, funds have to clearly set their buy orders.
Then narrow the list. Focus on the best 10 to 20 names that fit your portfolio and your strategy. Look for companies with strong earnings growth, rising estimates, improving margins, major catalysts, and clear demand from institutions. The best setups usually combine both sides: a strong business and a strong chart.
So, here are a few names that stand out right now. Many of these names have been discussed before or have been on the leaderboard for a while.
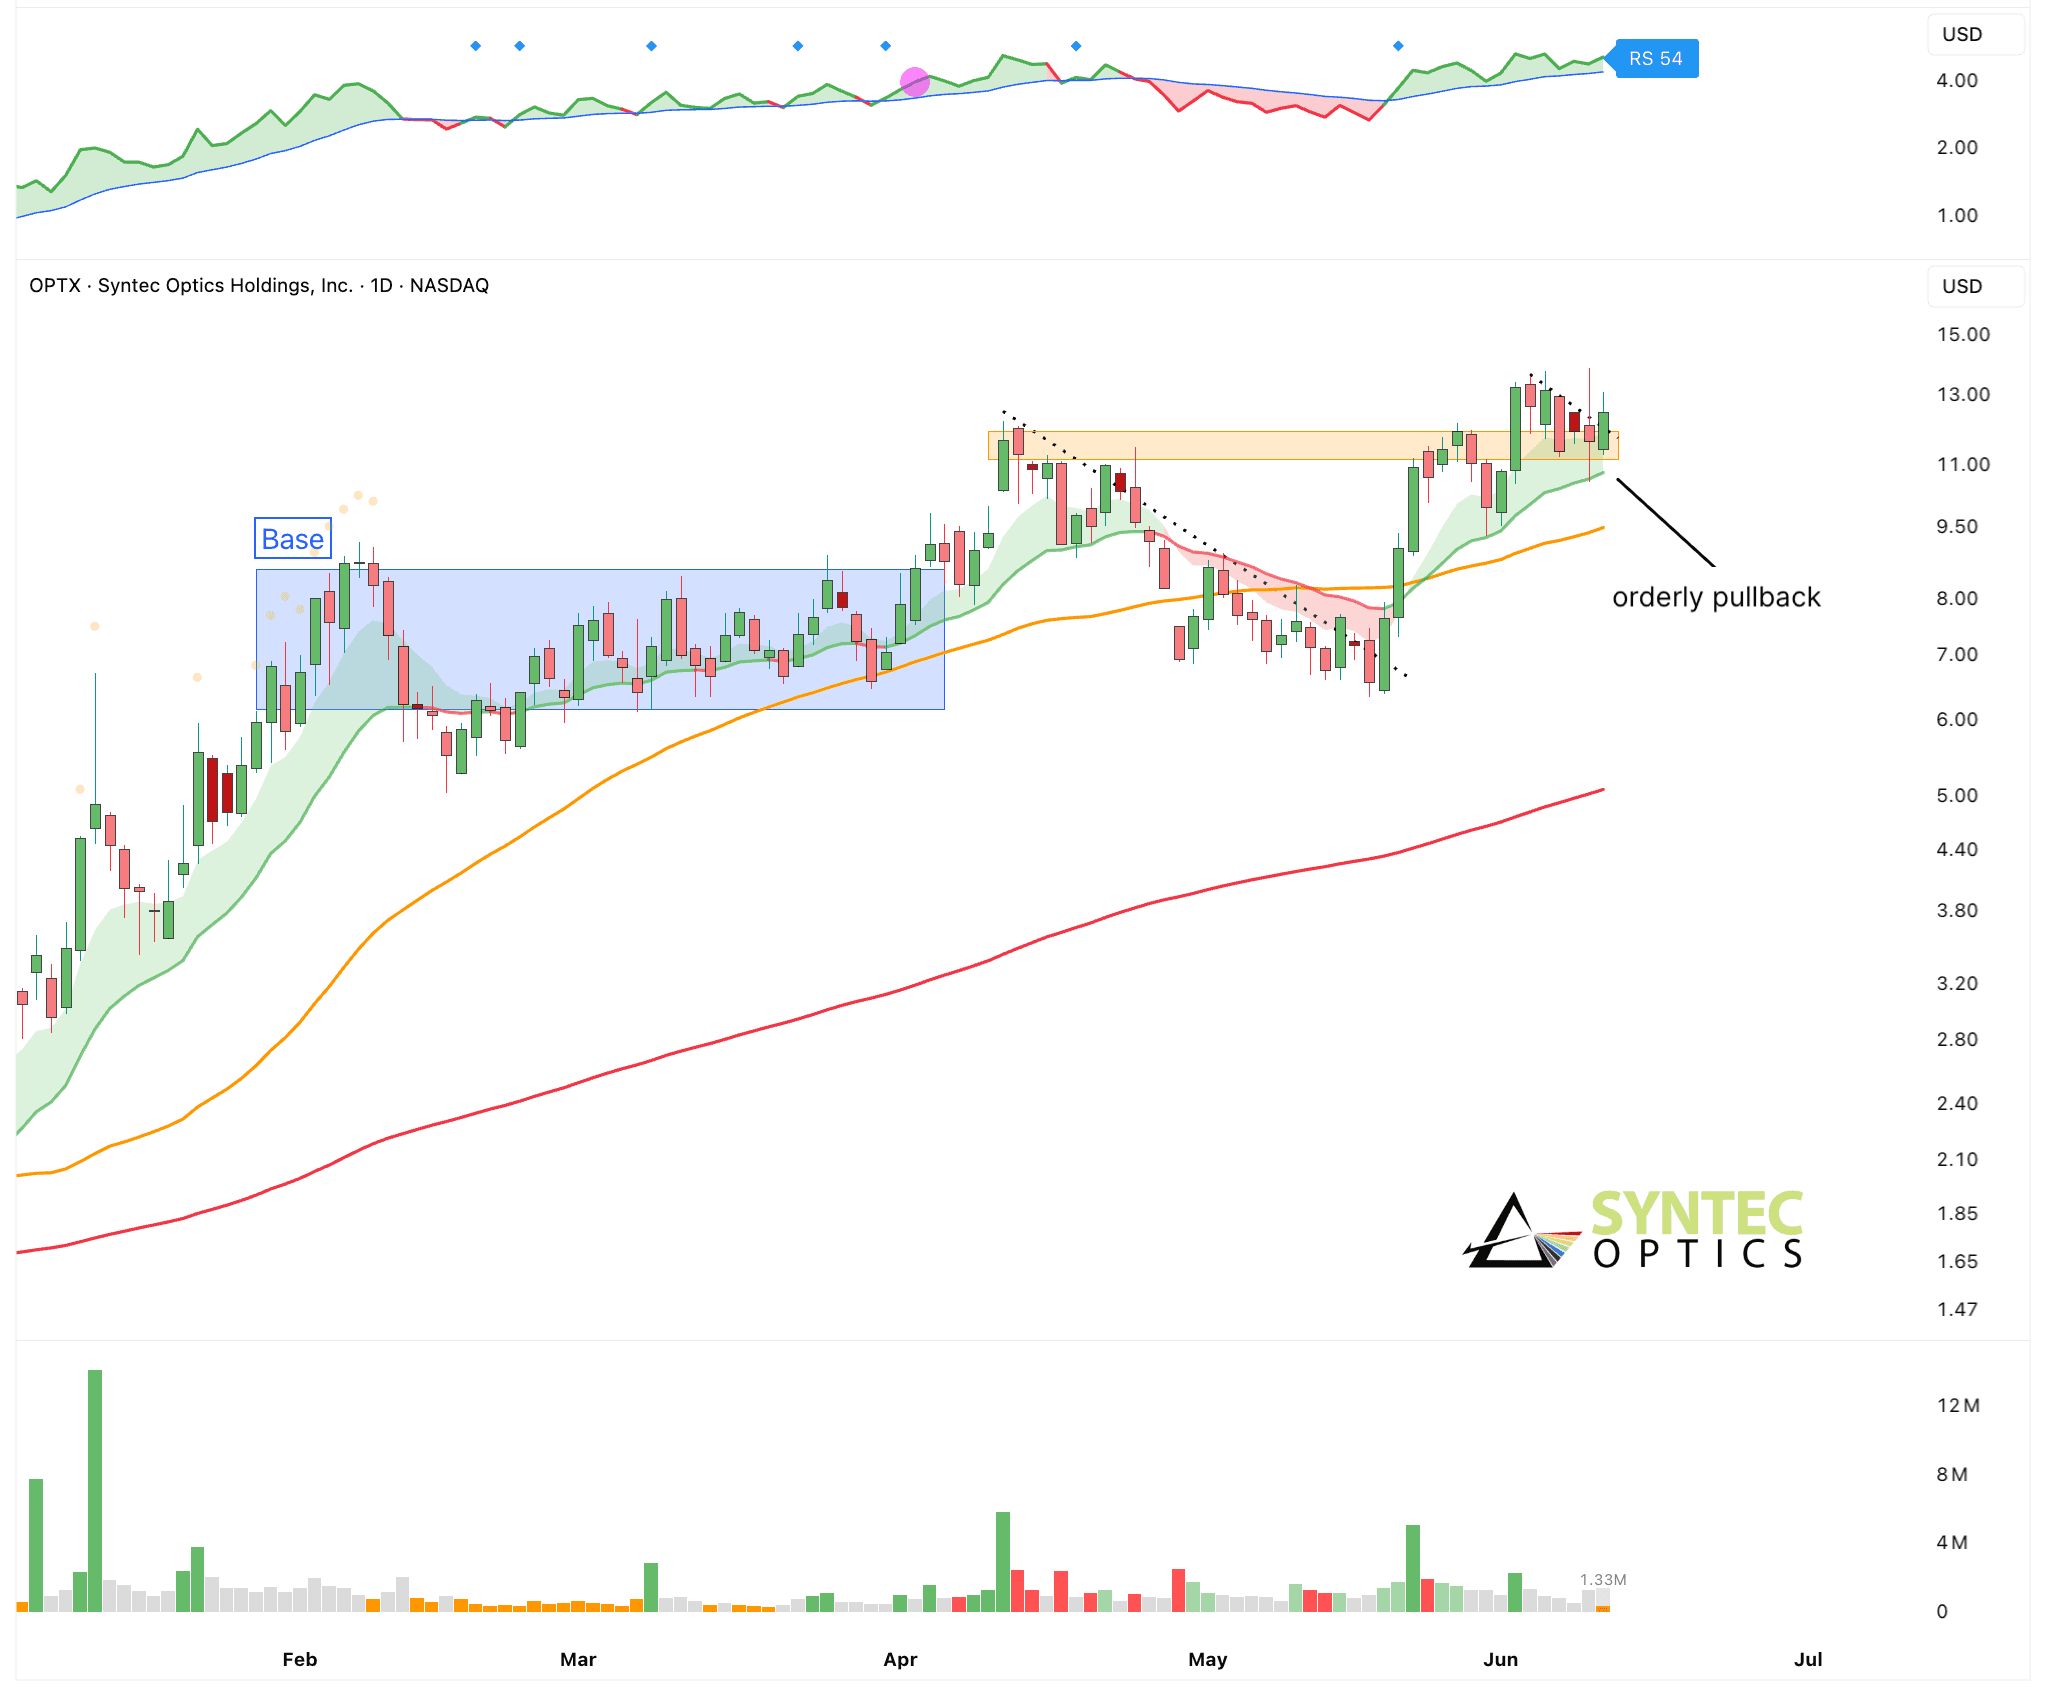
Syntec Optics $OPTX
Still holding this position. Although it is certainly a more volatile name, it continues to build higher highs and higher lows even while the market corrects.
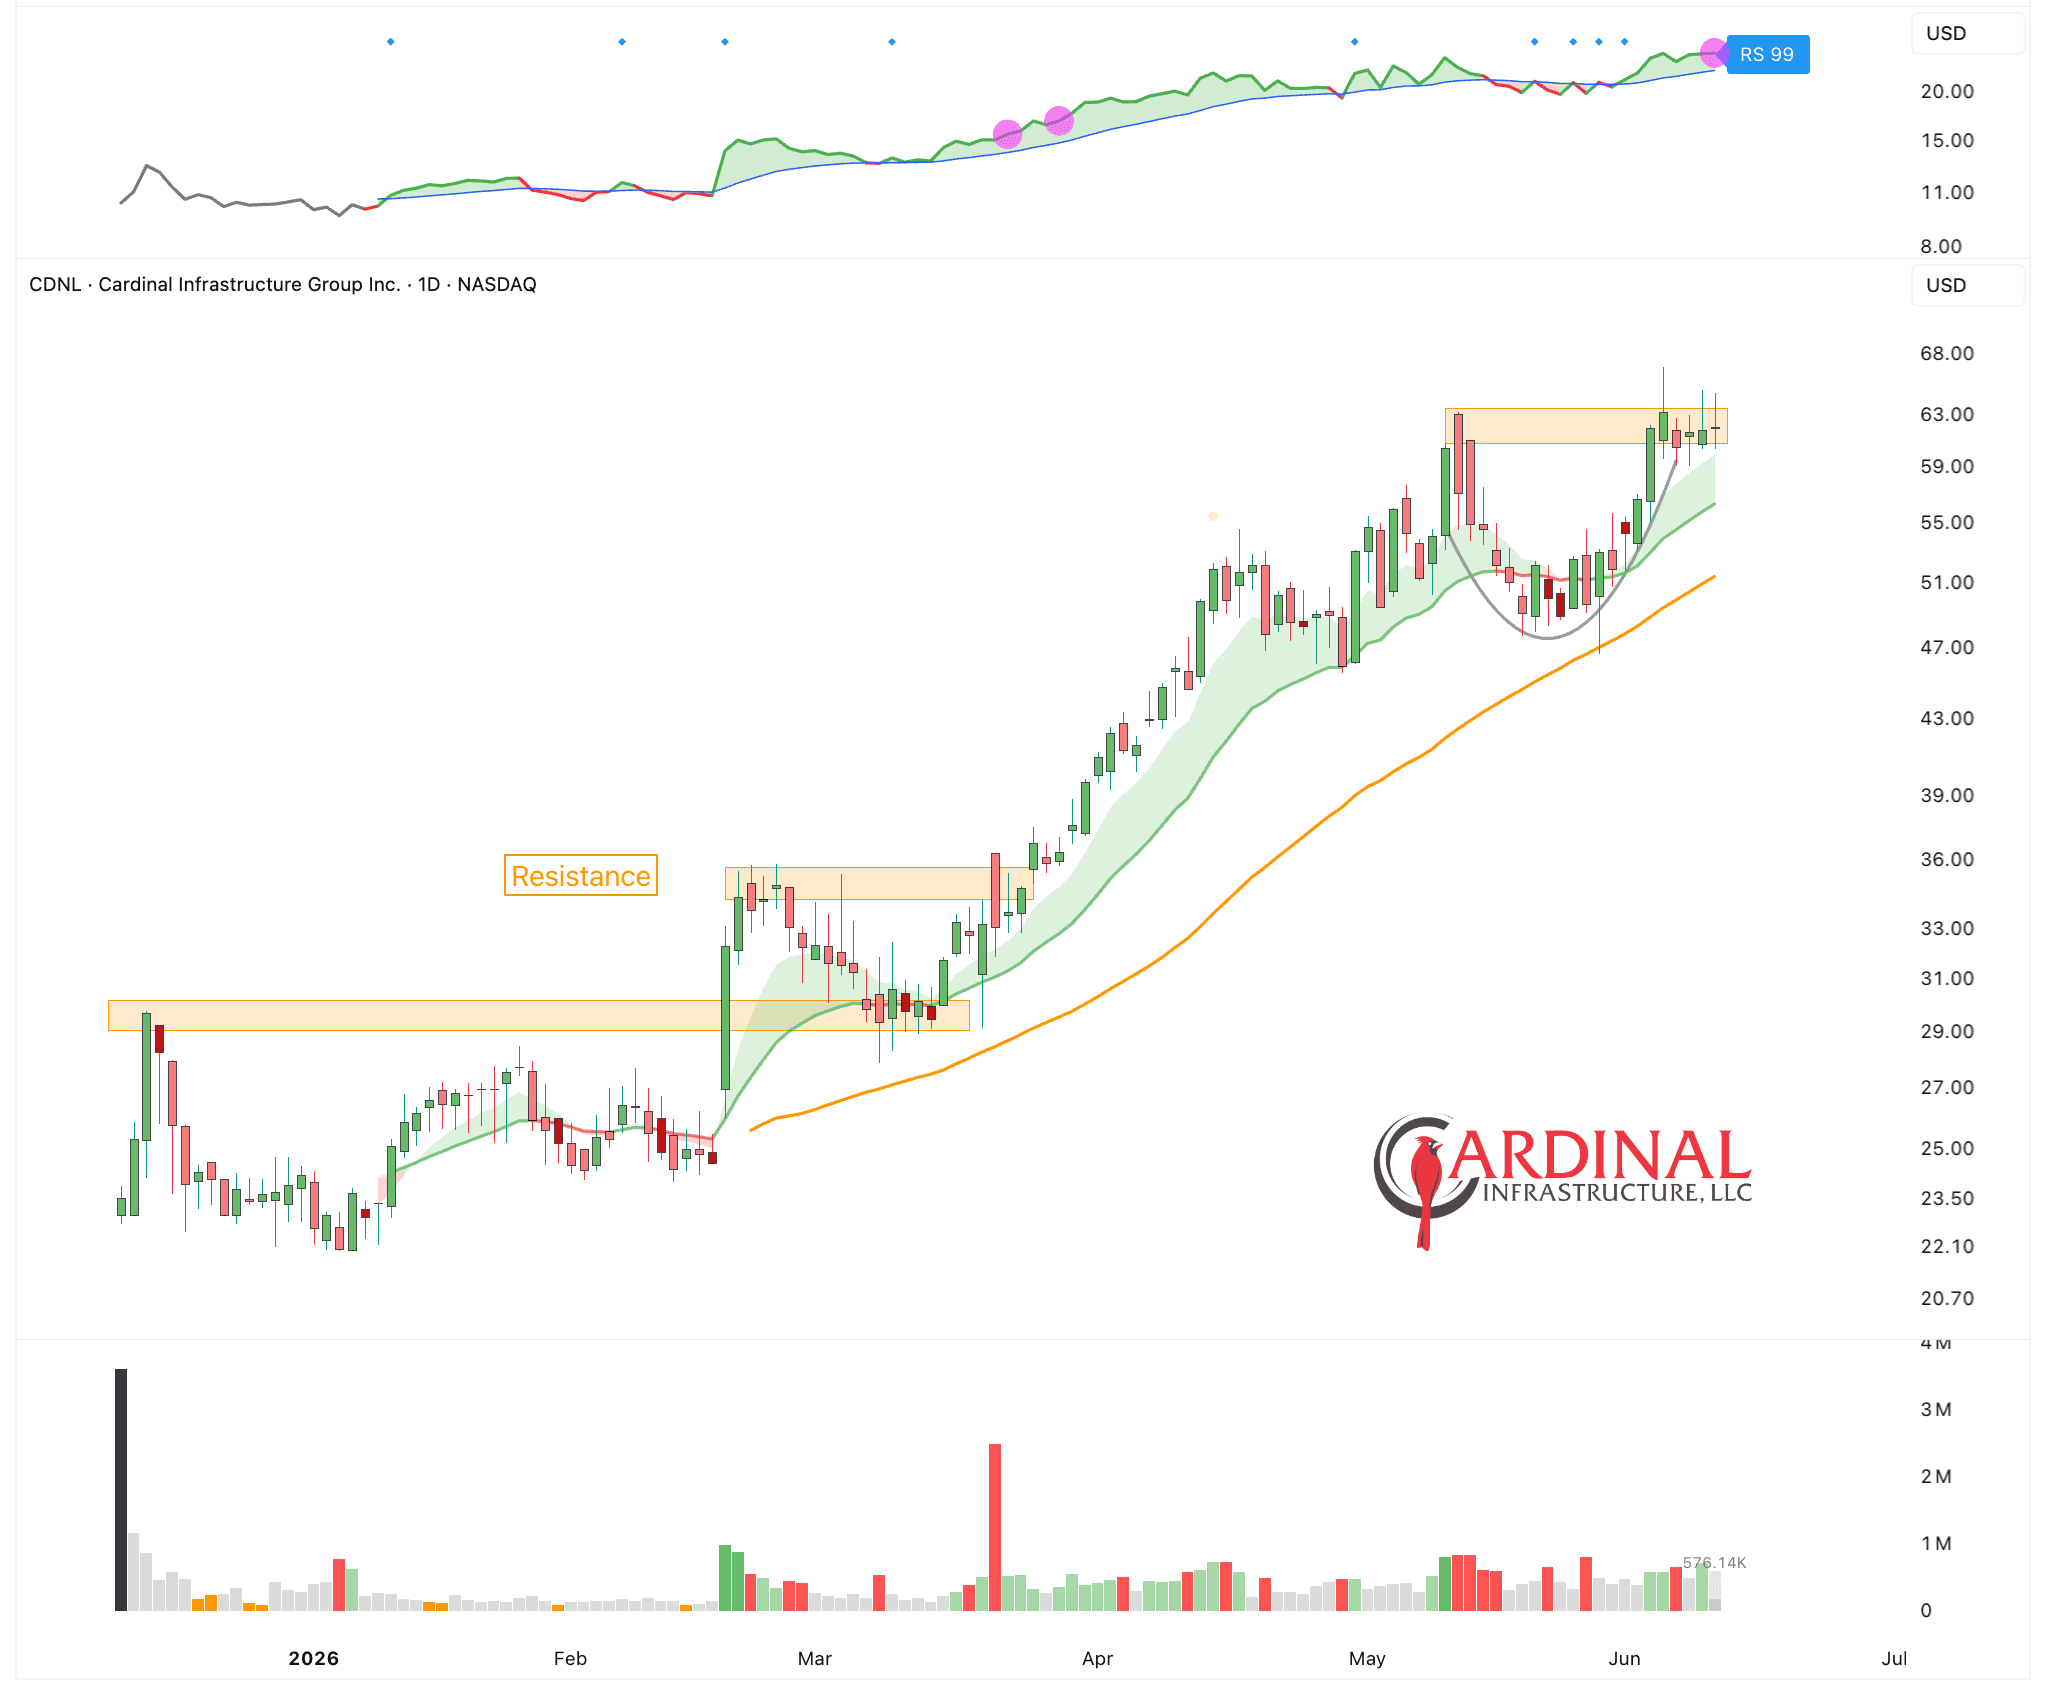
Cardinal Infrastructure $CDNL
This is also a good example of what to expect after a correction. First, it sold off. Then it based above the 50d SMA, and now it’s back at all-time highs while the market corrects.
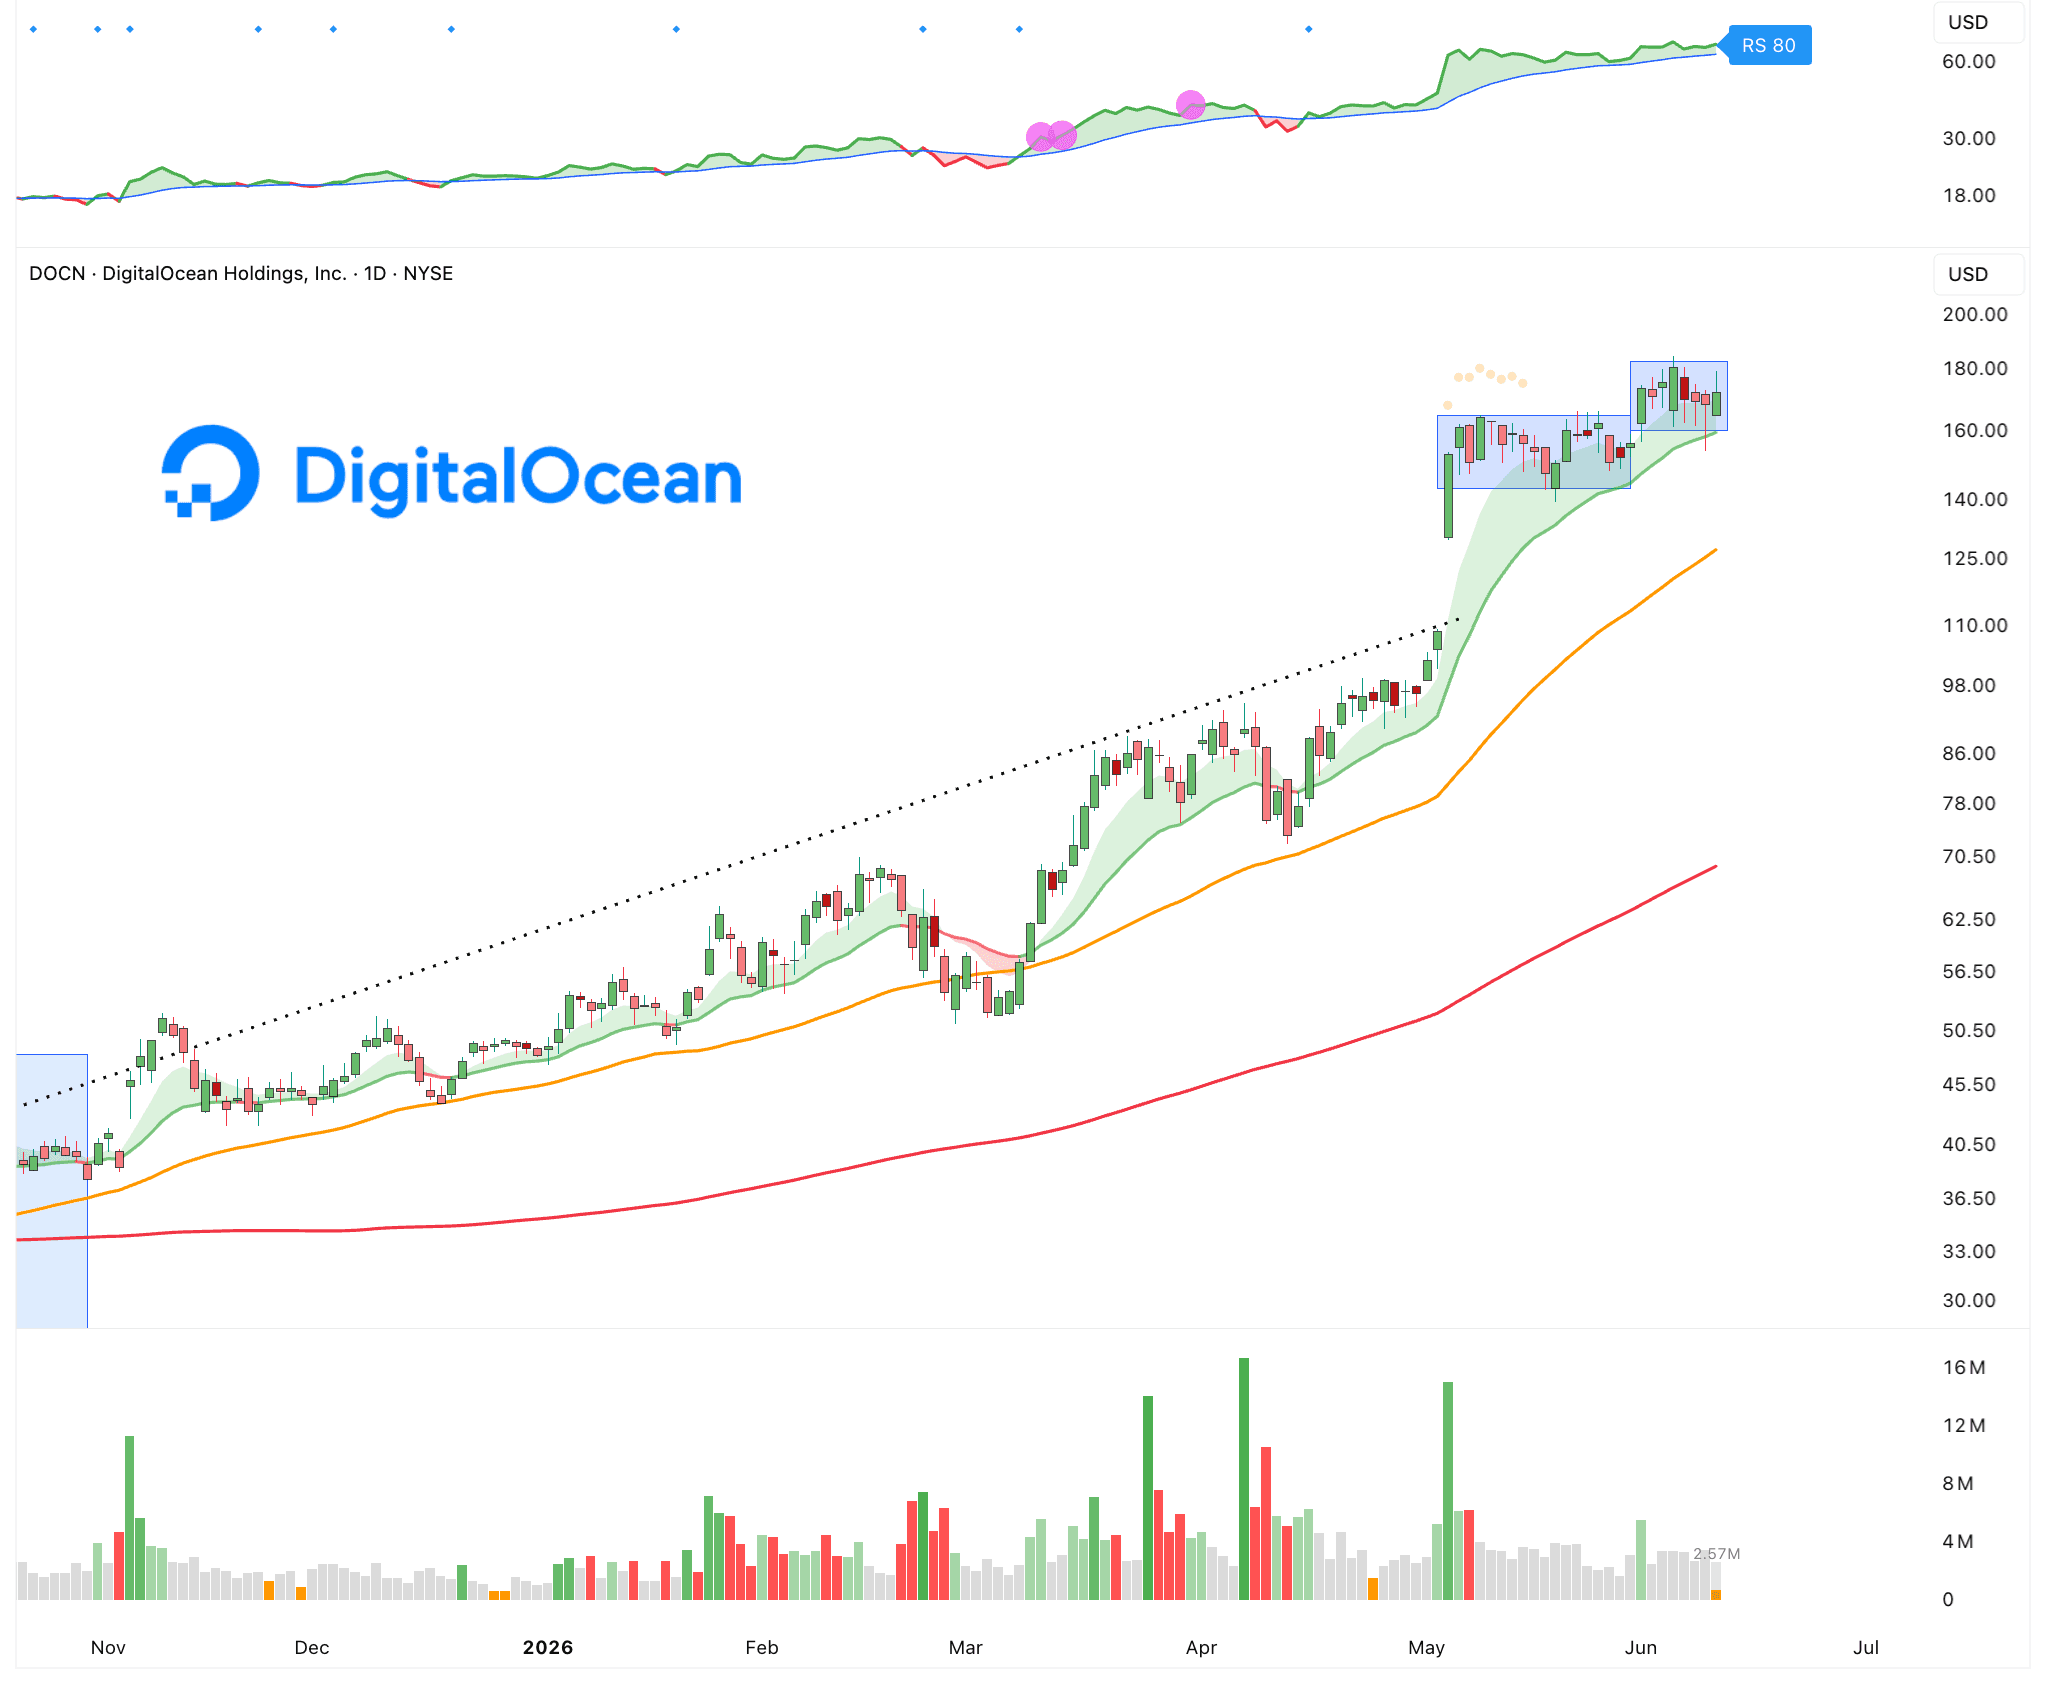
Digital Ocean $DOCN
This was my favorite name to watch for agentic AI software a few months ago. It continues to perform very well, and there is no one willing to sell even during this correction. This kind of price action is exactly what you want to see from a potential leader.
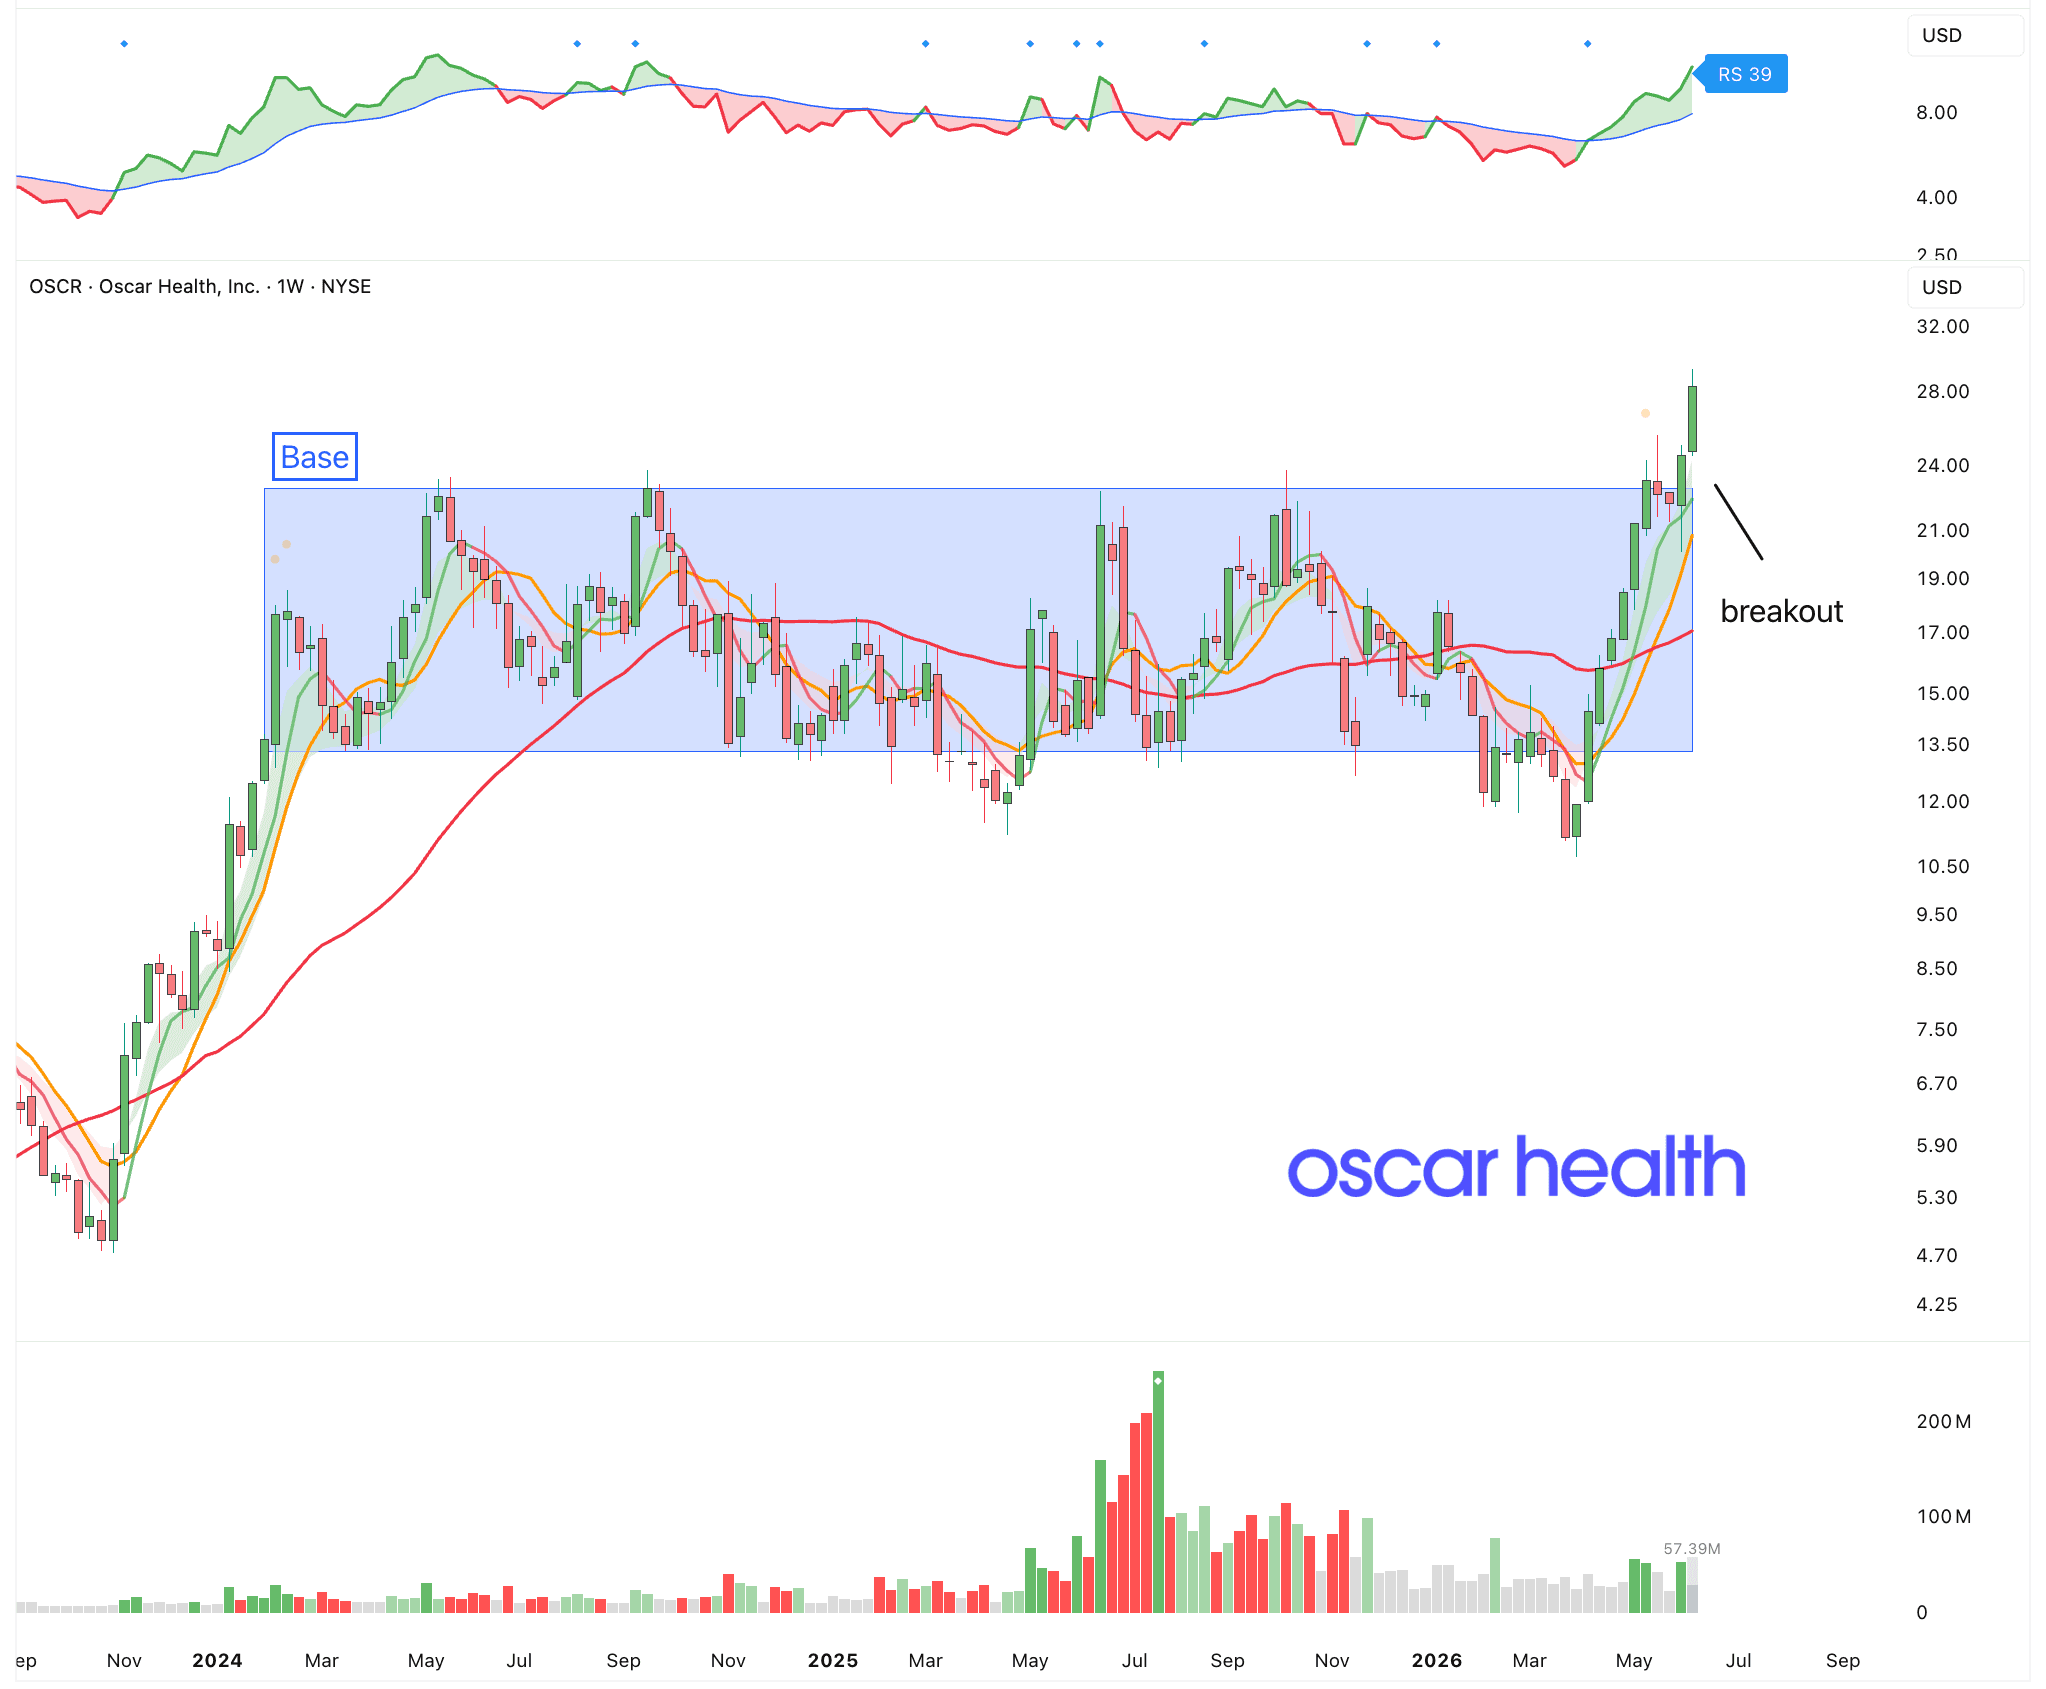
Oscar Health $OSCR
We’ve also seen a rotation from tech to consumer staples and more defensive names. One of the most interesting names right now is Oscar Health. It has been building a base for 2 years and just broke out. As they say, the higher the base, the bigger the space.
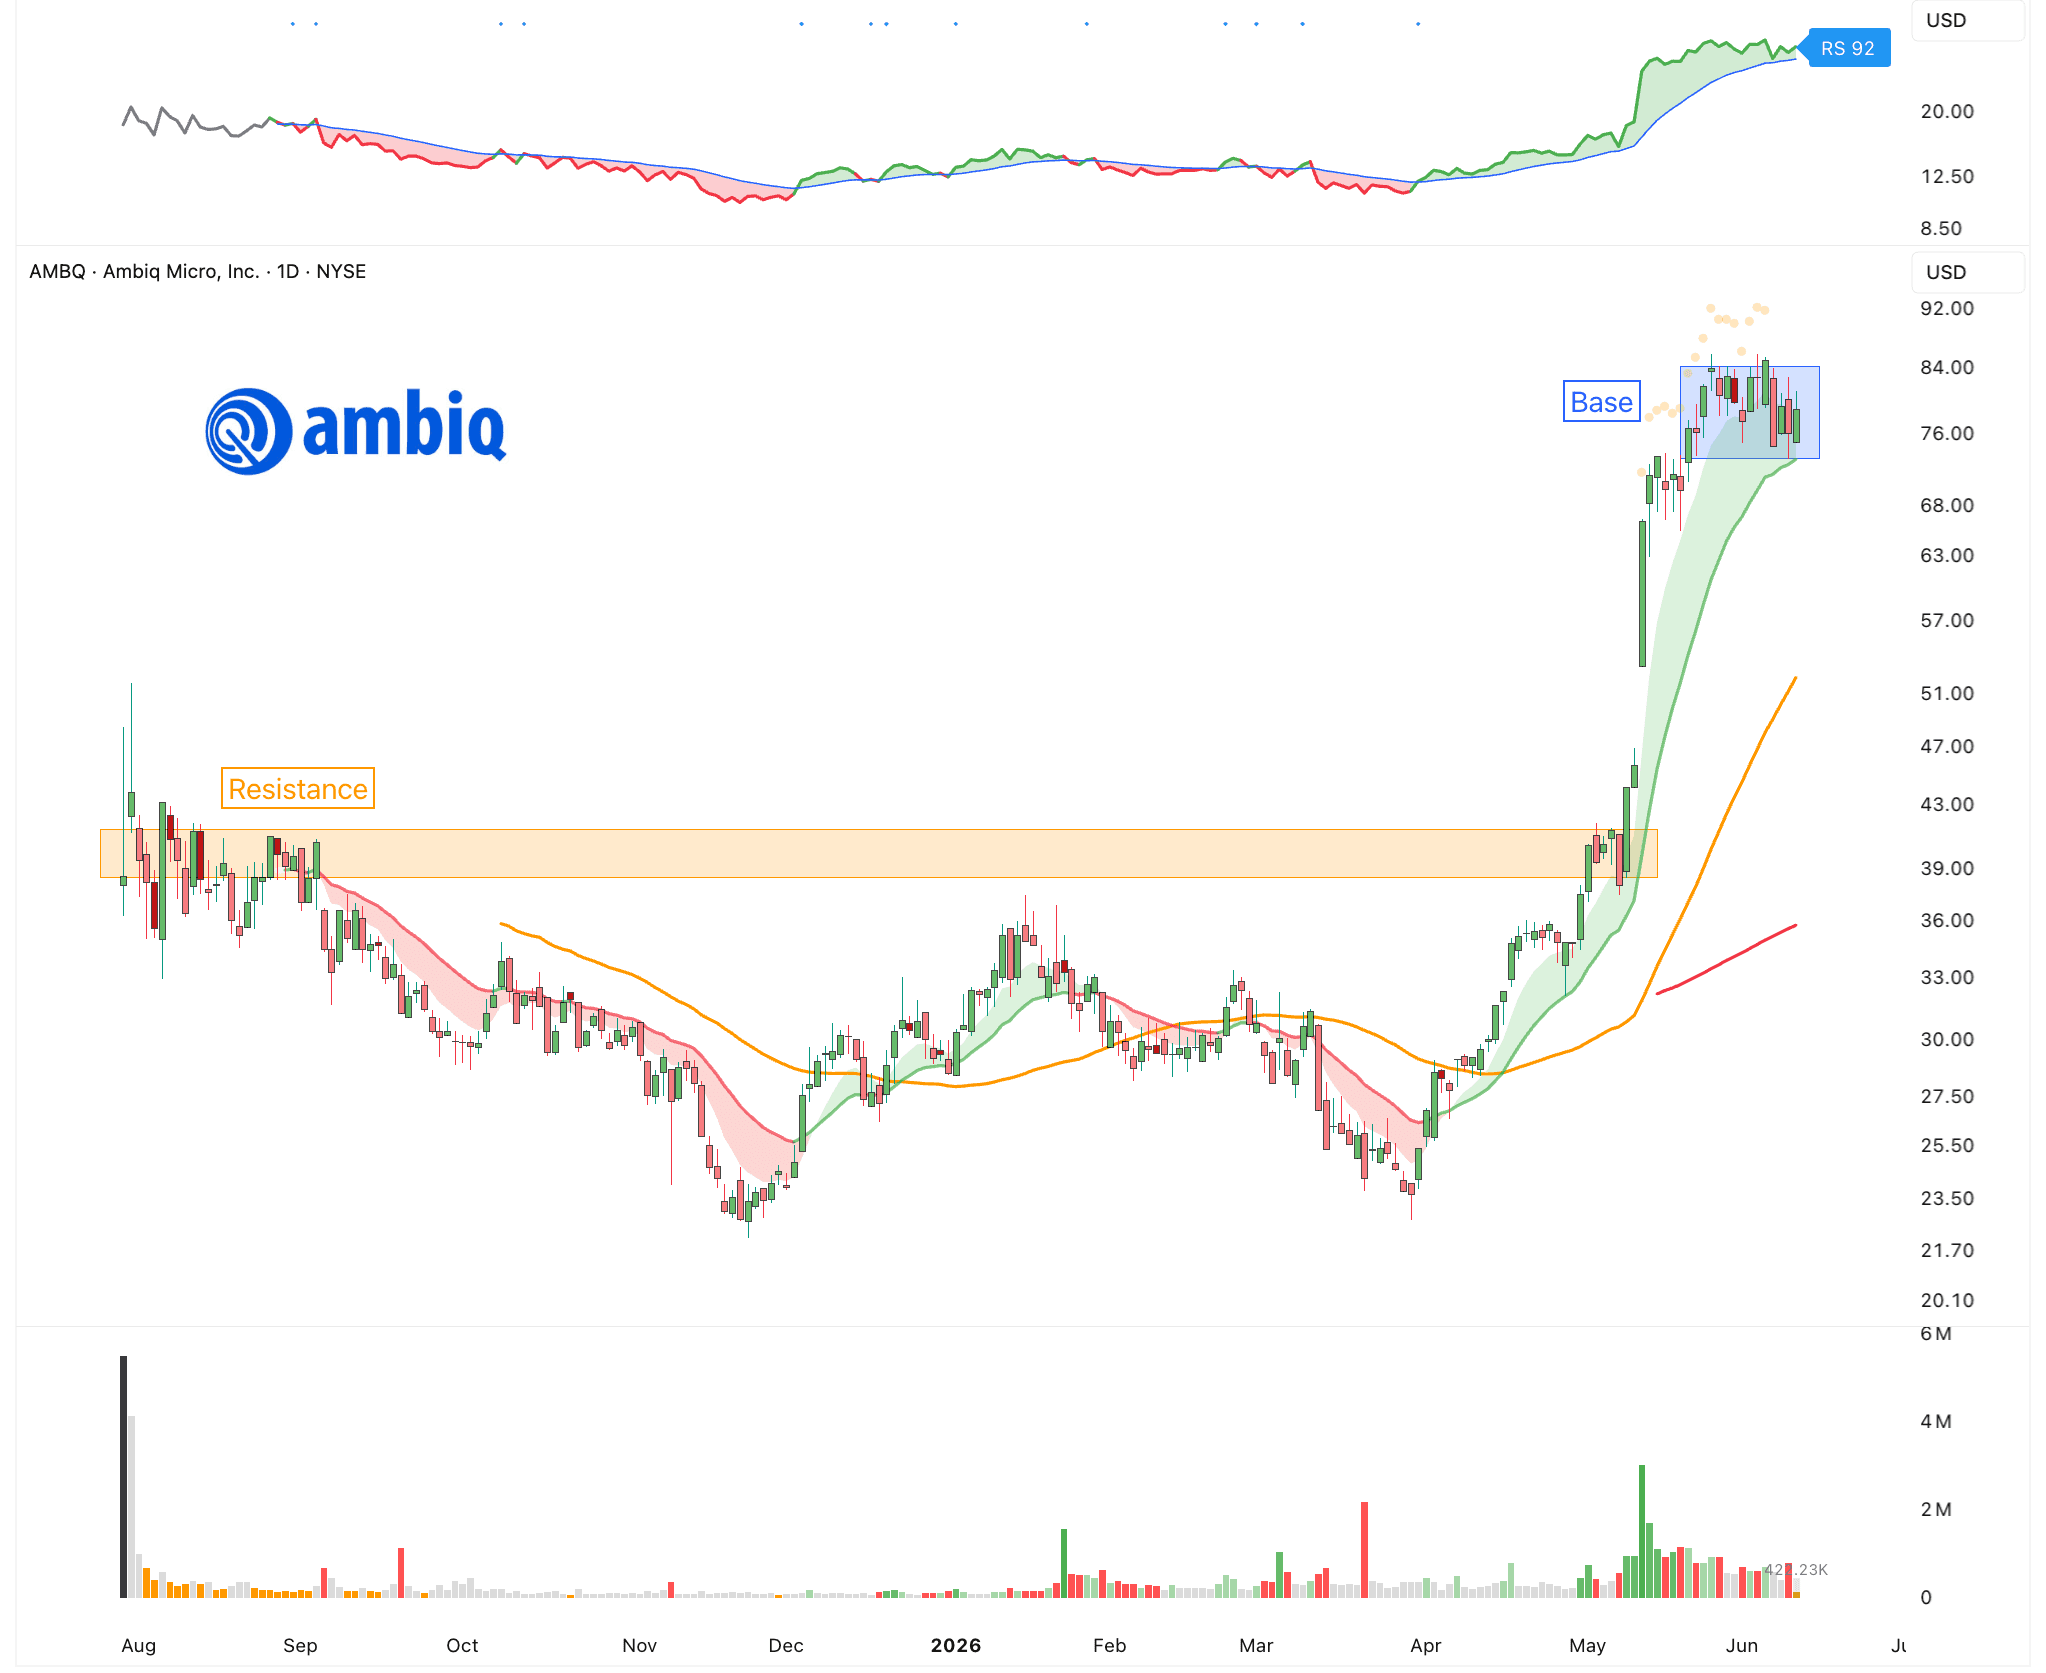
Ambiq Micro $AMBQ
Ambiq Micro is a recent chip IPO focused on ultra-low-power semiconductors for edge AI devices. It makes chips that allow small battery-powered devices to run more intelligence locally, without draining the battery too quickly. It broke out of its IPO base and has been consolidating nicely since then. This is also a good example of what to expect of new names that IPO.
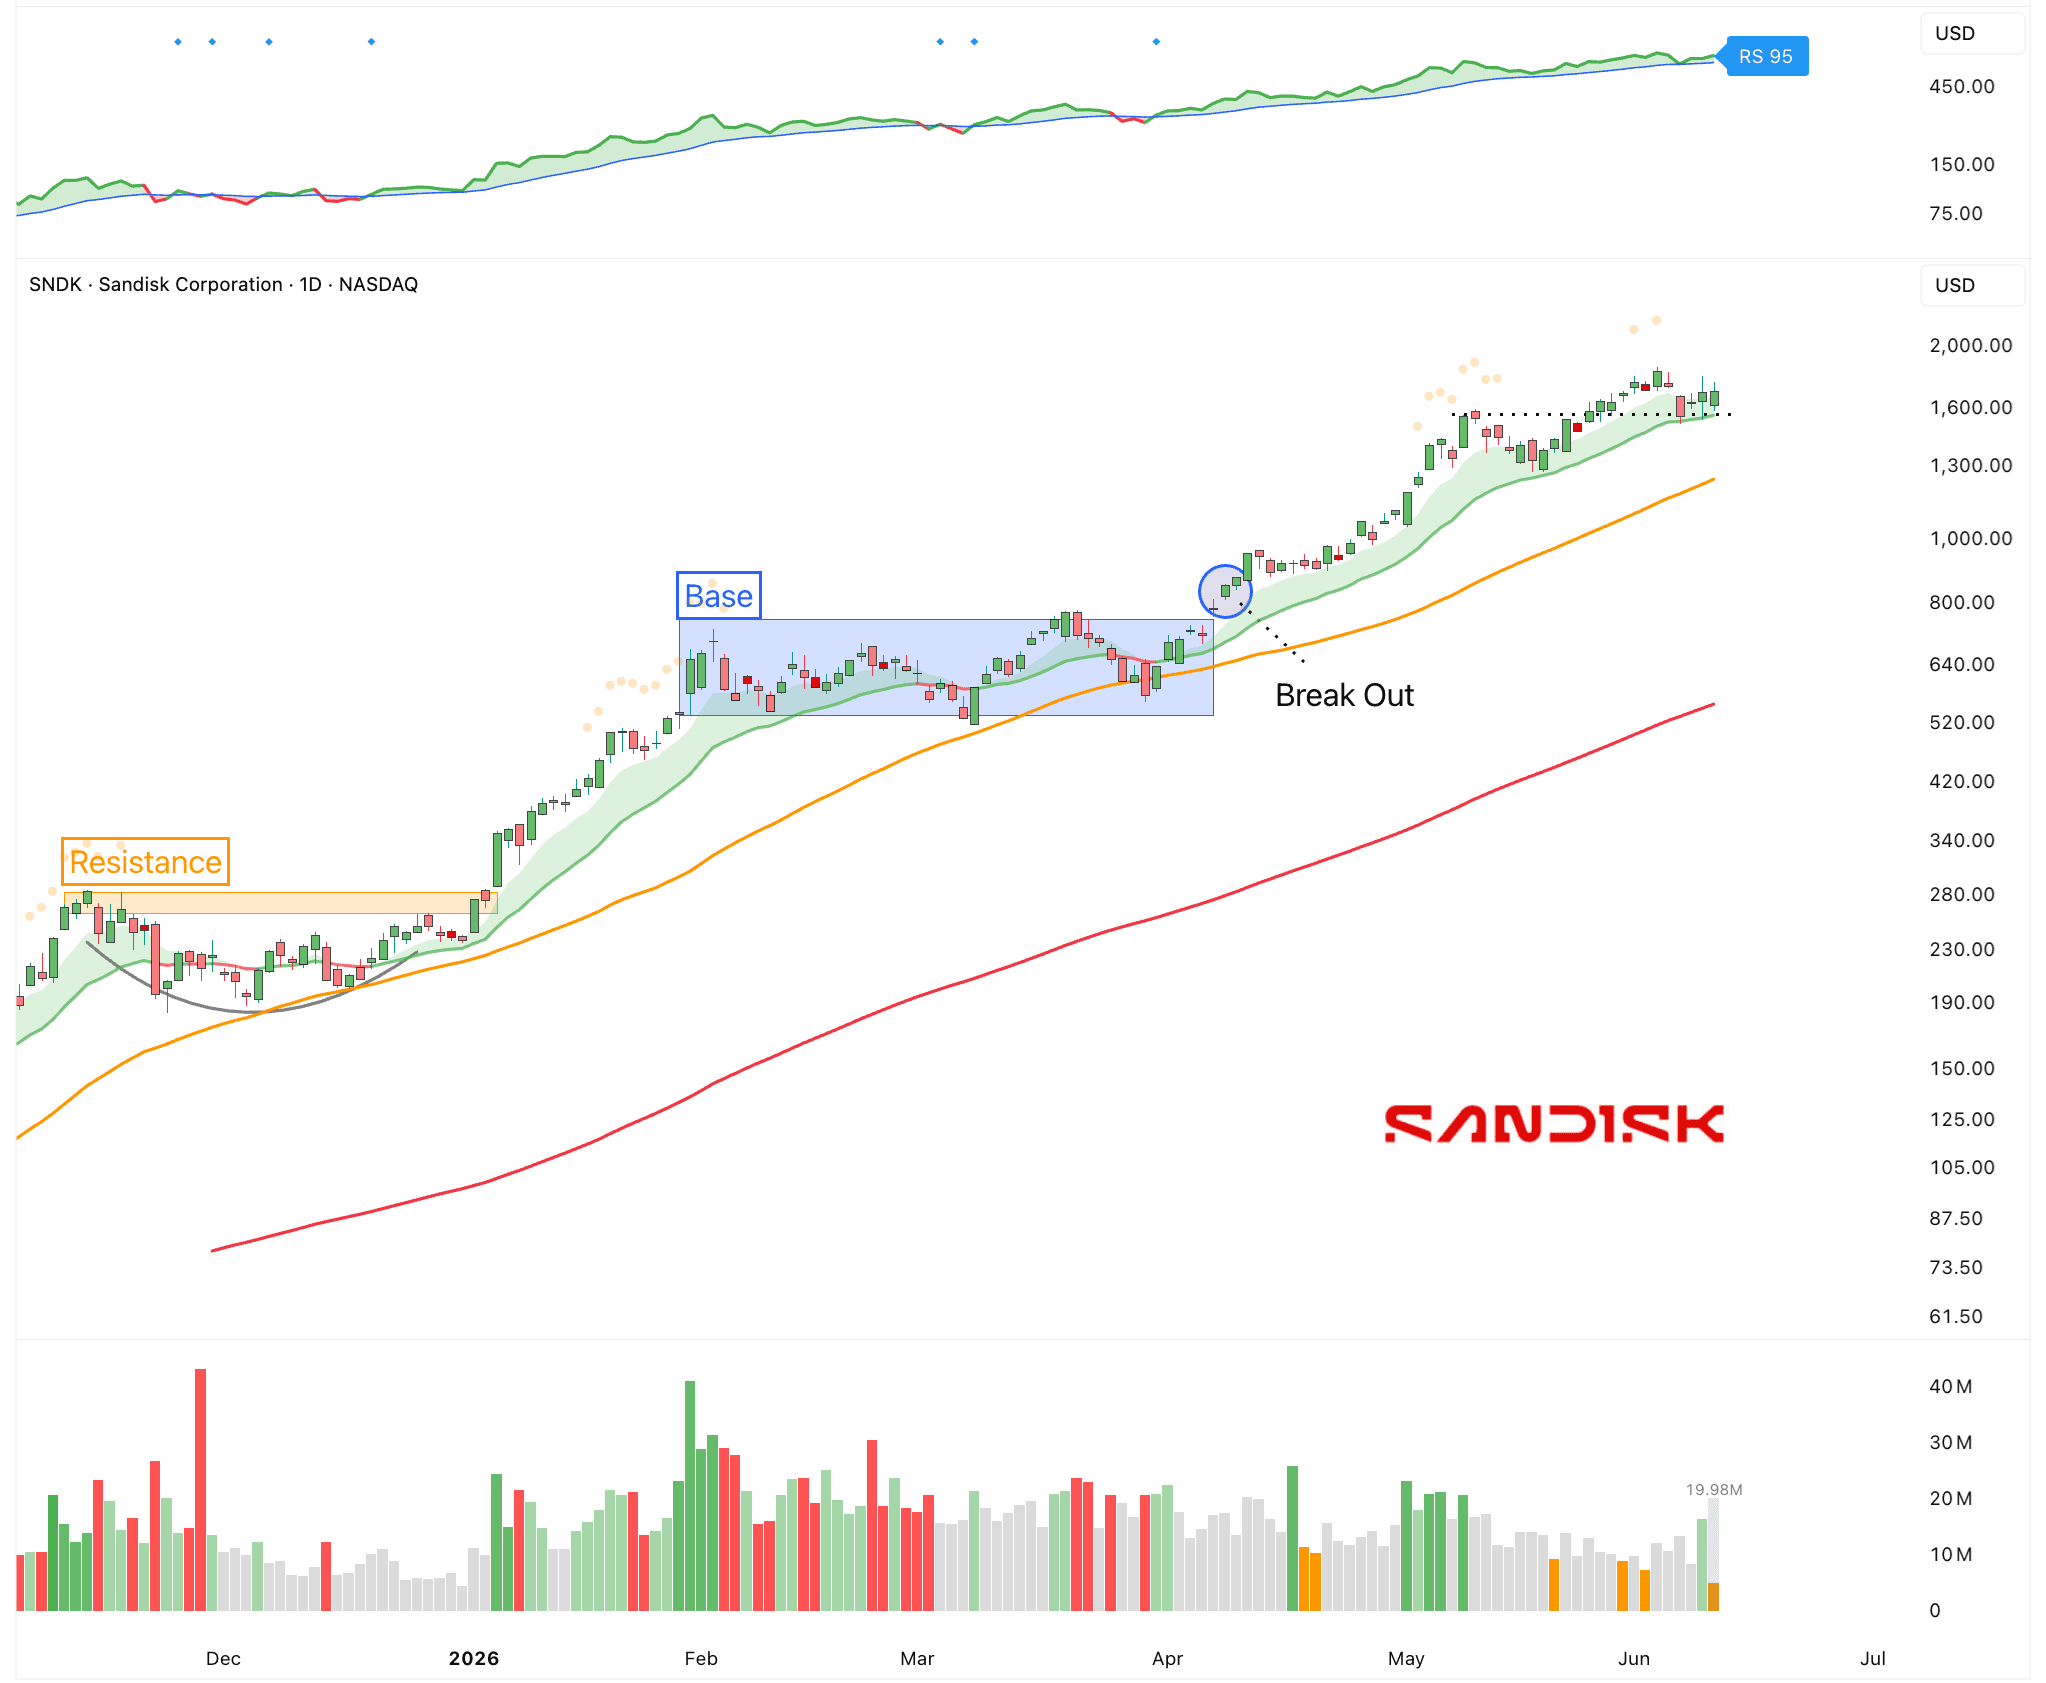
Sandisk $SNDK
This is the undisputed leader from both this year and last year, and it continues to power higher. Nobody is willing to sell.
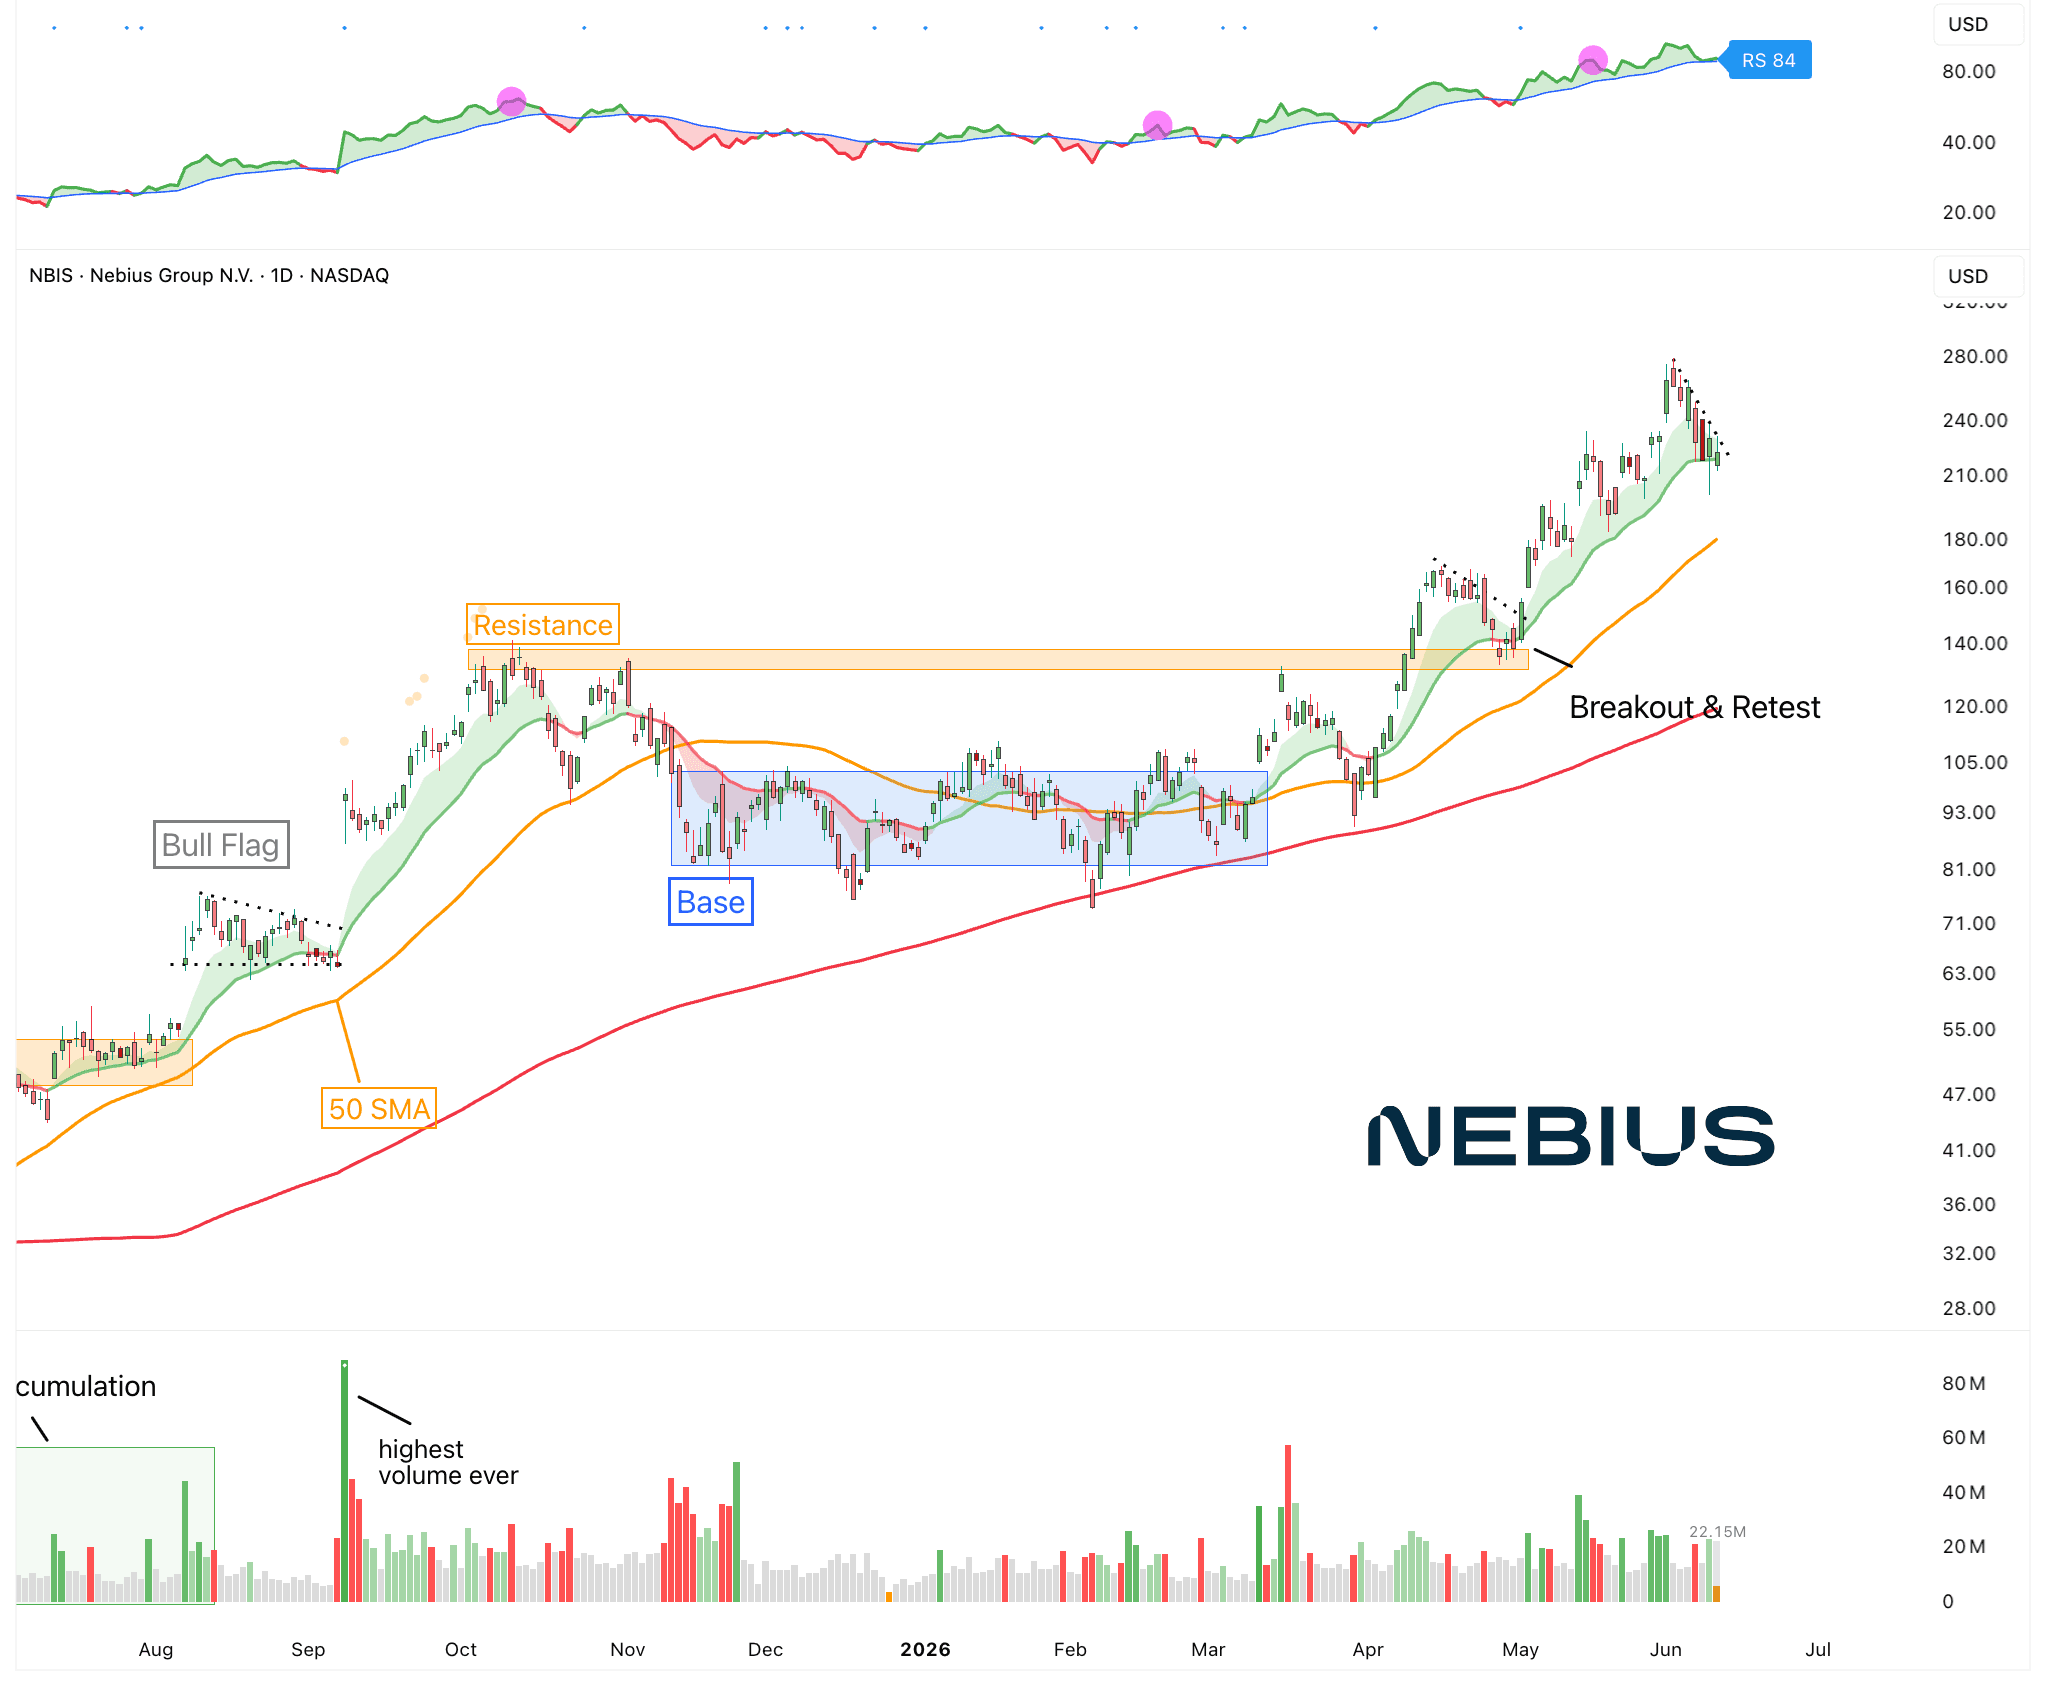
Nebius $NBIS
The leader in AI compute right now. A very order pullback so far. After such a strong run, some digestion is normal.
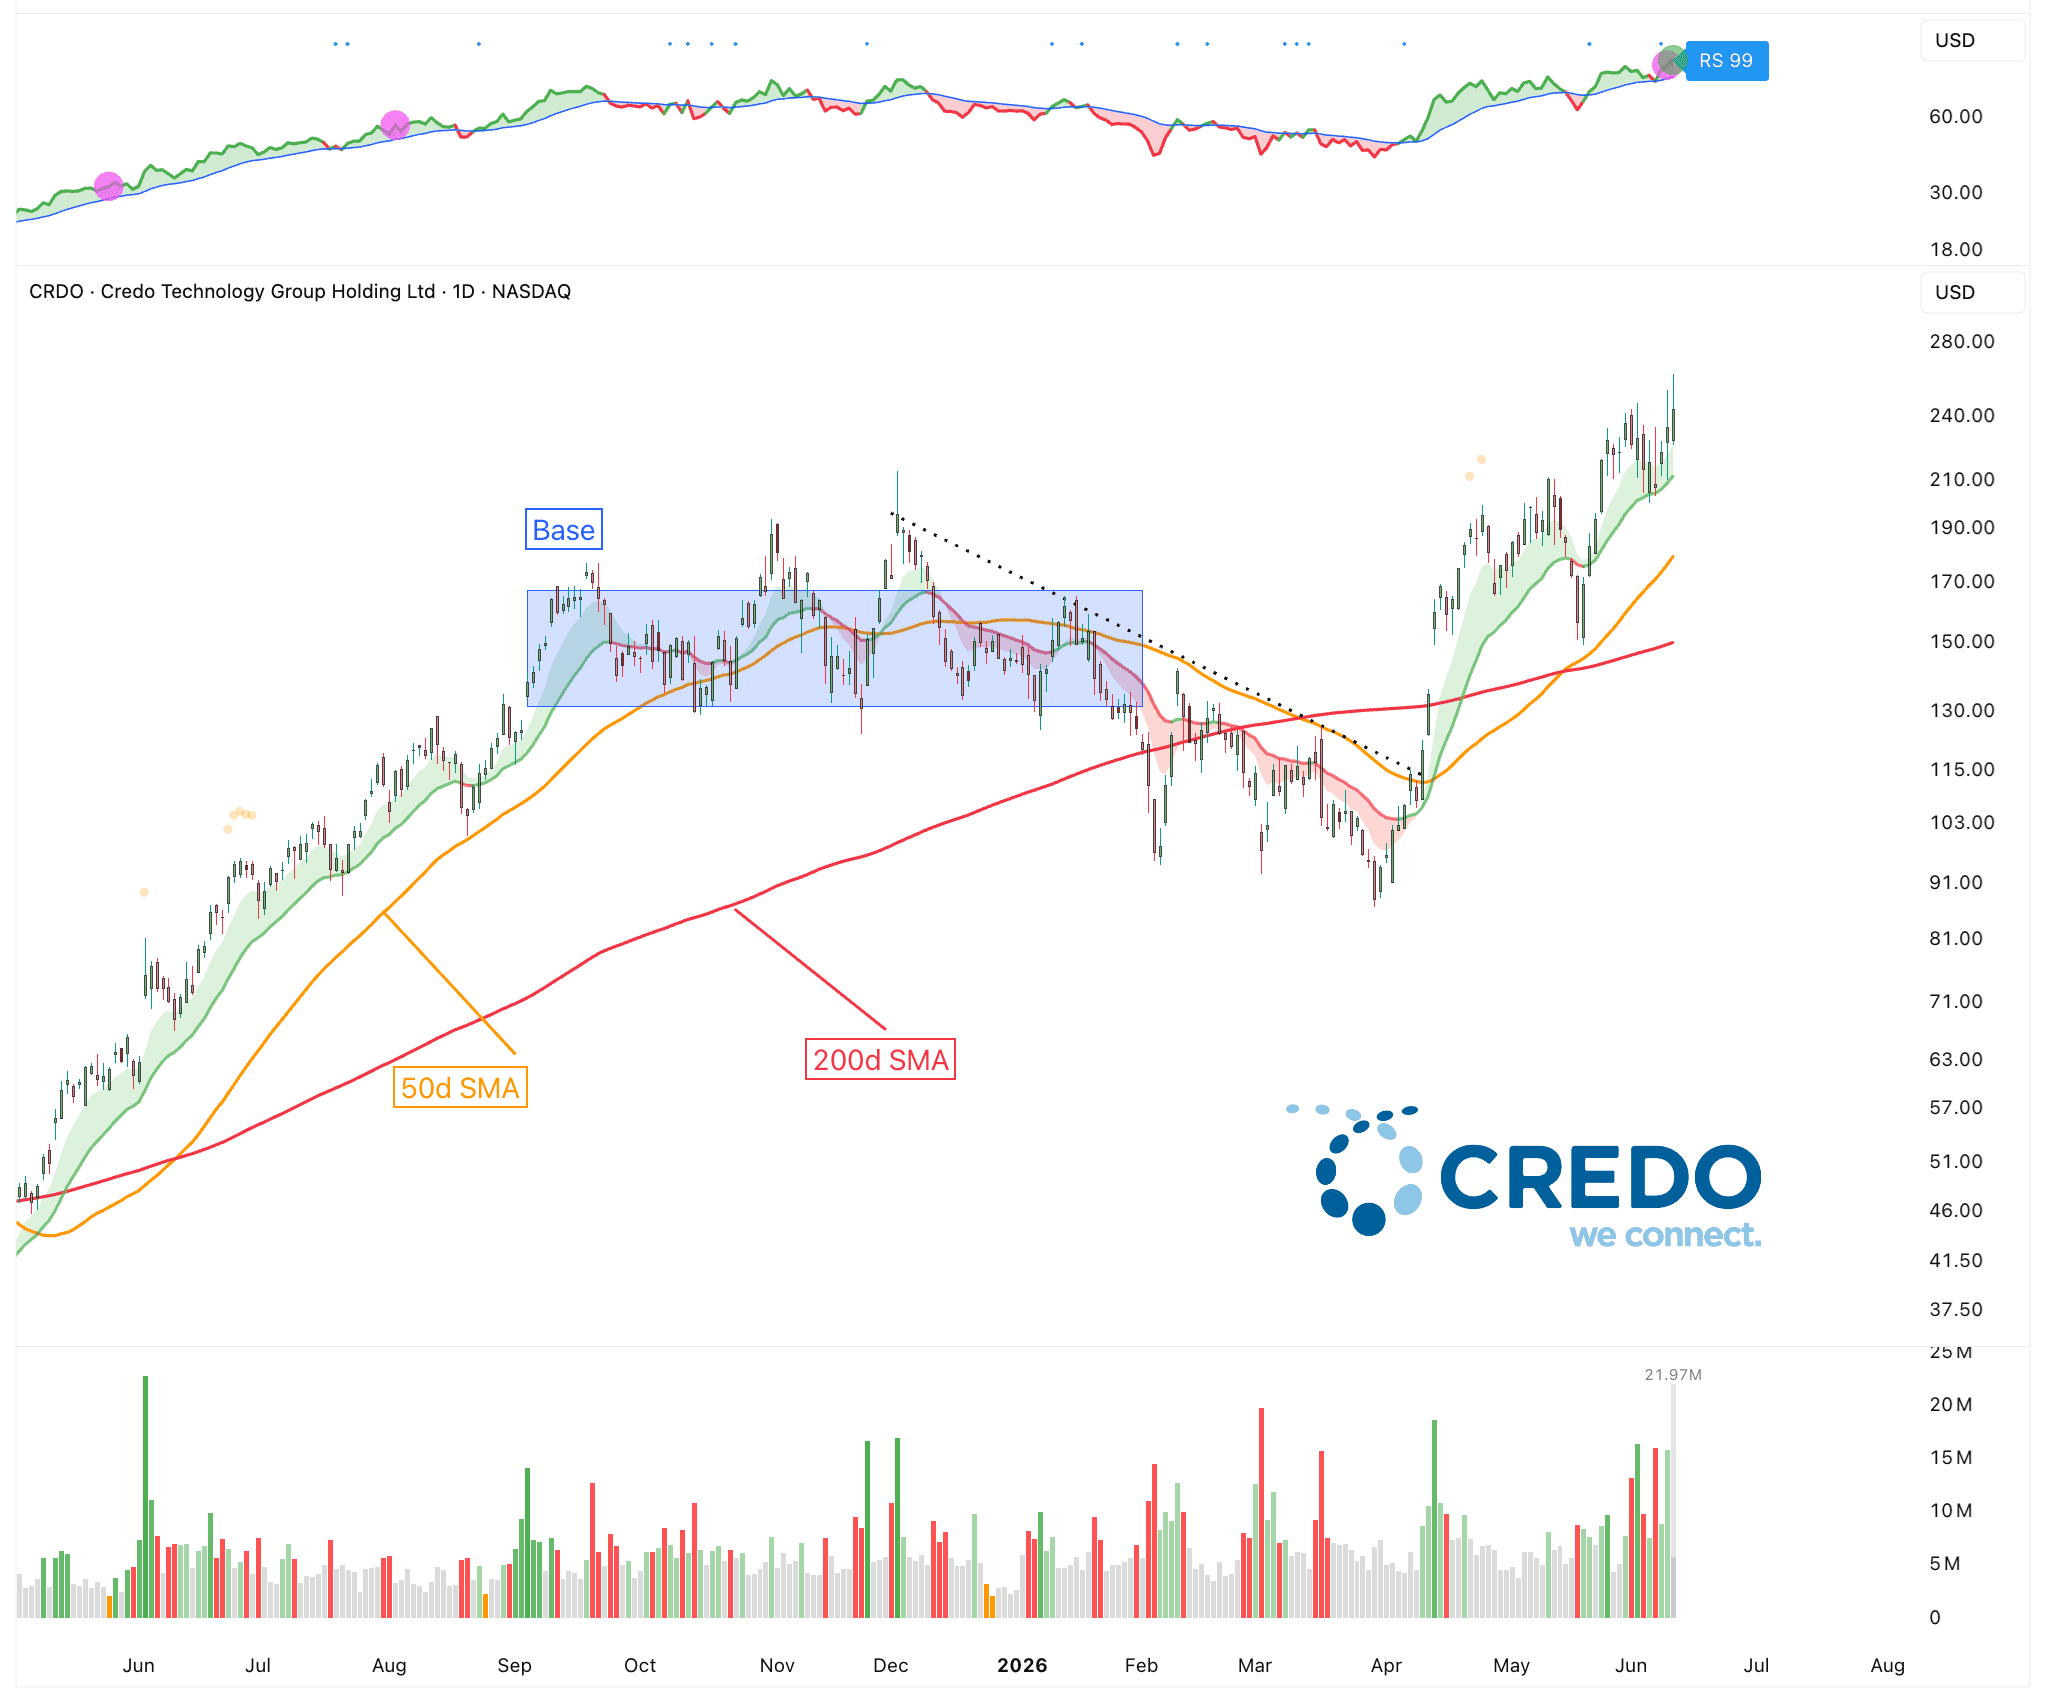
Credo Technology $CRDO
I’ve highlighted Credo a few times already. And it’s another good example of stocks that just go through natural cycles.
There are plenty more the goal is to know if the price action is normal or abnormal.
Because the way a stock pulls back tells you a lot about the quality of demand behind it.
A normal pullback means the stock is digesting a strong move without real damage. It may drift lower, touch key moving averages, or move sideways for a while, but it does not collapse. Because large holders are not rushing to sell. They are still willing to hold through market weakness.
The strongest stocks often correct in a controlled way before moving higher again. They give back some gains, reset overbought conditions, build a new base, and then become actionable again once the market stabilizes.
The opposite is also important. If a leader suddenly breaks key levels on heavy volume, slices through moving averages, and cannot bounce while the market recovers, that is an early warning sign.
So watching whether the price action is normal helps you separate healthy digestion from real distribution.
Read More
Lin
Market Update: In Focus
The general market has now gone through a 5% correction in less than two weeks.
We haven’t seen a move like this since the March lows, so of course it feels uncomfortable. But so far, there is still no reason to believe this is anything more than a normal correction.
We’ve just been spoiled over the last few months. The market pretty much went straight up for weeks, and every small dip got bought quickly. After a period like that, even a normal pullback suddenly feels like something is wrong.
But these kinds of moves are normal.
In a typical year, you should expect a few 5% pullbacks and at least 1 larger correction of around 10%. Even in bull markets, stocks need time to cool down. They cannot move higher every week forever.
We’re now about 5% off the highs and at a key level above the 50d SMA. That would be important to hold, at least short term. So, this could be an interesting spot for the market to bounce from.
Of course, there is also the possibility that we go even lower and maybe even revisit the 200d SMA, which would be a 10% correction. That’s important to keep in mind to maintain mental flexibility. But this is the less likely scenario.
One of the most important things to do during a pullback is to build a focus list or watchlist.
The goal is to prepare. A pullback gives you a second chance to buy leading stocks you might have missed initially. It also helps you identify the next set of potential leaders. They fall less, hold key moving averages, recover faster, and show relative strength while the broader market is under pressure.
This is incredibly valuable because you already know which names you want to focus on, where they become actionable, and where your risk is defined.
Here’s how that would look in practice.
Start with stocks that already had a strong trend before the pullback. Then check which ones are still above important moving averages, which ones are holding prior breakout areas, and which ones are refusing to make new lows while the index is falling. Those stocks are showing relative strength. Relative strength is important because it shows institutional demand. If everything is selling off, funds have to clearly set their buy orders.
Then narrow the list. Focus on the best 10 to 20 names that fit your portfolio and your strategy. Look for companies with strong earnings growth, rising estimates, improving margins, major catalysts, and clear demand from institutions. The best setups usually combine both sides: a strong business and a strong chart.
So, here are a few names that stand out right now. Many of these names have been discussed before or have been on the leaderboard for a while.
Syntec Optics $OPTX
Still holding this position. Although it is certainly a more volatile name, it continues to build higher highs and higher lows even while the market corrects.
Cardinal Infrastructure $CDNL
This is also a good example of what to expect after a correction. First, it sold off. Then it based above the 50d SMA, and now it’s back at all-time highs while the market corrects.
Digital Ocean $DOCN
This was my favorite name to watch for agentic AI software a few months ago. It continues to perform very well, and there is no one willing to sell even during this correction. This kind of price action is exactly what you want to see from a potential leader.
Oscar Health $OSCR
We’ve also seen a rotation from tech to consumer staples and more defensive names. One of the most interesting names right now is Oscar Health. It has been building a base for 2 years and just broke out. As they say, the higher the base, the bigger the space.
Ambiq Micro $AMBQ
Ambiq Micro is a recent chip IPO focused on ultra-low-power semiconductors for edge AI devices. It makes chips that allow small battery-powered devices to run more intelligence locally, without draining the battery too quickly. It broke out of its IPO base and has been consolidating nicely since then. This is also a good example of what to expect of new names that IPO.
Sandisk $SNDK
This is the undisputed leader from both this year and last year, and it continues to power higher. Nobody is willing to sell.
Nebius $NBIS
The leader in AI compute right now. A very order pullback so far. After such a strong run, some digestion is normal.
Credo Technology $CRDO
I’ve highlighted Credo a few times already. And it’s another good example of stocks that just go through natural cycles.
There are plenty more the goal is to know if the price action is normal or abnormal.
Because the way a stock pulls back tells you a lot about the quality of demand behind it.
A normal pullback means the stock is digesting a strong move without real damage. It may drift lower, touch key moving averages, or move sideways for a while, but it does not collapse. Because large holders are not rushing to sell. They are still willing to hold through market weakness.
The strongest stocks often correct in a controlled way before moving higher again. They give back some gains, reset overbought conditions, build a new base, and then become actionable again once the market stabilizes.
The opposite is also important. If a leader suddenly breaks key levels on heavy volume, slices through moving averages, and cannot bounce while the market recovers, that is an early warning sign.
So watching whether the price action is normal helps you separate healthy digestion from real distribution.
Read More
Exposure Level
Guidance:
Positive
0%
100%
Trend Indicator
Long-Term:
Up
Intermediate-Term:
Up
Short-Term:
Sideways
Risk Indicators
Volatility:
Elevated
Sentiment:
Neutral
Momentum:
Neutral
Leading Sectors
View All
Energy
Memory
Photonics
Semiconductors
AI Infrastructure
Market Snapshot
The market is in a full melt-up. Periods like these last longer than most people think. It's important to not bet against the trend, but instead the goal is to take advantage of it.
The Fullstack Investor Handbook
BASICS
5 Steps to Improve Your Investing Strategy
The Fullstack Investor Handbook
BASICS
5 Steps to Improve Your Investing Strategy